

Clouds trap solar energy, which helps to warm the atmosphere. A warmer atmosphere can hold more moisture and could build up even more clouds. These clouds would then trap more heat and…well, you get the idea. This is called a positive feedback mechanism. There are many positive feedback mechanisms in climate change. Another is albedo. As temperatures warm, snow and ice melt. This reduces albedo, which causes temperatures to warm and more snow and ice to melt.
Clouds also reflect energy and shade the land. This would help to reduce global temperatures. So scientists are not sure what the net effect of clouds on global temperatures is. Clouds are the second biggest uncertainty in climate models. The biggest is in how people’s behavior will change, to change human impacts on the atmosphere.
Although almost anything can happen with the weather, climate is more predictable. The weather on a particular winter day in San Diego may be colder than on the same day in Lake Tahoe, but, on average, Tahoe’s winter climate is significantly colder than San Diego’s ( Figure below ). Climate then is the long-term average of weather. Good climate is why we choose to vacation in Hawaii in February, even though the weather is not guaranteed to be good!

Figure 17.1
Lake Tahoe's climate makes it easy to predict that there will be snow in the winter.
Climate is the average of weather in that location over a long period of time, usually for at least 30 years. A location’s climate can be described by its air temperature, humidity, wind speed and direction, and the type, quantity, and frequency of precipitation. Climate can change, but only over long periods of time.
The climate of a region depends on its position relative to many things. These factors are described in the next sections.
The main factor influencing the climate of a region is latitude because different latitudes receive different amounts of solar radiation. To review from the Earth's Atmosphere chapter:
Recall from the Earth's Atmosphere chapter the circulation cells and global wind belts ( Figure below ):
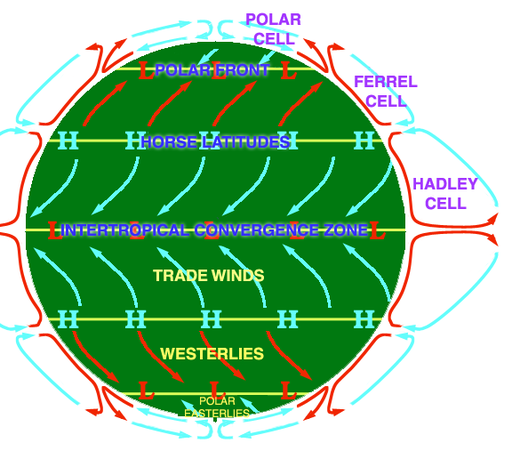
Figure 17.2
The atmospheric circulation cells and their relationships to air movement on the ground.
The position of a region relative to the circulation cells and wind belts has a great effect on its climate. In an area where the air is mostly rising or sinking, there is not much wind.
The Intertropical Convergence Zone (ITCZ) is the low pressure area near the equator in the boundary between the two Hadley Cells. The air rises so that it cools and condenses to create clouds and rain ( Figure below ). Climate along the ITCZ is therefore warm and wet. Early mariners called this region the doldrums because their ships were often unable to sail because there were no steady winds.
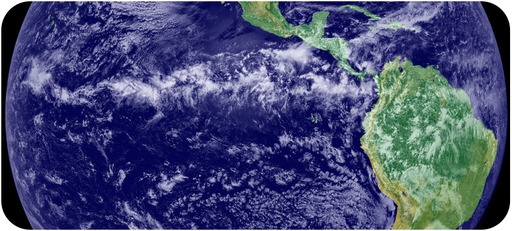
Figure 17.3
The ITCZ can easily be seen where thunderstorms are lined up north of the equator.
The ITCZ migrates slightly with the season. Land areas heat more quickly than the oceans. Because there are more land areas in the Northern Hemisphere, the ITCZ is influenced by the heating effect of the land. In Northern Hemisphere summer, it is approximately 5 o north of the equator while in the winter it shifts back and is approximately at the equator. As the ITCZ shifts, the major wind belts also shift slightly north in summer and south in winter, which causes the wet and dry seasons in this area ( Figure below ).
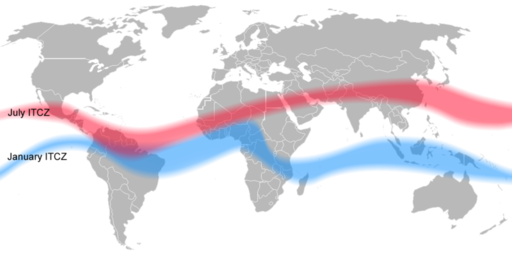
Figure 17.4
Seasonal differences in the location of the ITCZ are shown on this map.
At about 30 o N and 30 o S, the air is fairly warm and dry because much of it came from the equator where it lost most of its moisture at the ITCZ. At this location the air is descending, and sinking air warms and causes evaporation
Mariners named this region the horse latitudes. Sailing ships were sometimes delayed for so long by the lack of wind that they would run out of water and food for their livestock. Sailors tossed horses and other animals over the side after they died. Sailors sometimes didn’t make it either.
The polar front is around 50 o to 60 o , where cold air from the poles meets warmer air from the tropics. The meeting of the two different air masses causes the polar jet stream, which is known for its stormy weather. As the Earth orbits the Sun, the shift in the angle of incoming sunlight causes the polar jet stream to move. Cities to the south of the polar jet stream will be under warmer, moister air than cities to its north. Directly beneath the jet stream, the weather is often stormy and there may be thunderstorms and tornadoes.
The prevailing winds are the bases of the Hadley, Ferrell, and Polar Cells. These winds greatly influence the climate of a region because they bring the weather from the locations they come from. For example, in California, the predominant winds are the westerlies blowing in from the Pacific Ocean, which bring in relatively cool air in summer and relatively warm air in winter. Local winds also influence local climate. For example, land breezes and sea breezes moderate coastal temperatures.
When a particular location is near an ocean or large lake, the body of water plays an extremely important role in affecting the region’s climate.
The ocean’s influence in moderating climate can be seen in the following temperature comparisons. Each of these cities is located at 37 o N latitude, within the westerly winds ( Figure below ).
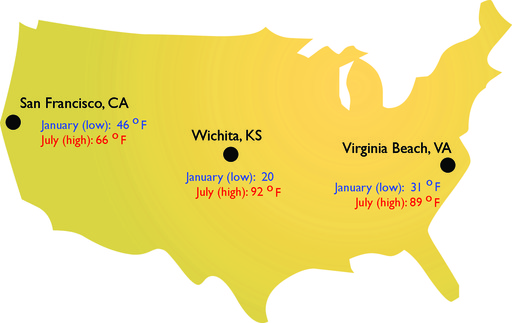
Figure 17.5
How does the ocean influence the climate of these three cities?
The temperature of the water offshore influences the temperature of a coastal location, particularly if the winds come off the sea. The cool waters of the California Current bring cooler temperatures to the California coastal region. Coastal upwelling also brings cold, deep water up to the ocean surface off of California, which contributes to the cool coastal temperatures. Further north, in southern Alaska, the upwelling actually raises the temperature of the surrounding land because the ocean water is much warmer than the land. The important effect of the Gulf Stream on the climate of northern Europe is described in the chapter, Earth's Oceans.
Air pressure -- and air temperature -- decrease with altitude. The closer molecules are packed together, the more likely they are to collide. Collisions between molecules give off heat, which warms the air. At higher altitudes, the air is less dense and air molecules are more spread out and less likely to collide. A location in the mountains has lower average temperatures than one at the base of the mountains. In Colorado, for example, Lakewood (5,640 feet) average annual temperature is 62 o F (17 o C), while Climax Lake (11,300 feet) is 42 o F (5.4 o C).
Mountain ranges have two effects on the climate of the surrounding region:

Figure 17.6
The Bonneville Salt Flats are part of the very dry Great Basin of the Sierra Nevada of California. The region receives little rainfall.
1. Describe the weather of the location where you are right now. How is the weather today typical or atypical of your usual climate for today’s date?
2. In what two ways could a desert be found at 30 o N?
3. Could a desert form at 45 o N latitude? Explain how.
4. Why is there so little wind in the locations where the atmospheric circulation cells meet?
5. If it is windy at 30 o N where there is normally little wind, does that mean the model of the atmospheric circulation cells is wrong?
6. What is the ITCZ? What winds do you expect to find there?
7. How does the polar jet stream move from summer to winter? How does this affect the climate of the locations where it moves?
8. Imagine two cities in North America. How does the climate of a city at 45 o N near the Pacific Ocean differ from one at the same latitude near the Atlantic Coast?
9. Why does the ocean water off California cool the western portion of the state, while the water off the southeastern United States warms that region?
10. Think about what you know about surface ocean currents. How would you expect the climate of western South America to be influenced by the Pacific Ocean? Could this same effect happen in the Northern Hemisphere?
11. The Andes Mountains line western South America. How do you think they influence the climate of that region and the lands to the east of them?
A climate zone results from the climate conditions of an area: its temperature, humidity, amount and type of precipitation, and the season. A climate zone is reflected in a region’s natural vegetation. Perceptive travelers can figure out which climate zone they are in by looking at the vegetation, even if the weather is unusual for the climate on that day.
The major factors that influence climate determine the different climate zones. In general, the same type of climate zone will be found at similar latitudes and in similar positions on nearly all continents, both in the Northern and Southern Hemispheres. The one exception to this pattern is the climate zones called the continental climates, which are not found at higher latitudes in the Southern Hemisphere. This is because the Southern Hemisphere land masses are not wide enough to produce a continental climate.
Five factors that Affect Climate
takes a very thorough look at what creates the climate zones. The climate of a region allows certain plants to grow, creating an ecological biome
(5f, 6a, 6b)
:
http://www.youtube.com/watch?v=E7DLLxrrBV8
(5:23).
Climate zones are classified by the Köppen classification system. This system is based on the temperature, the amount of precipitation, and the times of year when precipitation occurs. Since climate determines the type of vegetation that grows in an area, vegetation is used as an indicator of climate type.
A climate type and its plants and animals make up a biome . The organisms of a biome share certain characteristics around the world, because their environment has similar advantages and challenges. The organisms have adapted to that environment in similar ways over time. For example, different species of cactus live on different continents, but they have adapted to the harsh desert in similar ways ( Figure below ).
The similarities between climate zones and biome types are displayed in this video
(5e)
:
http://www.youtube.com/watch?v=Z_THTbynoRA
(1:01).
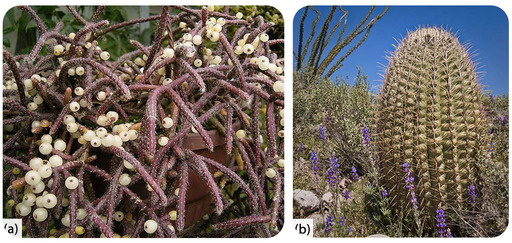
Figure 17.7
(a) The Mistletoe Cactus is found throughout the world. (b) A cactus in Arizona.
The Köppen classification system recognizes five major climate groups, each with a distinct capital letter A through E. Each lettered group is divided into subcategories. Some of these subcategories are forest (f), monsoon (m), and wet/dry (w) types, based on the amount of precipitation and season when that precipitation occurs ( Figure below ).

Figure 17.8
This world map of the K
Tropical Moist (Group A) climates are found in a band about 15 o to 25 o N and S of the equator ( Figure below ). What climate characteristics is the tropical moist climate group likely to have?
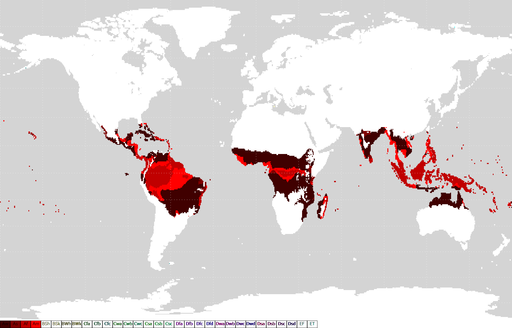
Figure 17.9
Tropical Moist Climates (Group A) are shown in red. The main vegetation for this climate is the tropical rainforest, as in the Amazon in South America, the Congo in Africa and the lands and islands of Southeast Asia.
The subcategories of this zone are based on when the rain falls.
The wet tropics have almost no annual temperature variation and tremendous amounts of rain fall year round, between 175 and 250 cm (65 and 100 inches). These conditions support the tropical rainforest biome ( Figure below ). Tropical rainforests are dominated by densely packed, broadleaf evergreen trees. These rainforests have the highest number of species or biodiversity of any ecosystem.
The tropical monsoon climate has very low precipitation for one to two months each year. Rainforests grow here because the dry period is short, and the trees survive off of soil moisture. This climate is found where the monsoon winds blow, primarily in southern Asia, western Africa, and northeastern South America ( Figure below ).

Figure 17.10
(a) Tropical rainforests lie in a band around the equator, covering about 10% of the Earth's land. This is the Amazon River and rainforest in Brazil. (b) Children in Guinea, west Africa, live in a tropical monsoon climate.
The tropical wet and dry climate lies between about 5 o and 20 o latitude, around the location of the ITCZ. In the summer, when the ITCZ drifts northward, the zone is wet. In the winter, when the ITCZ moves toward the equator, the region is dry. This climate exists where strong monsoon winds blow from land to sea, such as in India.
Rainforests cannot survive the months of low rainfall, so the typical vegetation is savanna ( Figure below ). This biome consists mostly of grasses, with widely scattered deciduous trees and rare areas of denser forests.

Figure 17.11
Central Africa is famous for its savanna and the unique animals that live there. A male lion stalks the African savanna.
The Dry Climates (Group B) have less precipitation than evaporation. Dry climate zones cover about 26% of the world’s land area ( Figure below ).
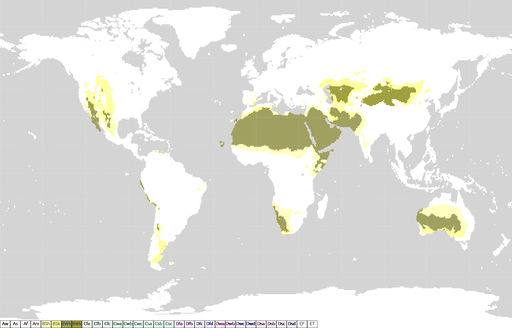
Figure 17.12
Dry Climates (Group B) are shown in green and yellow. Low latitude deserts are found at the Ferrell cell high pressure zone. Higher latitude deserts occur within continents or in rainshadows. Vegetation is sparse but well adapted to the dry conditions.
What climate characteristics is the dry climate group likely to have?
Low-latitude, arid deserts are found between 15 o to 30 o N and S latitudes. This is where warm dry air sinks at high pressure zones. True deserts make up around 12% of the world’s lands ( Figure below ).

Figure 17.13
The Sahara is the world
In the Sonoran Desert of the southwestern United States and northern Mexico, skies are clear. The typical weather is extremely hot summer days and cold winter nights. Although annual rainfall is less than 25 cm (10 inches), rain falls during two seasons. Pacific storms bring winter rains and monsoons bring summer rains. Since organisms do not have to go too many months without some rain, a unique group of plants and animals can survive in the Sonoran desert ( Figure below ).
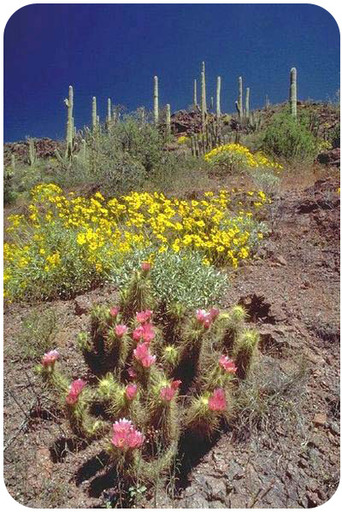
Figure 17.14
Plants in the Sonoran Desert are adapted to surviving long periods of drought. Cacti and shrubby plants have wide or deep roots to reach water after a rain. Some plants store water; others lie dormant as seeds and bloom after rain falls.
Higher latitude semi-arid deserts, also called steppe , are found in continental interiors or in rainshadows. Semi-arid deserts receive between 20 and 40 cm (8 to 16 inches) of rain annually. The annual temperature range is large. In the United States, the Great Plains, portions of the southern California coast, and the Great Basin are semi-arid deserts ( Figure below ).
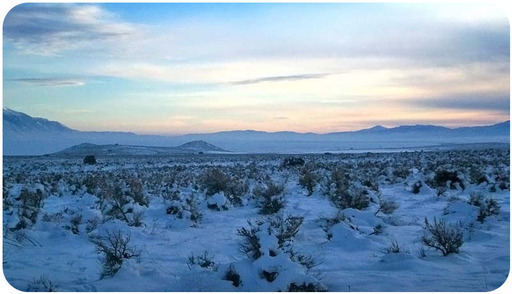
Figure 17.15
The steppe biome has short bunch grass, scattered low bushes, sagebrush and few or no trees because there is not enough rain. The Great Basin in Utah illustrates the steppe biome.
The Moist Subtropical Mid-latitude (Group C) climates are found along the coastal areas in the United States ( Figure below ).
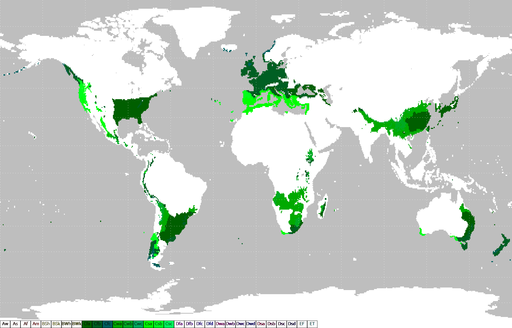
Figure 17.16
Moist Subtropical Mid-Latitude climates are shown in green.
What climate characteristics is the moist subtropical group likely to have?
This
Ecosystem Ecology
video lecture at U.C. Berkley outlines the factors that create climate zones and consequently the biomes
(5f)
:
http://www.youtube.com/watch?v=3tY3aXgX4AM
(46:46).
The Dry Summer Subtropical climate is found on the western sides of continents between 30 o and 45 o latitude. Annual rainfall is 30 to 90 cm (14 to 35 inches), most of which comes in the winter ( Figure below ).

Figure 17.17
The Mediterranean Climate is also known as the Dry Summer Subtropical Climate.
The climate is typical of coastal California, which sits beneath a summertime high pressure for about five months each year. Land and sea breezes make winters moderate and summers cool. Vegetation must survive long summer droughts ( Figure below ). The scrubby, woody vegetation that thrives in this climate is called chaparral .

Figure 17.18
Chaparral in coastal California
The Humid Subtropical climate zone is found mostly on the eastern sides of continents ( Figure below ). Rain falls throughout the year with annual averages between 80 and 165 cm (31 and 65 inches). Summer days are humid and hot, from the lower 30's up to 40 o C (mid-80's up to 104 o F). Afternoon and evening thunderstorms are common. These conditions are caused by warm tropical air passing over the hot continent. Winters are mild, but middle-latitude storms called cyclones may bring snow and rain. The southeastern United States, with its hot humid summers and mild, but frosty winters, is typical of this climate zone.
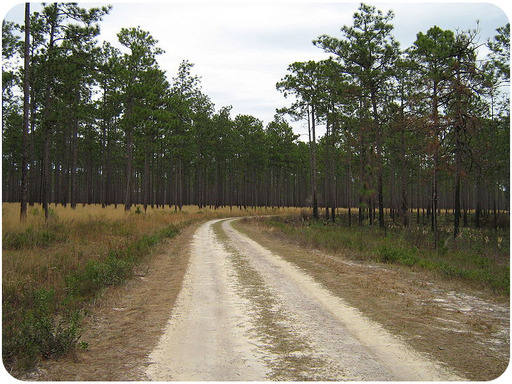
Figure 17.19
Trees grow thickly because of the mild temperatures and high humidity. Pine forests are common in the lower latitudes, oak forests are common at higher latitudes.
This climate lines western North America between 40 o and 65 o latitude, an area known as the Pacific Northwest ( Figure below ). Ocean winds bring mild winters and cool summers. The temperature range, both daily and annually, is fairly small. Rain falls year round, although summers are drier as the jet stream moves northward. Low clouds, fog, and drizzle are typical. In Western Europe the climate covers a larger region since no high mountains are near the coast to block wind blowing off the Atlantic.

Figure 17.20
(a) The Pacific Northwest is marked by green forests. (b) Dense forests of Douglas fir thrive in the heavy rain and mild temperatures in the Pacific Northwest.
Continental (Group D) climates are found in most of the North American interior from about 40°N to 70°N. What climate characteristics is the continental group most likely to have?
Trees grow in continental climates, even though winters are extremely cold, because the average annual temperature is fairly mild. Continental climates are not found in the Southern Hemisphere because of the absence of a continent large enough to generate this effect.
The humid continental climates are found around the polar front in North America and Europe ( Figure below ). In the winter, middle-latitude cyclones bring chilly temperatures and snow. In the summer, westerly winds bring continental weather and warm temperatures. The average July temperature is often above 20 o C (70 o F). The region is typified by deciduous trees, which protect themselves in winter by losing their leaves.
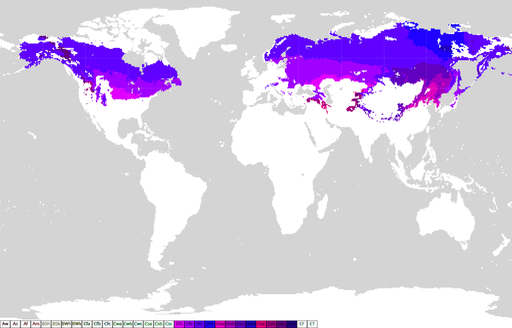
Figure 17.21
The humid continental climate zone is found at about 60
The two variations of this climate are based on summer temperatures.
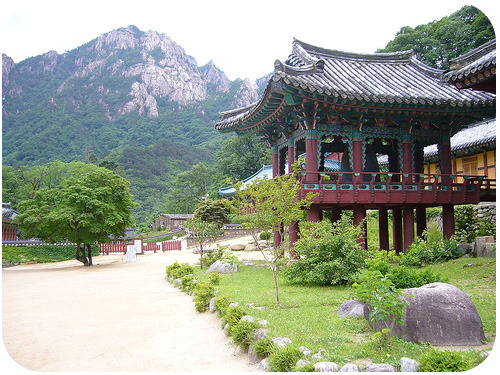
Figure 17.22
Parts of South Korea are in the humid continental climate zone.
The subpolar climate is dominated by the continental polar air that masses over the frigid continent ( Figure below ). Snowfall is light, but cold temperatures keep snow on the ground for months. Most of the approximately 50 cm (20 inches) of annual precipitation falls during summer cyclonic storms. The angle of the Sun's rays is low but the Sun is visible in the sky for most or all of the day during the summer, so temperatures may get warm, but are rarely hot. These continental regions have extreme annual temperature ranges. The boreal, coniferous forests found in the subpolar climate are called taiga and have small, hardy, and widely spaced trees. Taiga vast forests stretch across Eurasia and North America.

Figure 17.23
(a) The location of the subpolar climate. (b) The taiga of the Alaska Range in Alaska.
Polar climates are found across the continents that border the Arctic Ocean, Greenland, and Antarctica. What climate characteristics is the polar climate group most likely to have?
The polar tundra climate is continental, with severe winters ( Figure below ). Temperatures are so cold that a layer of permanently frozen ground, called permafrost forms below the surface. This frozen layer can extend hundreds of meters deep. The average temperature of the warmest months is above freezing, so summer temperatures defrost the uppermost portion of the permafrost. In winter, the permafrost prevents water from draining downward. In summer, the ground is swampy. Although the precipitation is low enough in many places to qualify as a desert, evaporation rates are also low, so the landscape receives more usable water than a desert.
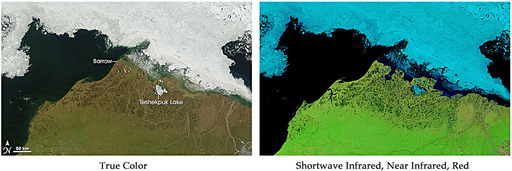
Figure 17.24
Polar tundra on the North Slope of Alaska
Because of the lack of ice-free land near the South Pole, there is very little tundra in the Southern Hemisphere ( Figure below ). The only plants that can survive the harsh winters and soggy summers are small ground-hugging plants like mosses, lichens, small shrubs, and scattered small trees that make up the tundra .

Figure 17.25
(a) The area surrounding the Arctic Ocean is the only part of the globe with much tundra. (b) Roots cannot grow deep into the permafrost and conditions are harsh so plants are small. Tundra loses its green in the fall, as mosses and leaves turn brown.
Ice caps are found mostly on Greenland and Antarctica, about 9% of the Earth's land area ( Figure below ). Ice caps may be thousands of meters thick. Ice cap areas have extremely low average annual temperatures, e.g. -29 o C (-20 o F) at Eismitte, Greenland. Precipitation is low because the air is too cold to hold much moisture. Snow occasionally falls in the summer.
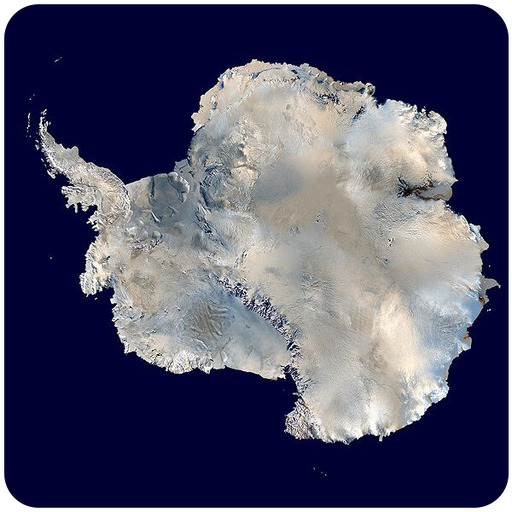
Figure 17.26
A composite satellite image of Antarctica. Almost all the continent is covered with an ice cap.
When climate conditions in a small area are different from those of the surroundings, the climate of the small area is called a microclimate . The microclimate of a valley may be cool relative to its surroundings since cold air sinks. The ground surface may be hotter or colder than the air a few feet above it, because rock and soil gain and lose heat readily. Different sides of a mountain will have different microclimates. In the Northern Hemisphere, a south-facing slope receives more solar energy than a north-facing slope, so each side supports different amounts and types of vegetation.
Altitude mimics latitude in climate zones ( Figure below ). Climates and biomes typical of higher latitudes may be found in other areas of the world at high altitudes.

Figure 17.27
Mt. Kilimanjaro in Africa lies near the equator in the tropics. At the top of the mountain is tundra and a small glacier. At lower elevation are thick forests with savannah surrounding the base of the mountain. This is a 3-D radar image.
1. Why are most climate zones found in similar locations on continents within the Northern Hemisphere?
2. Why do climate zones differ between continents, even though locations are similar?
3. Why do organisms in the same biome often look the same even though they are not the same species? Think about desert plants, for example. Why are the plants that live in low latitude deserts on different continents so similar?
4. Why is the length of the dry season important in distinguishing different types of climate zones? Give an example.
5. Since the equator receives the most solar radiation over the course of a year, why are the hottest temperatures found in the low-latitude deserts? Why are low-latitude deserts often chilly at night, even in the summer?
6. What are the differences between arid and semi-arid deserts?
7. What conditions bring about the hot and humid summer days of the American South?
8. What is the most important factor in determining the presence of a forest?
9. Look at the map of the Koppen climate classification system. Which climate types are found and where are they found in California? Which is most abundant? Why does California have so many major climate types?
10. Polar regions receive little precipitation. Why are they not considered deserts?
11. What is permafrost? Does it stay the same year round?
12. Why are microclimates important to living things?
A tutorial on the world’s biomes from U.C. Berkeley: http://www.ucmp.berkeley.edu/exhibits/biomes/index.php.
For the past two centuries, climate has been relatively stable. People placed their farms and cities in locations that were in a favorable climate without thinking that the climate could change. But climate has changed throughout Earth history, and a stable climate is not the norm. In recent years, Earth’s climate has begun to change again. Most of this change is warming because of human activities that release greenhouse gases into the atmosphere. The effects of warming are already being seen and will become more extreme as temperature rise.
Climate has changed throughout Earth history. Much of the time Earth's climate was hotter and more humid than it is today, but climate has also been colder, as when glaciers covered much more of the planet. The most recent ice ages were in the Pleistocene Epoch, between 1.8 million and 10,000 years ago ( Figure below ). Glaciers advanced and retreated in cycles, known as glacial and interglacial periods. With so much of the world’s water bound into the ice, sea level was about 125 meters (395 feet) lower than it is today. Many scientists think that we are now in a warm, interglacial period that has lasted about 10,000 years.

Figure 17.28
The maximum extent of Northern Hemisphere glaciers during the Pleistocene epoch.
For the past 2,000 years, climate has been relatively mild and stable when compared with much of Earth’s history. Why has climate stability been beneficial for human civilization? Stability has allowed the expansion of agriculture and the development of towns and cities.
Fairly small temperature changes can have major effects on global climate. The average global temperature during glacial periods was only about 5.5 o C (10 o F) less than Earth’s current average temperature. Temperatures during the interglacial periods were about 1.1 o C (2.0 o F) higher than today ( Figure below ).
Since the end of the Pleistocene, the global average temperature has risen about 4 o C (7 o F). Glaciers are retreating and sea level is rising. While climate is getting steadily warmer, there have been a few more extreme warm and cool times in the last 10,000 years. Changes in climate have had effects on human civilization.
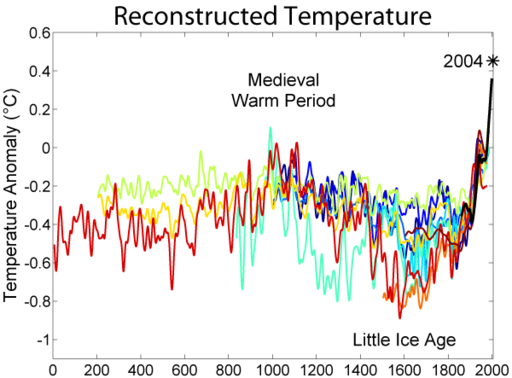
Figure 17.29
The graph is a compilation of 10 reconstructions (the colored lines) of mean temperature changes and one graph of instrumentally recorded data of mean temperature changes (black). This illustrates the high temperatures of the Medieval Warm Period, the lows of the Little Ice Age, and the very high (and climbing) temperature of this decade.
Short-term changes in climate are common ( Figure below ). The largest and most important of these is the oscillation between El Niño and La Niña conditions. This cycle is called the ENSO (El Niño southern oscillation). The ENSO drives changes in climate that are felt around the world about every two to seven years.
In a normal year, the trade winds blow across the Pacific Ocean near the equator from east to west (toward Asia). A low pressure cell rises above the western equatorial Pacific. Warm water in the western Pacific Ocean and raises sea levels by one-half meter. Along the western coast of South America, the Peru Current carries cold water northward, and then westward along the equator with the trade winds. Upwelling brings cold, nutrient-rich waters from the deep sea.

Figure 17.30
Under normal conditions, low pressure and warm water (shown in red) build up in the western Pacific Ocean. Notice that continents are shown in brown in the image. North and South America are on the right in this image.
In an El Niño year, when water temperature reaches around 28 o C (82 o F), the trade winds weaken or reverse direction and blow east (toward South America) ( Figure below ). Warm water is dragged back across the Pacific Ocean and piles up off the west coast of South America. With warm, low-density water at the surface, upwelling stops. Without upwelling, nutrients are scarce and plankton populations decline. Since plankton form the base of the food web, fish cannot find food, and fish numbers decrease as well. All the animals that eat fish, including birds and humans, are affected by the decline in fish.

Figure 17.31
In El Ni
By altering atmospheric and oceanic circulation, El Niño events change global climate patterns.
An El Niño cycle lasts one to two years. Often normal circulation patterns resume. Sometimes circulation patterns bounce back quickly and extremely ( Figure below ). This is a La Niña .
In a La Niña year, as in a normal year, trade winds moves from east to west and warm water piles up in the western Pacific Ocean. Ocean temperatures along coastal South America are colder than normal (instead of warmer, as in El Niño). Cold water reaches farther into the western Pacific than normal.
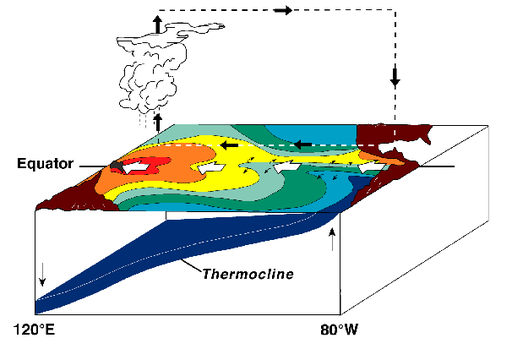
Figure 17.32
A La Ni
An online guide to El Niño and La Niña events from the University of Illinois is found here: http://ww2010.atmos.uiuc.edu/%28Gh%29/guides/mtr/eln/home.rxml .
El Niño and La Niña are explained in a National Geographic vides found at National Geographic Video, Natural disaster, Landslides, and More: El Niño
Other important oscillations are smaller and have a local, rather than global, effect. The North Atlantic Oscillation mostly alters climate in Europe. The Mediterranean also goes through cycles, varying between being dry at some times, and warm and wet at others.
The ABC News video explores the relationship of El Niño to global warming. El Niño is named as the cause of strange weather across the United States in the winter of 2007 in this video
(5g)
:
http://www.youtube.com/watch?v=5uk9nwtAOio&feature=related
(3:33).
Many processes can cause climate to change. These include changes:
The amount of energy the Sun radiates is variable. Sunspots are magnetic storms on the Sun’s surface that increase and decrease over an 11-year cycle ( Figure below ). When the number of sunspots is high, solar radiation is also relatively high. But the entire variation in solar radiation is tiny relative to the total amount of solar radiation that there is and there is no known 11-year cycle in climate variability. The Little Ice Age corresponded to a time when there were no sunspots on the Sun.

Figure 17.33
Sunspots on the face of the Sun.
Plate tectonic movements can alter climate. Over millions of years as seas open and close, ocean currents may distribute heat differently. For example, when all the continents are joined into one supercontinent (such as Pangaea), nearly all locations experience a continental climate. When the continents separate, heat is more evenly distributed.
Plate tectonic movements may help start an ice age. When continents are located near the poles, ice can accumulate, which may increase albedo and lower global temperature. Low enough temperatures may start a global ice age.
Plate motions trigger volcanic eruptions, which release dust and CO 2 into the atmosphere. Ordinary eruptions, even large ones, have only a short-term effect on weather ( Figure below ). Massive eruptions of the fluid lavas that create lava plateaus release much more gas and dust, and can change climate for many years. This type of eruption is exceedingly rare; none has occurred since humans have lived on Earth.

Figure 17.34
An eruption like Sarychev Volcano (Kuril Islands, northeast of Japan) in 2009 would have very little impact on weather.
The most extreme climate of recent Earth history was the Pleistocene. Scientists attribute a series of ice ages to variation in the Earth's position relative to the Sun, known as Milankovitch cycles .
The Earth goes through regular variations in its position relative to the Sun:
1. The shape of the Earth's orbit changes slightly as it goes around the Sun. The orbit varies from more circular to more elliptical in a cycle lasting between 90,000 and 100,000 years. When the orbit is more elliptical, there is a greater difference in solar radiation between winter and summer.
2. The planet wobbles on its axis of rotation. At one extreme of this 27,000 year cycle, the Northern Hemisphere points toward the Sun when the Earth is closest to the Sun. Summers are much warmer and winters are much colder than now. At the opposite extreme, the Northern Hemisphere points toward the Sun when it is farthest from the Sun. This results in chilly summers and warmer winters.
3. The planet’s tilt on its axis varies between 22.1 o and 24.5 o . Seasons are caused by the tilt of Earth's axis of rotation, which is at a 23.5 o angle now. When the tilt angle is smaller, summers and winters differ less in temperature. This cycle lasts 41,000 years.
When these three variations are charted out, a climate pattern of about 100,000 years emerges. Ice ages correspond closely with Milankovitch cycles. Since glaciers can form only over land, ice ages only occur when landmasses cover the polar regions. Therefore, Milankovitch cycles are also connected to plate tectonics.
Since greenhouse gases trap the heat that radiates off the planet’s surfaces what would happen to global temperatures if atmospheric greenhouse gas levels decreased? What if greenhouse gases increased? A decrease in greenhouse gas levels decreases global temperature and an increase raises air temperature.
Greenhouse gas levels have varied throughout Earth history. For example, CO 2 has been present at concentrations less than 200 parts per million (ppm) and more than 5,000 ppm. But for at least 650,000 years, CO 2 has never risen above 300 ppm, during either glacial or interglacial periods ( Figure below ).

Figure 17.35
Natural processes add and remove CO 2 from the atmosphere
When plants are turned into fossil fuels the CO 2 in their tissue is stored with them. So CO 2 is removed from the atmosphere. What does this do to Earth’s average temperature?
What happens to atmospheric CO 2 when the fossil fuels are burned? What happens to global temperatures?
Fossil fuel use has skyrocketed in the past few decades more people want more cars and industrial products. This has released CO 2 into the atmosphere.
Burning tropical rainforests, to clear land for agriculture, a practice called slash-and-burn agriculture , also increases atmospheric CO 2 . By cutting down trees, they can no longer remove CO 2 from the atmosphere. Burning the trees releases all the CO 2 stored in the trees into the atmosphere.
There is now nearly 40% more CO 2 in the atmosphere than there was 200 years ago, before the Industrial Revolution. About 65% of that increase has occurred since the first CO 2 measurements were made on Mauna Loa Volcano, Hawaii, in 1958 ( Figure below ).
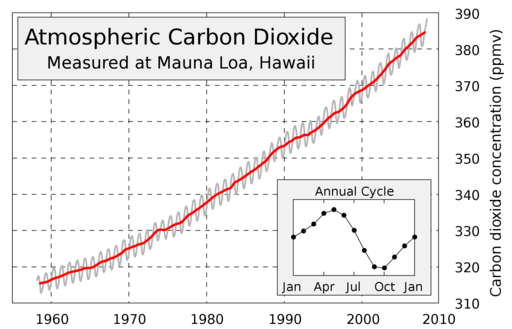
Figure 17.36
The Keeling Curve shows the increase in atmospheric CO
CO 2 is the most important greenhouse gas that human activities affect because it is so abundant. But other greenhouse gases are increasing as well. A few are:
With more greenhouse gases trapping heat, average annual global temperatures are rising. This is known as global warming .
Global warming - How Humans are Affecting our Planet
from NASA, discusses the basics of global warming science
(4c)
:
http://www.youtube.com/watch?feature=player_profilepage&v=VXvGPbHXxtc#!
(7:58).
While temperatures have risen since the end of the Pleistocene, 10,000 years ago, this rate of increase has been more rapid in the past century, and has risen even faster since 1990. The nine warmest years on record have all occurred since 1998, and the 15 warmest years have occurred since 1990 (through 2009) ( Figure below ). The 2000s were the warmest decade yet.
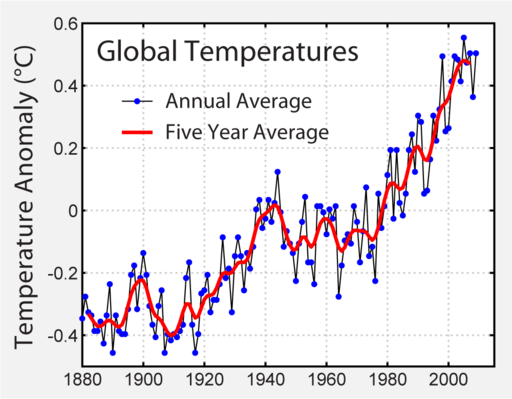
Figure 17.37
Recent temperature increases show how much temperature has risen since the Industrial Revolution began.
Annual variations aside, the average global temperature increased about 0.8 o C (1.5 o F) between 1880 and 2010, according to the Goddard Institute for Space Studies, NOAA. This number doesn’t seem very large. Why is it important? http://www.giss.nasa.gov/research/news/20100121/
The United States has long been the largest emitter of greenhouse gases, with about 20% of total emissions in 2004 ( Figure below ). As a result of China’s rapid economic growth, its emissions surpassed those of the United States in 2008. However, it’s also important to keep in mind that the United States has only about one-fifth the population of China. What’s the significance of this? The average United States citizen produces far more greenhouse gases than the average Chinese person.
An animation of CO 2 released by different fossil fuels is seen here: CO 2 release by different fossil fuels http://www.nature.nps.gov/GEOLOGY/usgsnps/oilgas/CO2BTU_3.MPG
If nothing is done to decrease the rate of CO 2 emissions, by 2030, CO 2 emissions are projected to be 63% greater than they were in 2002.
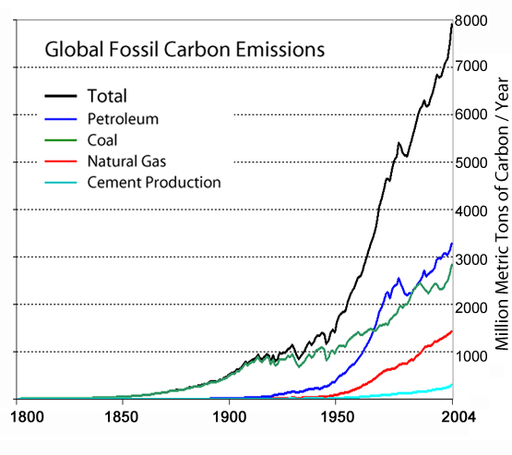
Figure 17.38
Global CO
A number of videos on the National Geographic site deal with global warming. Go to National Geographic Videos, Environment Videos, Global Warming, http://video.nationalgeographic.com/video/player/environment/.
The amount CO 2 levels will rise in the next decades is unknown. What will this number depend on in the developed nations? What will it depend on in the developing nations? In the developed nations it will depend on technological advances or lifestyle changes that decrease emissions. In the developing nations, it will depend on how much their lifestyles improve and how these improvements are made.
Computer models are used to predict the effects of greenhouse gas increases on climate for the planet as a whole and also for specific regions. If nothing is done to control greenhouse gas emissions and they continue to increase at current rates, the surface temperature of the Earth can be expected to increase between 0.5 o C and 2.0 o C (0.9 o F and 3.6 o F) by 2050 and between 2 o and 4.5 o C (3.5 o and 8 o F) by 2100, with CO 2 levels over 800 parts per million (ppm) ( Figure below ). On the other hand, if severe limits on CO 2 emissions begin soon, temperatures could rise less than 1.1 o C (2 o F) by 2100.
This video explores the tools NASA scientists use to determine how the climate is changing
(6d)
:
http://www.youtube.com/watch?v=JRayIgKublg&feature=channel
(4:00).

Figure 17.39
Various climate prediction models show how temperature is likely to rise by 2100.
Whatever the temperature increase, it will not be uniform around the globe. A rise of 2.8 o C (5 o F) would result in 0.6 o to 1.2 o C (1 o to 2 o F) at the equator, but up to 6.7 o C (12 o F) at the poles. So far, global warming has affected the North Pole more than the South Pole, but temperatures are still increasing at Antarctica ( Figure below ).
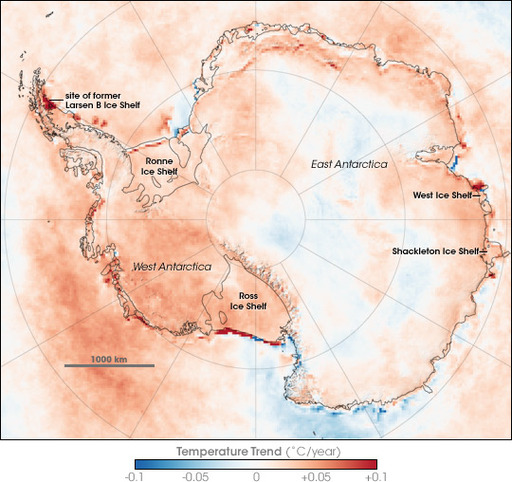
Figure 17.40
Temperature changes over Antarctica.
The following images show changes in the earth and organisms as a result of global warming ( Figure below ), ( Figure below ), ( Figure below ).

Figure 17.41
(a) Breakup of the Larsen Ice Shelf in Antarctica in 2002 was related to climate warming in the region. (b) The Boulder Glacier has melted back tremendously since 1985. Other mountain glaciers around the world are also melting.

Figure 17.42
Permafrost is melting and its extent decreasing. There are now fewer summer lakes in Siberia.
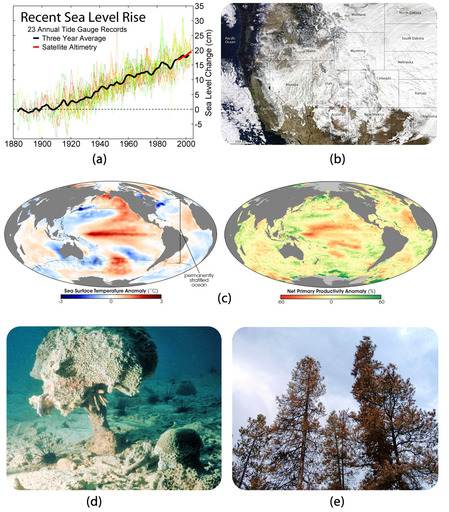
Figure 17.43
(a) Melting ice caps add water to the oceans, so sea level is rising Remember that water slightly expands as it warms
The timing of events for species is changing. Mating and migrations take place earlier in the spring months. Species that can are moving their ranges uphill. Some regions that were already marginal for agriculture are no longer farmable because they have become too warm or dry.
Modeled Climate Induced Glacier change in Glacier National Park 1850-2100 http://www.nrmsc.usgs.gov/research/glacier_model.htm
What are the two major effects being seen in this animation? Glaciers are melting and vegetation zones are moving uphill. If fossil fuel use exploded in the 1950s, why do these changes begin early in the animation? Does this mean that the climate change we are seeing is caused by natural processes and not by fossil fuel use?
Animations of temperature anomalies for 5- and 10-year periods: http://data.giss.nasa.gov/gistemp/animations/
As greenhouse gases increase, changes will be more extreme. Oceans will become slightly more acidic, making it more difficult for creatures with carbonate shells to grow, and that includes coral reefs. A study monitoring ocean acidity in the Pacific Northwest found ocean acidity increasing ten times faster than expected and 10% to 20% of shellfish (mussels) being replaced by acid tolerant algae.
Plant and animal species seeking cooler temperatures will need to move poleward 100 to 150 km (60 to 90 miles) or upward 150 m (500 feet) for each 1.0 o C (8 o F) rise in global temperature. There will be a tremendous loss of biodiversity because forest species can’t migrate that rapidly. Biologists have already documented the extinction of high-altitude species that have nowhere higher to go.
Decreased snowpacks, shrinking glaciers, and the earlier arrival of spring will all lessen the amount of water available in some regions of the world, including the western United States and much of Asia. Ice will continue to melt and sea level is predicted to rise 18 to 97 cm (7 to 38 inches) by 2100 ( Figure below ). An increase this large will gradually flood coastal regions where about one-third of the world's population lives, forcing billions of people to move inland.

Figure 17.44
Sea ice thickness around the North Pole has been decreasing in recent decades and will continue to decrease in the coming decades.
Weather will become more extreme with heat waves and droughts. Some modelers predict that the Midwestern United States will become too dry to support agriculture and that Canada will become the new breadbasket. In all, about 10% to 50% of current cropland worldwide may become unusable if CO 2 doubles.
Although scientists do not all agree, hurricanes are likely to become more severe and possibly more frequent. Tropical and subtropical insects will expand their ranges, resulting in the spread of tropical diseases such as malaria, encephalitis, yellow fever, and dengue fever.
You may notice that the numerical predictions above contain wide ranges. Sea level, for example, is expected to rise somewhere between 18 and 97 cm — quite a wide range. What is the reason for this uncertainty? It is partly because scientists cannot predict exactly how the Earth will respond to increased levels of greenhouses gases. How quickly greenhouse gases continue to build up in the atmosphere depends in part on the choices we make.
An important question people ask is this: Are the increases in global temperature natural? In other words, can natural variations in temperature account for the increase in temperature that we see? The answer is no. Changes in the Sun’s irradiance, El Niño and La Niña cycles, natural changes in greenhouse gas, and other atmospheric gases cannot account for the increase in temperature that has already happened in the past decades.
This video discusses how, by using the CERES satellite, scientists monitor energy in the atmosphere, including incoming solar energy and reflected and absorbed energy. Greenhouse warming that results from atmospheric greenhouse gasses is also monitored
(4c)
:
http://www.youtube.com/watch?v=JFfD6jn_OvA
(4:31).
1. Why is the climate currently warming?
2. Why does sea level rise and fall during interglacial and glacial periods?
3. How can the human history of Greenland be related to climate cycles?
4. If climate has been much warmer in Earth history, why do we need to worry about global warming now?
5. When the weather along coastal California is especially rainy with many winter storms, what is likely to be happening in the equatorial Pacific?
6. The Peruvian anchovy fishery collapsed in 1972. Using what you know about climate and food webs, can you devise an explanation for this event?
7. What two events must occur for there to be an ice age?
8. What human activities increase greenhouse gases in the atmosphere? Explain.
9. Why are CO 2 emissions projected to increase during the next few decades?
10. What role will the developed nations play in increasing CO 2 emissions in the next few decades?
11. Why do storms increase in frequency and intensity as global temperatures increase?
12. Earth is undergoing some important changes, some of which are known about because of and monitored by satellites. Describe the sort of global change that satellites can monitor.
13. What will happen if sea level rises by 60 cm (2 feet) by the end of this century? Which locations will be hardest hit?
14. What can be done to reduce greenhouse gas emissions?
Virtually all credible scientists agree that Earth is warming and human actions are largely to blame. The evidence comes from many areas of science: atmospheric chemistry, earth history, glaciology, ecology, astronomy (stars, the Sun), energy (fossil fuels), oceanography, remote sensing, agricultural science, and others. Because the media like to present a “balanced” story, media outlets often present the side of climate skeptics who do not believe that global warming is happening, or that if it is happening, that human actions are largely responsible.
From the following videos you can learn basic global warming science, the effects already being seen from changing climate, and learn a bit about risk assessment:
Global Warming 101 touches on all aspects of the global warming story in just a few minutes
(1l - I&E Stand.)
:
http://www.youtube.com/watch?v=-lubjnPA0b0&feature=player_profilepage
(1:28).
Observations made for the past decade by the TERRA satellite shows how Earth is changing because of warmer temperatures
(1l - I&E Stand.)
:
http://www.youtube.com/watch?v=h-VvMUseE_o
(4:57).
The Most Terrifying Video You’ll Ever See
evaluates the risks of choosing action or inaction on global warming
(1l - I&E Stand.)
:
http://www.youtube.com/watch?v=zORv8wwiadQ
(9:34).
There are many other videos that look at the issue of climate change, some by those who deny that it is happening. Look at some videos created by the so-called
climate skeptics
and write down their arguments, then write down the scientific counter-arguments. Next check out this series: Climate Crock of the Week
'(1l - I&E Stand.)
http://www.youtube.com/watch?v=_KK8F5noCrA&feature=player_embedded
(2:02), which dismantles the arguments made by those who deny global warming science one by one.
California has gone its own way by passing legislation to reduce the state’s greenhouse gas emissions to 1990 levels. A strong proponent is Governor Arnold Schwarzenegger, who has broken with the Republican party in accepting that global warming is real and that something must be done to slow its effects. The following videos address California’s cap-and-trade policy and the legislation:
Governor Schwarzenegger discusses why California Chose Cap-and-Trade in regulating carbon emissions
(1m - I&E Stand.)
:
http://www.youtube.com/watch?v=fON7t5DPQbk
(3:40).
Governor Arnold Schwarzenegger explains why the emissions standards adopted by California should be picked up by the rest of the country
(1m - I&E Stand.)
:
http://www.youtube.com/watch?v=VnZtT7Nj1rI
(3:52).
Here Governor Schwarzenegger addresses the impact of global warming on fires, attacks the Bush administration on its policies on global warming and drilling for oil off the coast of California, and reviews recent U.S. history on alternative energy research
(1m - I&E Stand.)
:
http://www.youtube.com/watch?v=osBNMvp2Cws&feature=fvw
(5:24).
California water board official answers questions about California’s legislation on global warming
(1m - I&E Stand.)
:
http://www.youtube.com/watch?v=h-ZMsNdd-34
(4:03).
Illustrating the concept of El Niño and La Niña: http://earthguide.ucsd.edu/enso/
Image courtesy of Rob Simmon and NASA, http://earthobservatory.nasa.gov/IOTD/view.php?id=44250 , and is in the public domain.