Introduction to the Month-by-Month Guide
The monthly charts
The pages devoted to each month contain a pair of charts showing the appearance of the night sky, looking south and looking north. The charts (as with all the charts in this book) are drawn for the latitude of 35°S, so observers farther north will see slightly more of the sky on the northern horizon, and slightly less on the southern, with corresponding changes if they are farther south. The horizon areas are, of course, those most likely to be affected by poor observing conditions caused by haze, mist or smoke. In addition, stars close to the horizon are always dimmed by atmospheric absorption, so sometimes the faintest stars marked on the charts may not be visible.
The three times shown for each chart require a little explanation. The charts are drawn to show the appearance at 11 p.m. for the 1st of each month. The same appearance will apply an hour earlier (10 p.m.) on the 15th, and yet another hour earlier (9 p.m.) at the end of the month (shown as the 1st of the following month). Daylight Saving Time (DST) is not used in South Africa. In New Zealand, it applies from the last Sunday of September to the first Sunday of April. In those Australian states with DST, it runs from the first Sunday in October to the first Sunday in April. The appropriate times are shown on the monthly charts. Times of specific events are shown on the 24-hour clock of Universal Time (UT), used by astronomers worldwide, and corrections for the local time zone (and DST where employed) may be found from the details inside the front cover.
The charts may be used for earlier or later times during the night. To observe two hours earlier, use the charts for the preceding month; for two hours later, the charts for the next month.
Meteors
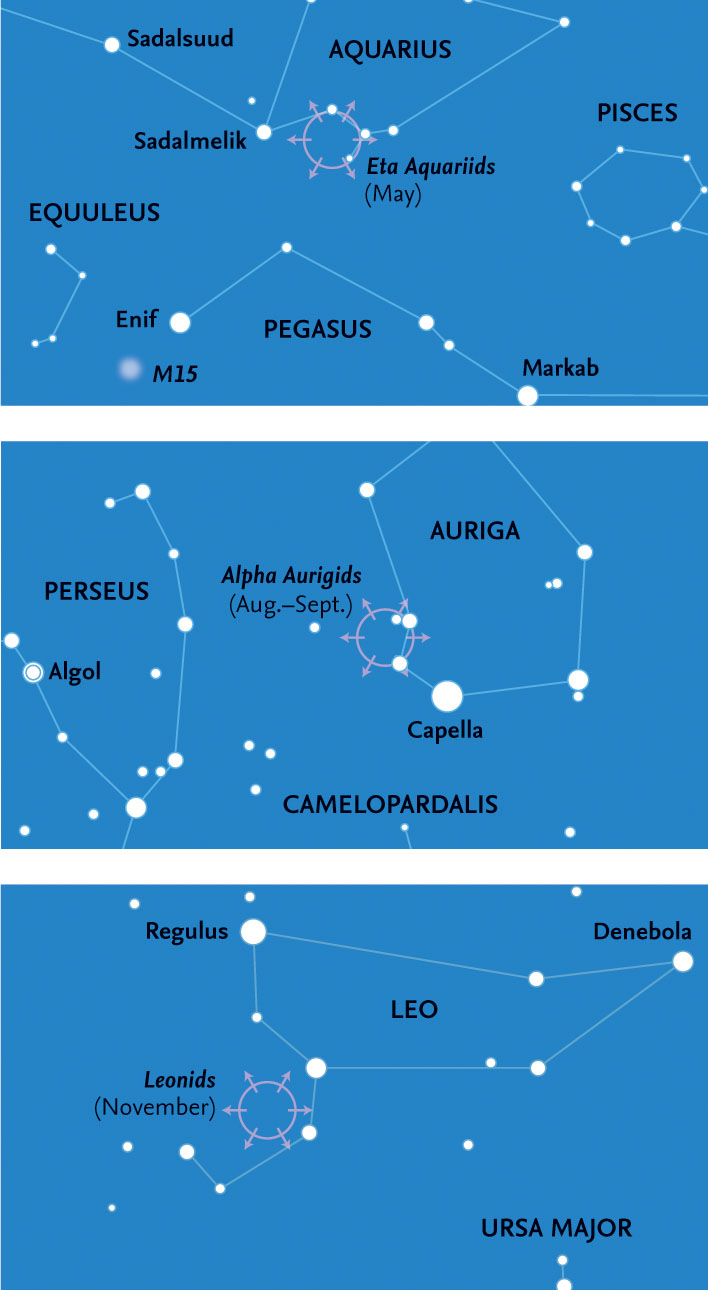
Details of specific meteor showers are given in the months when they come to maximum, regardless of whether they begin or end in other months. Note that not all the respective radiants are marked on the charts for that particular month, because the radiants may be below the horizon, or lie in constellations that are not readily visible during the month of maximum. For this reason, special charts for the Eta Aquariids (May), the Alpha Aurigids (August & September) and the Leonids (November) are given here. As just explained, however, meteors from such showers may still be seen, because the most effective region for seeing meteors is some 40–45° away from the radiant, and that area of sky may well be above the horizon. A table of the best meteor showers visible during the year is also given here. The rates given are based on the properties of the meteor streams, and are those that an experienced observer might see under ideal conditions. Generally the observed rates will be far less.
Shower |
Dates of activity 2020 |
Date of maximum 2020 |
Possible hourly rate |
Centaurids |
January 31 to February 20 |
February 8 |
5 |
Gamma Normids |
February 24 to March 24 |
March 14 |
6 |
Pi Puppids |
April 14–27 |
April 23 |
var. |
Eta Aquariids |
April 18 to May 27 |
May 5 |
55 |
Alpha Capricornids |
July 2 to August 14 |
July 29 |
5 |
Southern Delta Aquariids |
July 13 to August 24 |
July 31 |
< 20 |
Piscis Austrinids |
July 14 to August 27 |
July 27 |
5 |
Perseids |
July 16 to August 23 |
August 12 |
100 |
Alpha Aurigids |
August 28 to September 5 |
August 31 |
10 |
Southern Taurids |
September 10 to November 20 |
October 10 |
< 5 |
Orionids |
October 1 to November 6 |
October 21 |
25 |
Northern Taurids |
October 20 to December 10 |
November 13 |
< 5 |
Leonids |
November 5–29 |
November 17 |
< 15 |
Phoenicids |
November 22 to December 9 |
December 2 |
var. |
Puppid Velids |
November 30 to December 14 |
December 6 |
10 |
Geminids |
December 3–16 |
December 13 |
100+ |
Meteors that are brighter than magnitude -4 (approximately the maximum magnitude reached by Venus) are known as fireballs or bolides.
The photographs
As an aid to identification – especially as some people find it difficult to relate charts to the actual stars they see in the sky – one or more photographs of constellations visible in certain specific months are included. It should be noted, however, that because of the limitations of the photographic and printing processes, and the differences between the sensitivity of different individuals to faint starlight (especially in their ability to detect different colours), and the degree to which they have become adapted to the dark, the apparent brightness of stars in the photographs will not necessarily precisely match that seen by any one observer.
The Moon calendar
The Moon calendar is largely self-explanatory. It shows the phase of the Moon for every day of the month, with the exact times (in Universal Time) of New Moon, First Quarter, Full Moon, and Last Quarter. Because the times are calculated from the Moon’s actual orbital parameters, some of the times shown will, naturally, fall during daylight, but any difference is too small to affect the appearance of the Moon on that date. Also shown is the age of the Moon (the day in the lunation), beginning at New Moon, which may be used to determine the best time for observation of specific lunar features.
The Moon
The section on the Moon includes details of any lunar or solar eclipses that may occur during the month (visible from anywhere on Earth). Similar information is given about any important occultations. Mainly, however, this section summarizes when the Moon passes close to planets or the five prominent stars close to the ecliptic. The dates when the Moon is closest to the Earth (at perigee) and farthest from it (at apogee) are shown in the monthly calendars, and only mentioned here when they are particularly significant, such as the nearest and farthest during the year.
The planets and minor planets
Brief details are given of the location, movement and brightness of the planets from Mercury to Saturn throughout the month. None of the planets can, of course, be seen when they are close to the Sun, so such periods are generally noted. All of the planets may sometimes lie on the opposite side of the Sun to the Earth (at superior conjunction), but in the case of the inferior planets, Mercury and Venus, they may also pass between the Earth and the Sun (at inferior conjunction) and are normally invisible for a longer or shorter period of time. Those two planets are normally easiest to see around either eastern or western elongation, in the evening or morning sky, respectively. Not every elongation is favourable, so although every elongation is listed, only those where observing conditions are favourable are shown in the individual diagrams of events.
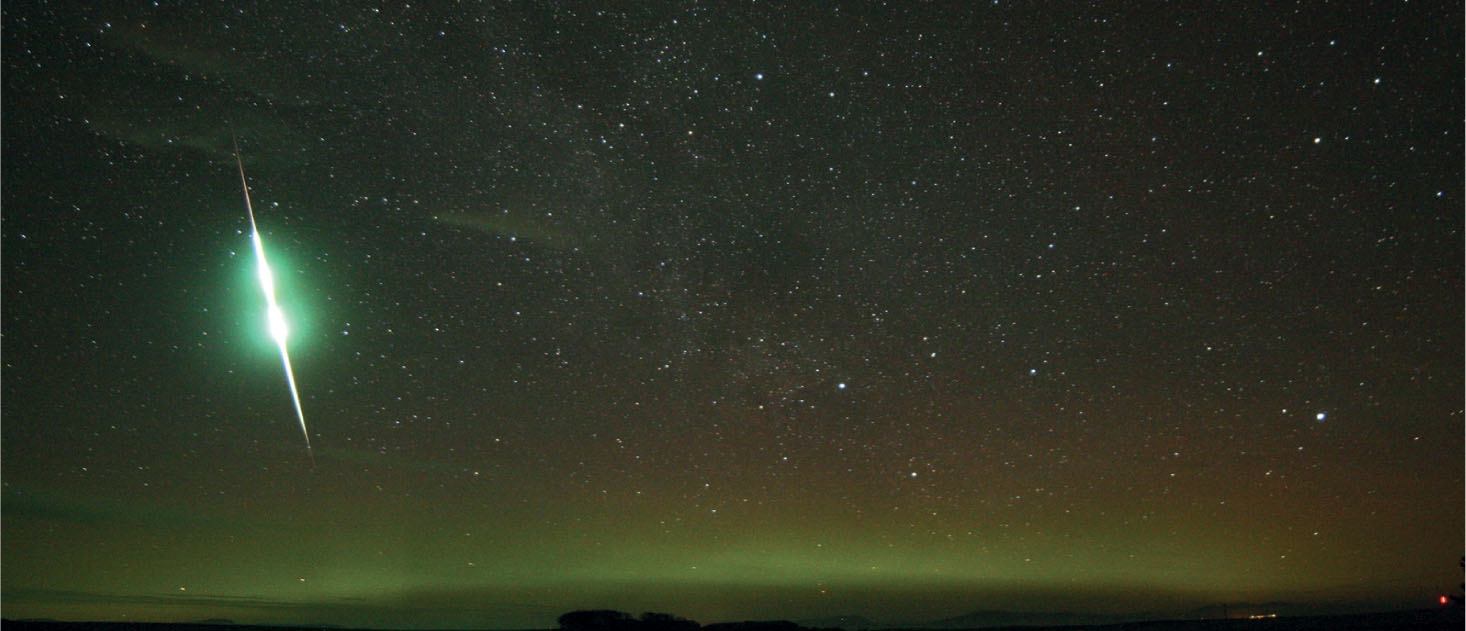
A fireball (with flares approximately as bright as the Full Moon), photographed against a weak auroral display by D. Buczynski from Tarbat Ness in Scotland on 22 January, 2017.
The dates at which the superior planets reverse their motion (from direct motion to retrograde, and retrograde to direct) and of opposition (when a planet generally reaches its maximum brightness) are given. Some planets, especially distant Saturn, may spend most or all of the year in a single constellation. Jupiter and Saturn are normally easiest to see around opposition, which occurs every year. Mars, by contrast, moves relatively rapidly against the background stars and in some years never comes to opposition. In 2020, Jupiter and Saturn are close together in the sky throughout the year, so a special chart is shown here.
Uranus is normally magnitude 5.7–5.9, and thus at the limit of naked-eye visibility under exceptionally dark skies, but bright enough to be readily visible in binoculars. Because its orbital period is so long (over 84 years), Uranus moves only slowly along the ecliptic, and often remains within a single constellation for a whole year. The chart here shows its position during 2020.
Similar considerations apply to Neptune, although it is always fainter (generally magnitude 7.8–8.0), still visible in most binoculars. It takes about 164.8 years to complete one orbit of the Sun. As with Uranus, it frequently spends a complete year in one constellation. Its chart is also here.
In any year, few minor planets ever become bright enough to be detectable in binoculars. Just one, (4) Vesta, on rare occasions brightens sufficiently for it to be visible to the naked eye. Our limit for visibility is magnitude 9.0 and details and charts are given for those objects that exceed that magnitude during the year, normally around opposition. To assist in recognition of a planet or minor planet as it moves against the background stars, the latter are shown to a fainter magnitude than the object at opposition. Minor-planet charts for 2020 are here and here.
The ecliptic charts
Although the ecliptic charts are primarily designed to show the positions and motions of the major planets, they also show the motion of the Sun during the month. The light-tinted area shows the area of the sky that is invisible during daylight, but the darker area gives an indication of which constellations are likely to be visible at some time of the night. The closer a planet is to the border between dark and light, the more difficult it will be to see in the twilight.
The monthly calendar
For each month, a calendar shows details of significant events, including when planets are close to one another in the sky, close to the Moon, or close to any one of five bright stars that are spaced along the ecliptic. The times shown are given in Universal Time (UT), always used by astronomers throughout the year, and which is identical to Greenwich Mean Time (GMT). So during the summer months, they do not show Summer Time, which will need to be taken for the observing location.
The diagrams of interesting events
Each month, a number of diagrams show the appearance of the sky when certain events take place. However, the exact positions of celestial objects and their separations greatly depend on the observer’s position on Earth. When the Moon is one of the objects involved, because it is relatively close to Earth, there may be very significant changes from one location to another. Close approaches between planets or between a planet and a star are less affected by changes of location, which may thus be ignored.
The diagrams showing the appearance of the sky are drawn at latitude 35°S and longitude 150°E (approximately that of Sydney, Australia), so will be approximately correct for much of Australia. However, for an observer farther north (say, Brisbane or Darwin), a planet or star listed as being north of the Moon will appear even farther north, whereas one south of the Moon will appear closer to it – or may even be hidden (occulted) by it. For an observer at a latitude greater than 35°S (such as in New Zealand), there will be corresponding changes in the opposite direction: For a star or planet south of the Moon the separation will increase, and for one north of the Moon the separation will decrease. For example, on 8 September 2019 during the occultation of Saturn, the apparent path of the planet was farther south for observers in Perth, Western Australia, than for observers in Darwin, Northern Territory.
Ideally, details should be calculated for each individual observer, but this is obviously impractical. In fact, positions and separations are actually calculated for a theoretical observer located at the centre of the Earth.
So the details given regarding the positions of the various bodies should be used as a guide to their location. A similar situation arises with the times that are shown. These are calculated according to certain technical criteria, which need not concern us here. However, they do not necessarily indicate the exact time when two bodies are closest together. Similarly, dates and times are given, even if they fall in daylight, when the objects are likely to be completely invisible. However, such times do give an indication that the objects concerned will be in the same general area of the sky during both the preceding, and the following nights.
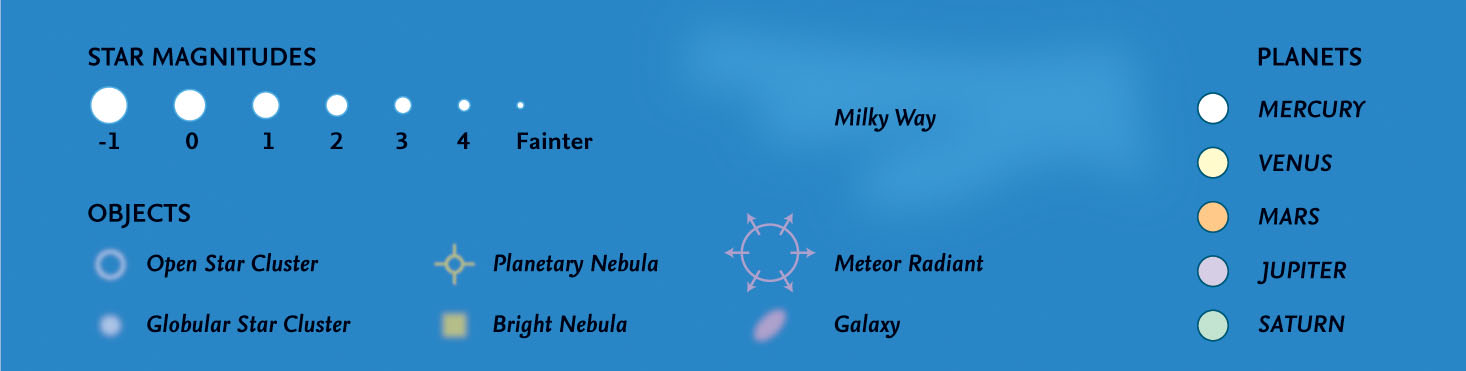
Key to the symbols used on the monthy star maps.