1 Introduction
Cyber security has become one of the most pressing concerns for critical infrastructures. As recent attacks, such as the 2016 attack on the Ukrainian power supply [1] and the 2017 world wide WannaCry [2] attack have shown, cyber security incidents can have a large scale impact on IT systems, critical infrastructure and society as a whole. At the same time as the number of incidents and the cost associated has increased, changes have taken place in the threat landscape, in that attacks are becoming more and more sophisticated and harder to detect by traditional means. So called Advance Persistent Threats (APT) are planned multimodal attacks, targeted at a specific organization or infrastructure. As advanced attacks are targeted at a specific organization, they are typically very stealthy and hard to detect. Traditional automated signature based malware detection falls short when it comes to detecting these attacks and thus, APTs have to be detected by different means, such as threat hunting strategies, in which the network is proactively scanned for anomalies and suspicious traffic. Threat intelligence is vital in this process, as information on ongoing malicious activities and sources of threats can provide important clues on where to center threat hunting and on the legitimacy of the traffic observed.
One very efficient way gaining intelligence on malicious activity is the creation of honeypots. Honeypots are systems which are deliberately exposed on the Internet, in order to attract cyber-attacks, which are monitored and studied. Apart from serving as educational tools and providing an insight into the current cyber-attack landscape, honeypots can provide important input to cyber security monitoring toolchains, such as signatures for intrusion detection systems (IDS), malicious source IPs for blacklists and other means by which attacks may be detected.
However, whilst it may be relatively trivial to create a honeypot simulating a basic IT system, such as a web server, it is difficult to design realistic honeypots simulating industrial control systems and critical infrastructures. In what remains of this paper we describe the design and development of our own honeypot which simulates a water treatment plant, the observations made during the two year exposure of the system and the role the system plays in our daily business of providing managed cyber security services through our industrial Security Operations Center (iSOC).
2 Building a Realistic Honeypot
ICS honeypots tend to be over-simplistic when it comes to industrial processes. The reviewed cases didn’t match any realistic process and, what’s more, consisted only in software simulations running in a computer which had some common ICS protocols ports open.
Physical equipment was lacking or scarce. A typical configuration was that of a single PLC (Programmable Logic Controller) communicating with a computer.
Typically, ICS honeypots are too simplistic to allow any complex interaction with a potential attacker, thus preventing any sophisticated actions from taking place.
A tendency to over-promote the honeypot on the Internet as a means to enhance its visibility and attract attackers, complemented with just too evident vulnerabilities put in place ‘to let the bad guys in’.
Summing Up: Attackers with a sound knowledge of industrial processes and ICS technology are not likely to be deceived by the reviewed honeypots, which look far too much IT-inspired. The most probable ‘victims’ of these honeypots are casual or conventional attackers, biasing the data on malicious activity obtained in this way.
The simulated infrastructure must be a realistic one, comparable to those a modern society relies upon.
The honeypot must be realistic enough, so as not to raise suspicion, not only in casual or IT focused attackers, but also in experts with experience in ICS and industrial processes.
The honeypot must allow for a degree of interaction high enough for complex attacks to take place. More precisely: in order to keep an attacker engaged for as long as possible, the system must show some kind of response to malicious actions. In fact, this action/reaction behavior should match reality as close as possible. For example, if an attacker expects, as a result of his actions, a pump to stop, flow through the corresponding pipe should drop to zero smoothly, just as it would in a real world installation.
Contrary to IT honeypots, cyber security monitoring must be almost invisible. The reason for this is, that currently most SCADA systems lack complex monitoring infrastructures. Finding complex security monitoring in operation may raise suspicion.
3 The iHoney ICS Honeypot
3.1 Design Process
- 1.
Fake infrastructure design. For this project, a water treatment plant was selected. The design involved treatment process definition and associated calculations, equipment selection (pumps, blowers, instrumentation…). Summing up, the design process was the same as it would have been in the development of an actual plant.
- 2.
Automation and ICS system design. In this step controllers, communication buses and protocols and the whole ICS architecture where designed.
- 3.
Graphic Interface Development for the SCADA HMI (Human-Machine Interface). This task was carried out in a realistic manner, using the blueprints already designed in the previous phase. In addition to the plant layout, other common screens were also developed, such as alarms, historian, etc., in order to provide a very realistic system.
- 4.
Physical processes modeling by means of logical and mathematical expressions that involve the considered state variables. In order to provide an action/reaction model, in which system manipulation results in realistic state changes in the system, a full system simulator was developed, which interacts with the PLC and SCADA system, just as the physical components in areal water treatment plant would behave.
- 5.
Cyber security monitoring subsystem design. In this step, the hidden monitoring architecture was developed, in terms of soft-ware, communication net-works and connection to the Internet. A set of hardware and soft-ware components were deployed for monitoring purposes. Monitoring activities were designed from the beginning to be integrated into the companies live iSOC in the same way the industrial infrastructure of real clients are monitored.
- 6.
ICS system implementation. In this final step, the ICS hardware was deployed and programmed as an actual system would have been. This task was accomplished with help from a specialized contractor.
3.2 Honeypot Architecture
- The ICS system, composed of an SCADA server/HMI, a control network of PLC that regulates the several processes and the associated industrial communication protocols. Figure 1 shows an example screen of the actual SCADA HMI.
 Fig. 1.
SCADA HMI
The simulation system, that evaluates the process status variables in real-time and interacts with the ICS inputs (legitimate or not) generating the appropriate outputs (as the actual system would). This system provides ‘plant operators’ with an interface that enables them to interact with the physical system: physical buttons and switches to operate manually, drives and panels, local interfaces to manually change set points, etc.
The cyber security monitoring infra-structure, which obtains information about the behavior of honeypot attackers. This is composed of two elements: a NIDS (Network Intrusion Detection System) which monitors all the network traffic looking for threats, and a HIDS (Host-based Intrusion Detection System) installed on the exposed SCADA server/HMI, which monitors the activities of the system looking for suspicious activity.

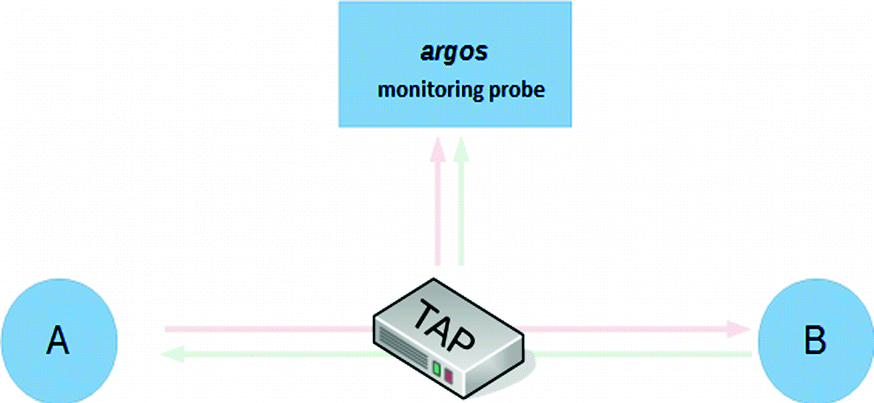
Connection of the TAP with argos

TAPs deployed in the control system
When the replicated traffic arrives at the argos monitoring probe, this has different agents that analyze its different characteristics in real time. These include the SNORT NIDS and the Modbus [5] and S7Comm [6] industrial protocol dissecting agents (dissectors). SNORT is based on signatures that identify different patterns within a network packet, so that when a packet or set of network packets with certain characteristics matches the patterns defined in an implemented signature, it allows to log, alert or discard that packet. These patterns are defined from rules, which are the ones that define the situations to be detected. SNORT has a generic package of generic rules that detect different situations and attacks. In addition, a series of specific signatures were added for the detection of different actions against the devices present in the system, including actions carried out using typical IT protocols and actions carried out using the Modbus and S7Comm industrial protocols. On the other hand, the function of the dissectors is to dissect all the Modbus and S7Comm packets according to the specification of each protocol, in order to analyze in detail all the actions carried out by them.
HIDS: The function of the HIDS installed in the SCADA server/HMI is to alert of different actions that are carried out against the own server. Access to certain folders, user creation or files deletion could be an example. To do this, HIDS consults the Windows Event Viewer (where this information is located) and sends this information to argos.
Software that the attacker could not recognize is used, in order for the HIDS to go unnoticed. To this end, an ad-hoc HIDS was created for the occasion. The HIDS hides behind the appearance of a legitimate program whose function is to check the status of communications with PLCs.
3.3 Challenges
Some compromises were necessary to ensure, on the one hand, a realistic enough fake system and, on the other hand, an adequate level of complexity. So some simplification has been made in the mathematical relations between physical variables. Of course, there is a limit to this imposed by the need to keep the system simple but realistic.
Choosing an infrastructure prone to be cyber-attacked. This is kind of a goldilocks problem: attractive enough but not so notorious that it raises suspicion. For example, choosing a big airport may not be such a good idea as it seems: it is difficult to simulate in a realistic manner; it is not likely that serious attackers take a singular infrastructure overexposed on the internet for the real thing; the possible impact of a casual attack on such a notorious thing may dissuade most individuals.
Implementing the honeypot so as to render the simulation module invisible. One of the key factors to achieve this is the use of 24 V DC signals in the communication between the ICS and the simulating module.
Simulating the response of physically driven relays built in some actual equipment (for example, overheat emergency switches in submersible pumps) and safety interlocks.
Developing a high quality set of layout blueprints as a template for the SCADA HMI interfaces.
Integrating the simulation module and the ICS one accounting for the tight requirements of ICS systems regarding real time processing, stability and network latency.
Customizing the monitoring system to conceal the generation and exfiltration of information on attacks (logs, etc.).
Scheduled maintenance stops.
Scheduled operations (on a daily, weekly and monthly basis).
Scheduled equipment failure simulation.
This plan was put in place to keep the infrastructure ‘alive’, as any potential attacker would expect from an actual plant.
4 Intelligence Obtained
4.1 Lessons Learned During Exposure
The iHoney system has been exposed to the Internet for over two years providing valuable lessons to our security team and intelligence data to be used by our analysts and monitoring toolchain.
The system was attacked almost instantly, and, when connected, is being attacked on a daily basis. The actual volume of attacks has been much higher than expected. See below for detailed statistics.
Most of the registered attacks are automated and are directed towards the IT components of the SCADA system.
When properly configured and updated, it is not easy for attackers to get into the system. So, the importance of a good security management can hardly be overstated. In fact, this is prompting attackers to explore other ways in, such as social engineering (see next paragraph).
A certain number of attacks were more advanced and directed against the operators behind the machines. Since human operators are the weakest link in the cyber security chain, this is a factor that cyber security analysts must account for.
4.2 Data Analysis
In order to analyze and visualize incidents a data analytics frame work has been defined.
Network traffic: It is the main information source for the different monitoring agents and is collected through the TAP devices of the system.
Snort Alerts: They are sent to the correlator and stored in the system to allow the technician to access that information.
Logs from S7COMM & Modbus dissectors: They allow to have a detailed register of all S7COMM & Modbus network packets, including all the fields of every petition and response of the protocol.
Logs of the SCADA server: It gathers information from the Windows Event Viewer of the SCADA server. The logs give data in real time about the state of the equipment.
Logs of the Modbus slave simulator: The Modbus slave simulator has the ability to keep a record of all Modbus petitions addressed to it.
Alerts generated by the correlator: The information generated by the IDS, the industrial protocol dissecting agents and the HIDS, is correlated to detect more complex situations that could not be identified using another way. That allows to discern whether the actions are due to a legitimate use or an attack.
- Other information sources:
Industrial devices: The specifications of an industrial device, the way it is programmed, operated and maintained.
Industrial protocols: The structure of communication of industrial protocols. This allows to understand the communications between the different devices located in an infrastructure.
Industrial applications: Anomaly detection criteria can be established understanding how this kind of applications work.

Structure of the analysis process

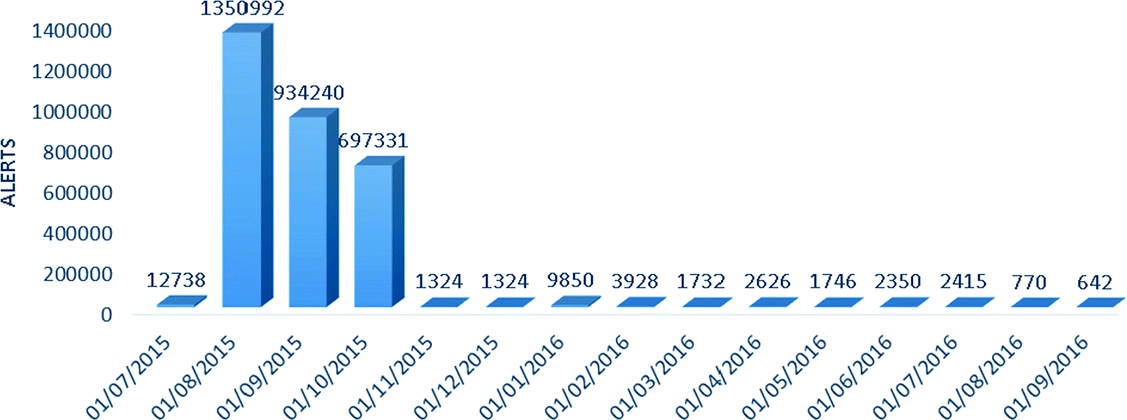
Alerts histogram by month (July 2015–September 2016)
The large number of alerts in the first months of study are due the Remote Desktop Protocol we used, which generated many replicated alerts due to the IDS signatures functioning. In order to reduce the volume of replicated data, the RDP service was substituted by a Virtual Network Computing service. We have chosen to maintain the high number of replicated alerts in this analysis, in order to highlight the difficulty of security monitoring in such an environment and because it serves as an example of unexpected lessons that can be learned in honeypot deployment.

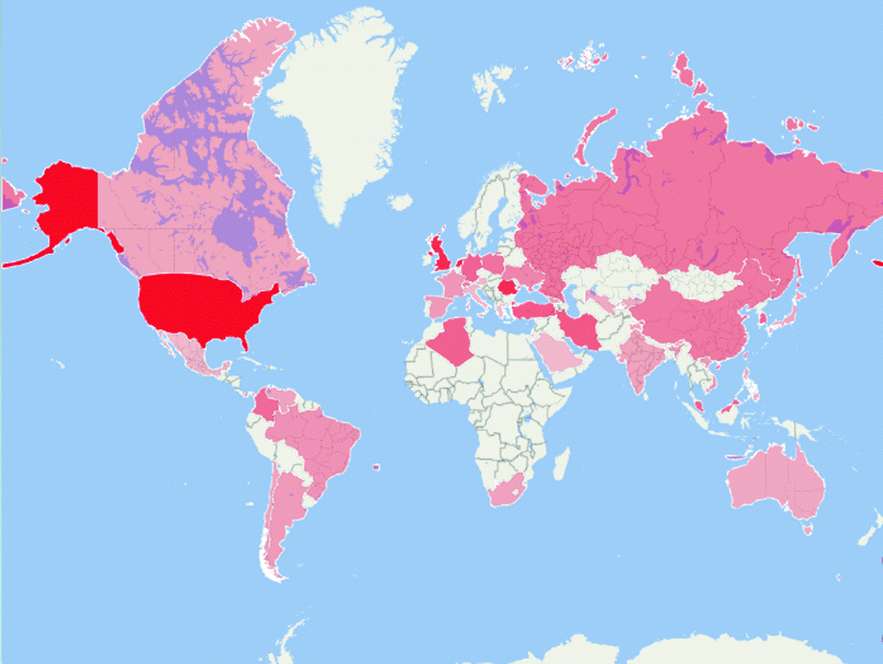
Heat map of alerts

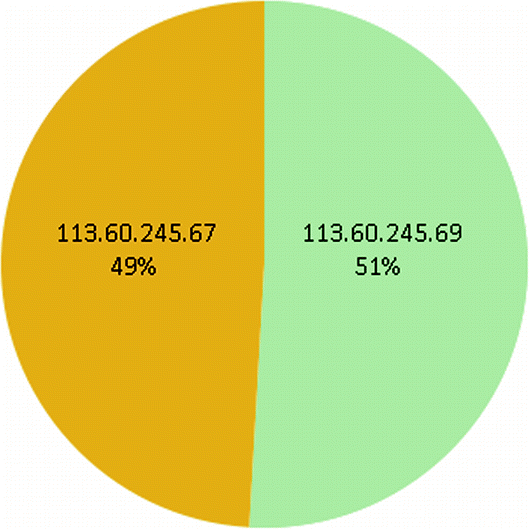
Sectorial graph of alerts by IP of the group 113.60.245.67 & 113.60.245.69
One of the most interesting discoveries was evidence pointing to the existence of coordinated attacks against the iHoney honeypots. For example, we compared the octets of all the attackers IPs, looking for coincidences in the first two or three of them and considering it as an indicator of a potentially common origin range.
4.3 Input into Daily Monitoring Operation
The iHoney honeypot is continuously providing intelligence and insights for our daily business as a managed cyber security service provider.
IDS signatures. Signatures of observed attacks are continuously being integrated into the IDS systems that for part of our ICS monitoring toolchain.
Event/Alert Correlation Rules. Our monitoring toolchain includes advanced event correlation, which helps reducing the number of events to be dealt with by a security analyst by identifying related alerts. The observations made by analyzing iHoney continuously leads to a better understanding of correlation of certain alerts, which are expressed as correlation rules and fed to our correlation engine.
Anomaly detection module development. Attacks observed have led to the development of new modules for our anomaly detection capabilities. One simple example of such module is the development of a capability to discern between manual and automated actions from a potential attacker in SCADA HMIs. To achieve this, the detection of mouse clicks and movements that hardly could be imitated by an automated software has been developed. This module has been proven in the industrial environment with positive detection results.
General Awareness of the cyber threat landscape. Apart from the above inputs to our toolchain, the honeypot provides important information on current developments in cyber security attacks, which leads to improved training and wariness of our cyber security analysts.
5 Conclusion
Honeypots are an efficient way of obtaining cyber security threat intelligence. However, designing a realistic honeypot simulating industrial control systems is not a trivial task.
In this paper we have described our approach to designing such an industrial control system honeypots, which is currently used to feed intelligence to real world ICS cyber security monitoring services. Furthermore, the results of more than two years of exposure of the system have been reproduced.