1 Introduction
Climate change-related extreme events, including coastal, fluvial and pluvial flooding, flash floods caused by heavy precipitation, rockslides and landslides, temperature extremes, thunderstorms and tornados, winter storms, and rising sea levels [1], are severe threats to urban population centers and their critical infrastructure systems [2]. The increasingly complex dependencies of these infrastructure components combined with the ongoing trend towards further urbanization – in 2050 over 80% of Europeans are projected to live in cities [3] – make it necessary for local authorities to develop proactive crisis management strategies against climate change-related extreme weather events. One of the prerequisites for designing effective management and adaptation strategies is a comprehensive understanding of the specific risks and vulnerabilities in the local or regional context. However, not many standardized methods and toolsets exist today that enable municipal decision makers to consider, analyze, and evaluate risks and vulnerabilities under specific extreme weather events and climate change-related scenarios. A standardized approach to vulnerability assessment would enable comparison and benchmarking between cities with similar make-ups, ensure interoperability between methods and tools, enable the establishment of data standards, and ease monitoring and reassessment.
This paper presents “Impact and Vulnerability Analysis of Vital Infrastructures and Built-up Areas – IVAVIA”, a standardized process for the assessment of climate change-related risks and vulnerabilities in cities and urban environments, based on the well-established approach by the German Federal Ministry for Economic Cooperation and Development [4]. Seven interconnected modules guide practitioners and end-users through the risk-based vulnerability assessment process, beginning with a systematic selection of hazards and drivers in their local context, and ending with a standardized presentation of the resulting outcomes to decision makers and stakeholders [5].
The Intergovernmental Panel on Climate Change (IPCC) provides a scientific reference view on climate change, including a conceptual framing of climate change adaptation, in their periodic assessment reports. Since their most recent fifth assessment report (AR5), published in 2014 [7], the IPCC shifted their assessment paradigm from a vulnerability-oriented to a risk-based scheme, with the intention to facilitate synergetic collaboration between the disaster risk management and the climate change adaptation communities. They left it to the scientific communities to operationalize and apply risk-based vulnerability assessment. To this end, IVAVIA has been developed as part of the EU project “Climate Resilient Cities and Infrastructures – RESIN” [6], one of the first large-scale research projects based on the conceptual approaches of the IPCC AR5. One aim of the RESIN project in general and this paper in particular is to foster the mutual exchange and understanding of concepts between the disaster risk management, critical infrastructure protection and the climate change adaptation communities.
The RESIN project develops practical and applicable methods and tools to support municipalities in designing and implementing adaptation and mitigation strategies for their local contexts and in a participatory way. Other interdisciplinary, practice-based research projects investigate climate change-oriented resilience in European cities too: The recently concluded project “Reconciling Adaptation, Mitigation and Sustainable Development for Cities – RAMSES” [8] developed methods and tools to quantify the impacts of climate change and the costs and benefits of adaptation measures to cities. The ongoing project “Smart Mature Resilience – SMR” [9] aims at developing a resilience management guideline to support city decision-makers in developing and implementing resilience measures.
IVAVIA has been developed by means of co-creation with local domain experts from four cities: Bilbao (Spain), Greater Manchester (United Kingdom), Paris (France), and Bratislava (Slovakia). This process allows close feedback from municipal stakeholders during IVAVIA’s development. Instead of the usual waterfall-model process of eliciting requirements for a new tool or method, creating a specification, realizing and implementing the tool/method and evaluating it, co-creation comprises several cycles of lean versions of this process as well as iterative development and test of the tools/methods in close cooperation with the end-users. In total, co-creation takes longer, but partial results are available earlier and the final results can be more mature.
This paper continues with introducing the background of risk-based vulnerability analysis (Sect. 2), and then goes on to describe the IVAVIA process (Sect. 3). It presents insights from two applications of the methodology in the Cities of Greater Manchester and Bilbao (Sect. 4), and concludes with a short summary of the lessons learned and an outlook on further research steps (Sect. 5).
2 Background and State of the Art
2.1 Background and Basic Definitions for IVAVIA
The overall aim of an IVAVIA risk-based vulnerability assessment is to facilitate the understanding of the effects of climate change in a local context, to identify geographical hotspots of vulnerability and risk, and to assess what impact on people, economy, built-up area, and critical infrastructure under study can be expected now and for the future due to the changing climate. This allows identifying entry points for adaptation measures and areas calling for priority actions. Also, the risk-based vulnerability assessment is able to provide qualitative and quantitative assessment results for substantiating the findings.
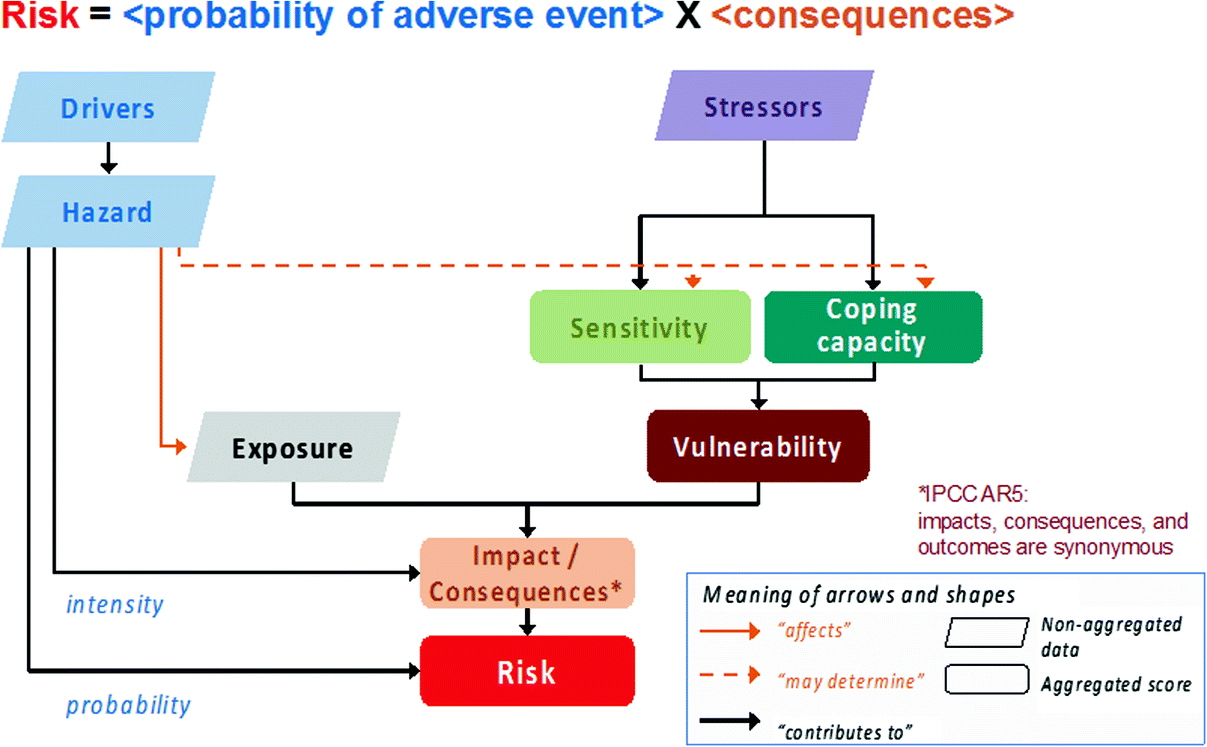
Here, a hazard is defined as “…the potential occurrence of a natural or human-induced physical event or trend, or physical impact that may cause loss of life, injury, or other health impacts, as well as damage and loss to property, infrastructure, livelihoods, service provision, and environmental resources” [10]. A climate-related hazard is a special case that is (at least partially) caused by climatic drivers. Examples for climate-related hazards include flooding, heatwave, and drought, while examples for related climatic drivers include sea-level rise, increased temperatures, and lack of precipitation.
Exposure refers to the objects or systems that might potentially be exposed: The presence of people, livelihoods, species or ecosystems, environmental services and resources, infrastructure, or economic, social, or cultural assets in specific places that could be adversely affected. In contrast, effective exposure describes the portion of the exposed assets that is actually affected by a specific hazard scenario, e.g. residential buildings in flood prone areas for a 100 year flood.
Non-climatic trends and events, which are called stressors, can have an important effect on an exposed system. Examples are population growth or change of land-use; a larger percentage of sealed surface will in general increase the susceptibility to flooding events and thus the vulnerability of all exposed objects.
Different objects are more or less sensitive to a hazard. This is captured by the concept of sensitivity, defined as the degree to which an exposed object, species or system could be affected by the considered hazard. As such, sensitivity towards a hazard can be perceived as a property of an exposed object in regard to a specific hazard. Examples for sensitivity include the degrees of surface sealing, age and density of a population, household-income, or elevation and density of buildings.
Coping capacity is defined as “the ability of people, institutions, organizations, and systems, using available skills, values, beliefs, resources, and opportunities, to address, manage, and overcome adverse conditions in the short to medium term” [10]. Examples include the draining capacity of sewer systems, a dike’s height, education and awareness of the population, and availability of early warning systems.
Vulnerability is derived from the interplay of stressors, sensitivity, and coping capacity. It contributes directly to the impact or consequences that a hazard causes to the exposed objects.
Risk is classically computed by multiplying the probability of an adverse event with the magnitude of the expected consequences [10]. A risk assessment considers the characteristics and intensity of the considered hazard scenario, as well as the set of objects exposed to it. The probability of a hazard affecting the set of objects may be estimated from extrapolating historical data or simulation results concerning the frequency of the hazard and the development of the objects.
2.2 State of the Art
Several methods and tools for risk analysis exist. The Words into Action Guidelines for National Disaster Risk Assessment from the United Nations Office for Disaster Risk Reduction gives a comprehensive overview for the most frequently employed approaches [11].
The German Federal Ministry for Economic Cooperation and Development, together with Adelphi and EURAC, developed the Vulnerability Sourcebook [4], based on the Fourth Assessment Report of the IPCC, and the associated Risk Supplement to the Vulnerability Sourcebook [12], based on the changes promoted in the Fifth Assessment Report of the IPCC to provide guidance for indicator-based vulnerability and risk assessments. In this method, the usually massive amount of information and data about hazards, exposure, vulnerability, and other risk components is simplified by aggregating it to index scores (i.e. a number out of a full score), which are subsequently combined (e.g. using weighted arithmetic/geometric mean) to present risk levels with a single score.
In contrast, the German Federal Office of Civil Protection and Disaster Assistance (BBK) employs a multi-criteria impact and likelihood analysis based on risk matrices, an instrument that is also promoted as an ISO standard [13]. In this approach, impacts and probabilities of hazard scenarios are estimated (e.g. based on historical data or simulation models) and classified by defining threshold values for the different impact/probability classes, i.e. in which value range do potential impacts/probabilities have to lie to be classified in a certain way. Typically, risk matrices have four to seven impact classes and a similar number of probability classes. For any combination of impact and probability, a risk level or class (BBK: very high, high, intermediate, low) is determined. Both determining the thresholds and assigning risk levels requires political decisions that have to be taken with extreme care. It requires deciding when a certain number of fatalities is regarded as ‘moderate’ or ‘significant’ and which risk level requires which type of reaction, or, more simply put, which risk level is acceptable and which is not. This may constitute one of the most problematic steps of the risk analysis process.
If no (or not enough) information or means for carrying out an indicator-based multi-criteria analysis is available, expert elicitation approaches might be employed. Here, individuals with a good understanding of the various components of disaster risk components of the area under study conduct a qualitative analysis using their expert judgements. The Risk Systemicity Questionnaire developed during the Smart Mature Resilience project [14] and the UNISDR Disaster Resilience Scorecard for Cities [15] are recently developed expert elicitation approaches. Both employ spreadsheet- and/or web-based questionnaires to elicit knowledge from experts and combine the gathered information into comprehensive overviews, e.g. by assigning scores to predefined answers and visualizing them using spider charts.
The IVAVIA risk-based vulnerability assessment methodology is based on the indicator-based method from the original Vulnerability Sourcebook and combines this approach with the multi-criteria impact and likelihood analysis by the BBK.
3 A Process for Impact and Vulnerability Analysis of Vital Infrastructures and Built-Up Areas
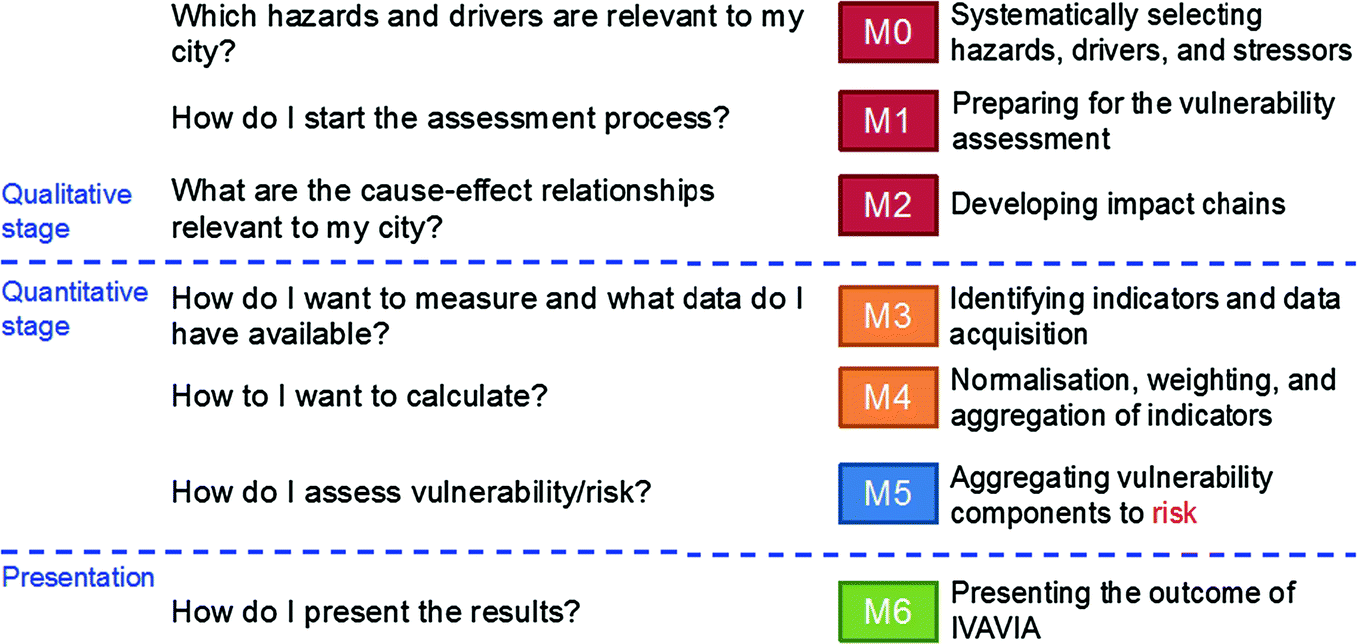
Steps of the risk-based vulnerability assessment process IVAVIA
Each step of the module descriptions contains information about input needed and output to be created. For a full qualitative and quantitative assessment, an end user should execute the modules in the given sequence, as each module generates input for the following ones. For a qualitative assessment only, the process has only to be run up to Module 2. In general, the amount of resources necessary for the assessment process varies widely, depending on the size of the studied area and the requested depth and scope of the evaluation.
The modules and steps are described in detail in the IVAVIA Guideline document [16] addressed to local decision makers, with the more technical details of the process and reference information being covered by the IVAVIA Guideline Appendix.
3.1 Qualitative Stage
Module M0, “Systematically selecting hazards, drivers, and stressors”, starts off the process with a systematic analysis and selection of hazards, drivers, and stressors relevant to the region or urban area under examination. This serves as a base for the detailed planning of the assessment and ensures that the limited resources and budgets are spent on the most pressing current and future hazards, and that no threats or possible dependencies between different hazards are overlooked. In addition, a thorough documentation of the rationale for selecting hazards, drivers, and stressors ensures that future (re-)assessments can follow the same methodology, thus enabling result comparison. Module M0 consists of the following steps: (0.1) Identify the hazards considered potentially relevant; (0.2) Gather information on the identified hazards; (0.3) Identify generally relevant drivers and stressors; and (0.4) Kick-off meeting and management decisions.
As part of Module M1, “Preparing for the vulnerability assessment”, a common taxonomy is defined and communicated, and the overall objectives, scopes, participants and their roles and responsibilities, as well as the target audiences have to be defined in agreement and, ideally, in cooperation with the relevant stakeholders. M1 also serves to identify and gather relevant information to form a detailed implementation plan. The information needed for this step includes a list of relevant stakeholders including both institutions and individuals, measures and strategies that are already in place or to be considered (e.g. sector strategies, community or national development plans, and on-going adaptation measures), climatic, socio-economic, and sectoral information to be included, and a list of climate and city development scenarios to be examined. Module M1 consists of the following steps: (1.1) Understand the context of the risk-based vulnerability assessment; (1.2) Identify the objectives and expected outcomes; (1.3) Determine the scope of the assessment; (1.4) Develop the scenario settings; and (1.5) Prepare a work plan.
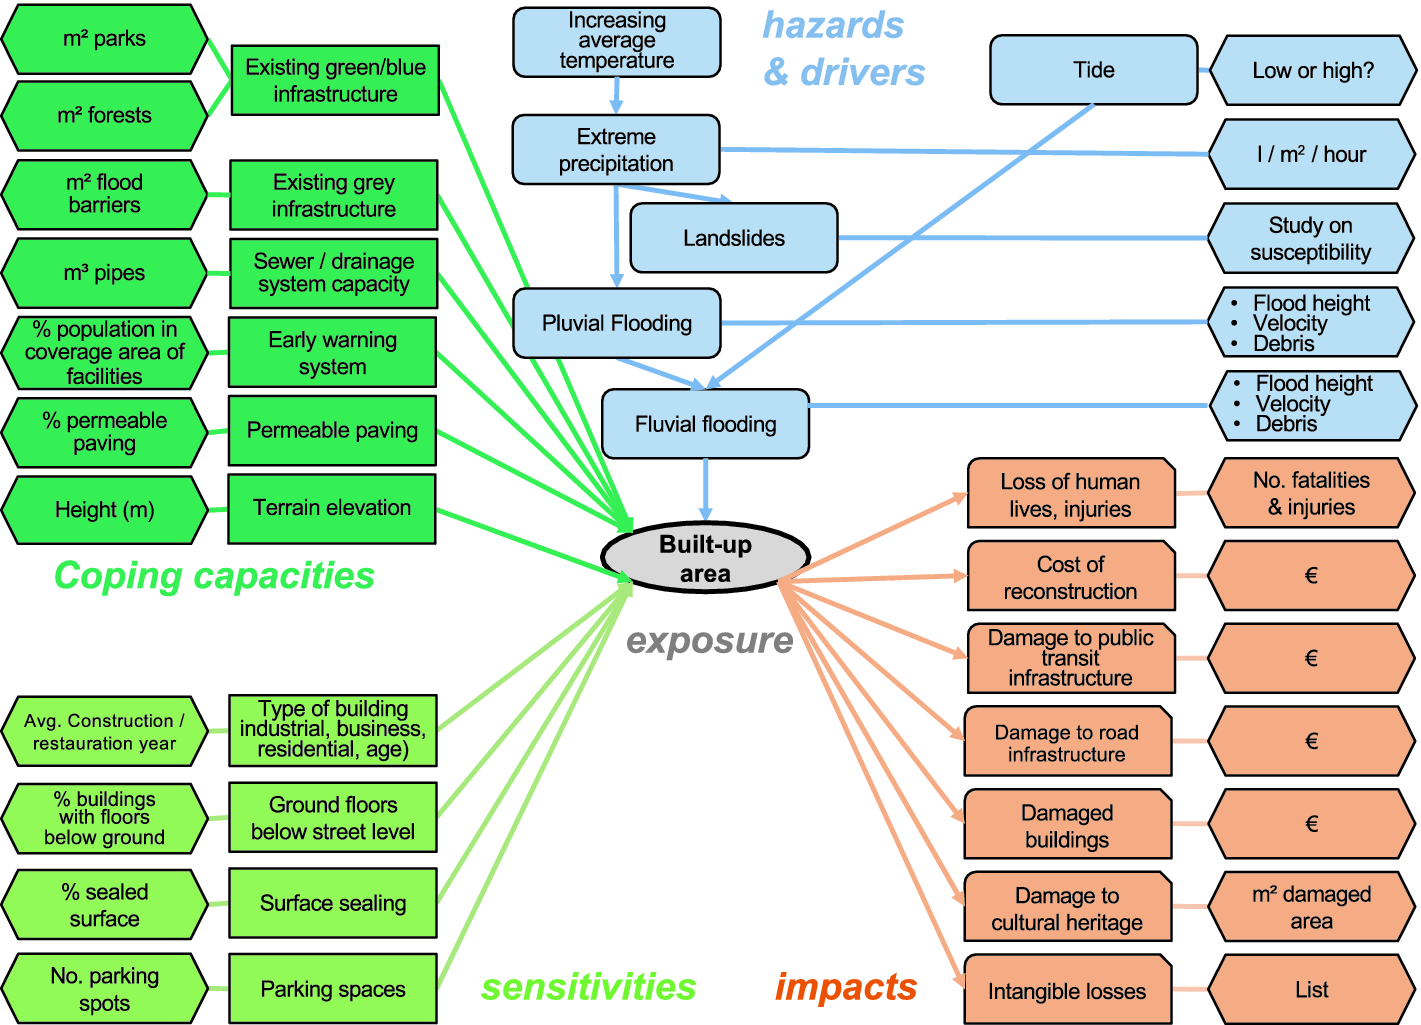
Impact chain sample for the hazard-exposure combination “flooding on built-up area” in the city of Bilbao. Hazards & drivers in blue, exposed object in grey, coping capacity in green-blue, sensitivity in green, and impacts in orange. Hexagons: indicator dimensions
(Source: [5]) (Color figure online)
3.2 Quantitative Stage
Module M3, “Identifying indicators and data acquisition”, describes the identification and definition of measurable indicators for identified elements of the generated impact chains. The indicator identification and data collection steps are highly dependent on each other. The availability of data is of critical importance for the quantitative stage: Without a feasible way for data acquisition, the best indicator would be inoperable. To this end, it is important to include domain experts with extensive knowledge about data availability. To ease the indicator selection process, established directories of standard indicators should be employed, for example, the annex of the Vulnerability Sourcebook ([4], pp. 14–17) or the annex of the Covenant of Mayors for Climate and Energy Reporting Guidelines ([18], pp. 61–67). Module M3 consists of six operational steps: (3.1) Select indicators; (3.2) Check if the selected indicators are suitable; (3.3) Gather data; (3.4) Check data quality; (3.5) Manage data; and (3.6) Calculate indicator values.
Communicating a multitude of complex, multi-dimensional indicators in a comprehensive way is extremely complicated. Therefore, the calculated indicator values should be normalized (e.g. via min-max normalization [19]), weighted, and aggregated (e.g. using weighted arithmetic mean [19]) to composite scores for different risk components. These issues are addressed in the course of Module M4, “Normalization, weighting, and aggregation of indicators”. The calculated indicator values often employ different measurement units and scales, and thus cannot be aggregated into composite scores without being normalized. The selected indicators may not necessarily have equal influence on their corresponding risk component, which should be reflected by assigning weights to them when combining them into composite scores. Module M4 consists of four steps: (4.1) Determine the scale of measurement; (4.2) Normalize coping capacity and sensitivity indicator values; (4.3) Weight coping capacity and sensitivity indicators; and (4.4) Aggregate coping capacity and sensitivity indicators.
Module M5, “Aggregating vulnerability components to risk”, covers the actual risk assessment, which is based on the well-established risk analysis process by the German Federal Office of Civil Protection and Disaster Assistance [13], assuring organizational, legal, and political interoperability. In this approach, impacts and probabilities are classified using discrete, ordinal classes (e.g. “insignificant”, “minor”, or “disastrous” for impacts and “very unlikely”, “likely”, and “very likely” for probabilities). The resulting impacts and probability pairs, i.e. the risk scores, are then assigned to discrete, ordinal risk classes using a risk matrix. This matrix has one axis for the impact classes and one axis for the probability classes, and thus defines risk classes for every combination of the two. Module M5 consists of six steps: (5.1) Calculate vulnerability scores; (5.2) Define classification scheme; (5.3) Estimate hazard intensity and probability; (5.4) Determine coping capacity; (5.5) Estimate impacts and consequences; and (5.6) Validate results.
3.3 Presentation
The last Module M6, “Presenting the outcome of IVAVIA”, concerns the systematic presentation of outcomes to all relevant stakeholders and funding bodies, including external risk analysis experts to assure external result validation. Best practices are shared, and supporting material, i.e. report and presentation templates are being provided, as well as graphs exported by the developed software tools. M6 consists of three steps: (6.1) Plan your report; (6.2) Describe the undertaken assessment process; and (6.3) Illustrate the findings. With the successful conclusion of Module M6 the risk-based vulnerability analysis process is complete. Building on this base the municipal stakeholders can now go on to systematically plan, and then finally implement, adaptation measures.
3.4 Climate Change-Related Risk to Critical Infrastructures
(Critical) Infrastructure (CI) can be addressed with IVAVIA in the following ways: As practiced in several RESIN city case studies, CI can be the exposed object (exposure), that is, it is the immediate subject of the analysis. IVAVIA then results in an overall risk and vulnerability of the investigated CI with regard to consequences of climate change. This result can also be used in more comprehensive risk analyses in the areas of Critical Infrastructure Protection and Resilience (CIP/CIR).
Impacts of consequences of climate change on CI may also be addressed in the investigation of impacts as element of impact chains. Here, primary impacts and secondary impacts can be analyzed by methods developed in the CIPRNet project [20]. Secondary impacts may include cascading effects on other, dependent CI and socio-economic impacts as identified in the European Directive on CIP [21].
Semi-quantitative methods for analyzing climate change-related risk, which are not part of IVAVIA, may yield additional information on climate change-related risk to CI. For instance, an overlay of a flood risk map and a map of a transport network (road, railway, public transport) may identify risk hot spots of climate change-related risk to spatially constrained parts of the transport network.
In the case studies to be presented in the next section, thirteen assessments using IVAVIA have been performed, covering the hazards fluvial and pluvial flooding, heat waves, and drought. Three assessments investigated resulting risk for health and the quality of life of citizens, three other assessments investigated resulting risk for green infrastructure and built infrastructure, and two assessments investigated resulting risk for high rise buildings and their users. A total of five assessments investigated resulting risk for critical infrastructure. In these cases, the exposed CI included city traffic infrastructure, a major arterial road in one city, the Paris metro, blackout caused by fluvial flooding on high rise buildings in general and more specifically on sensitive buildings (governmental buildings, embassies, jails, banks, museums etc.).
4 Analyzing Risks and Vulnerabilities Regarding Climate Change for Two Cities
4.1 Risk Assessment for the City of Greater Manchester, UK
The assessment for the City of Greater Manchester had the goal to develop impact chains for two different infrastructures and thus comprised only the qualitative part of the IVAVIA process. Local stakeholders, who worked on climate resilience and relevant critical infrastructure as well as RESIN research partners developed these impact chains during two workshops in Greater Manchester.
The first impact chain focused on the effects of an extended period of hot dry weather on green infrastructure, while the second impact chain focused on the effects of fluvial flooding on a major arterial road.
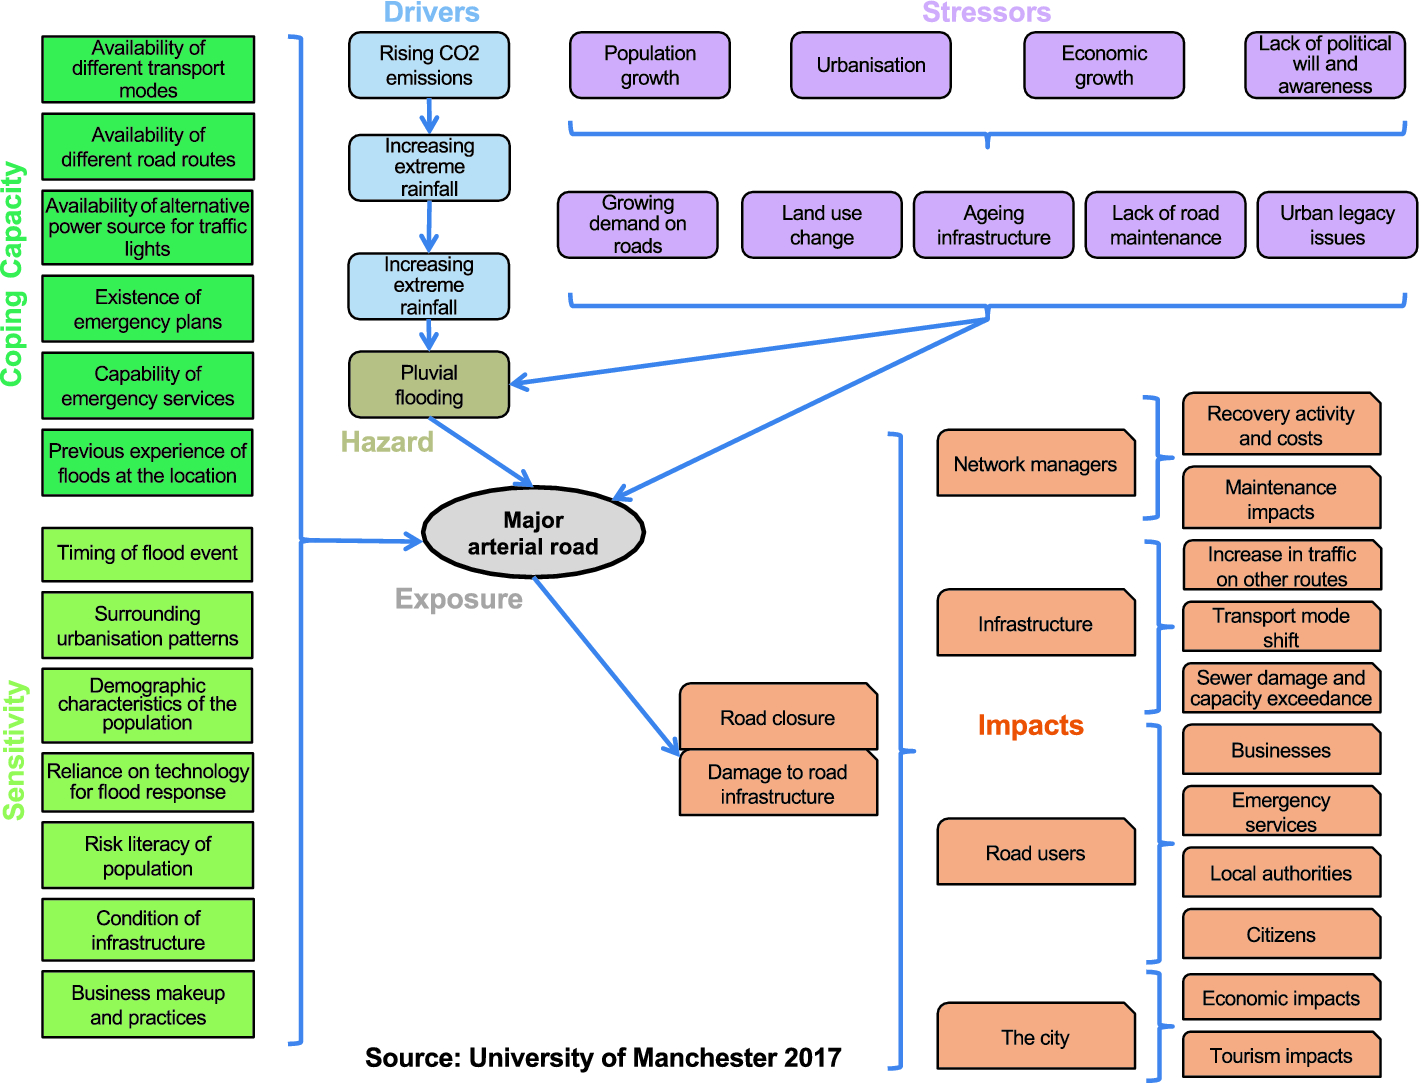
Impact chain sample for the hazard-exposure combination “pluvial flooding on a major arterial road” in the City of Greater Manchester. Hazards & drivers in blue, exposed object in grey, coping capacity in green-blue, sensitivity in green, and impacts in orange. Both stressors and impacts included cascading effects
(Source: University of Manchester/RESIN) (Color figure online)
4.2 Risk Assessment for the City of Bilbao, Spain
For the City of Bilbao three impact chains were developed during a workshop with relevant stakeholders and RESIN research partners. These impact chains covered the effects of heatwaves on public health, extreme precipitation on road traffic infrastructure, and flooding on built-up infrastructure (see Fig. 3).
To conduct the assessments for these impact chains, the Bilbao City council provided city wide spatial data for all sensitivity and coping capacity indicators and, where possible, also historic data related to the defined impacts. The spatial data included, for example, the distribution of parks and forests across the city, building location, construction/restauration year, and number of floors, as well as position, length, and diameter of sewer pipes. Where necessary the provided data was further processed (e.g. lengths and diameters of pipes where used to calculate volume) before being further processed to calculate indicator values. Subsequently, the indicator values where normalized to a scale from 0 (‘optimal’) to 1 (‘critical’) using min-max normalization and aggregated to sensitivity and coping capacity scores via weighted arithmetic mean. Weights for different indicators were chosen by the partners from the Bilbao city council based on their perceived importance. Where necessary the indicator values were reversed to ensure both sensitivity and coping capacity scores increase in the same direction. The resulting composite scores were then normalized and aggregated to vulnerability scores using the same methods as before.
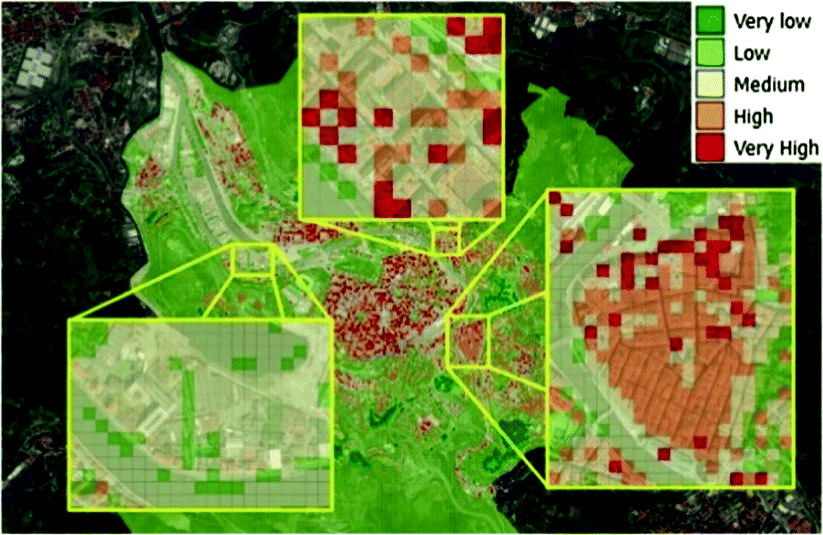
Left: Vulnerability map of Bilbao for flooding in built-up areas. (Color figure online)
Based on these results, risks were calculated for a 500 year flood. To this end, the Bilbao City council provided flood maps, with information about flooded area, flood velocity, and flood depth. This information was used to identify exposed built-up infrastructure and estimate expected worst-case impacts for all impact categories defined in the impact chain using flood depth-damage functions (see [22] and [23]). These functions combine flood depth and velocity to derive damage values (e.g. residential building damage per m2), which were combined with the actual exposed objects (e.g. the surface area of residential buildings situated in flooded areas) and multiplied by the vulnerability scores to arrive at expected impacts for every cell.
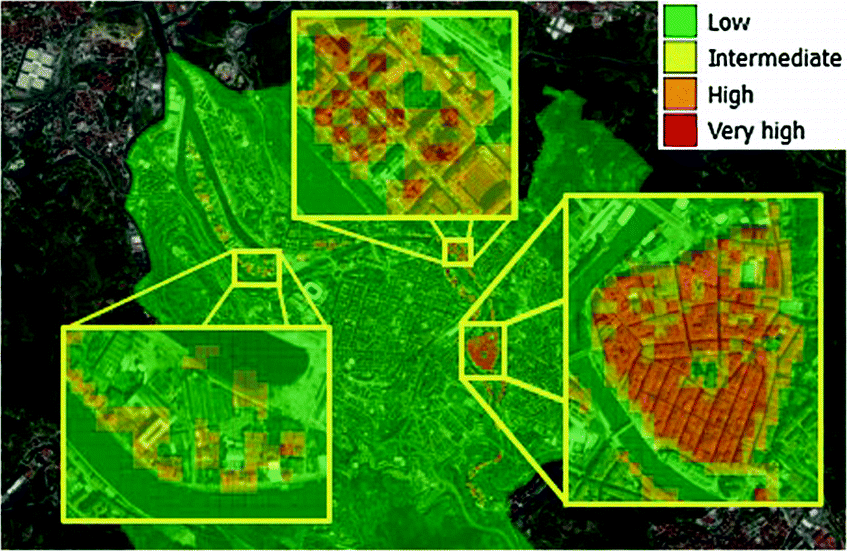
Right: Material risk map of Bilbao for flooding in built-up areas (Color figure online)
5 Conclusion
This paper presented “Impact and Vulnerability Analysis of Vital Infrastructures and Built-up Areas – IVAVIA”, a standardized process for the assessment of climate change related risks and vulnerabilities in cities and urban environments. It shared some background on the concepts behind risk-based vulnerability assessments. Notably, IVAVIA realizes the paradigm shift in the IPCC Assessment Report 5 [7] towards risk-based assessment, proposed as to get more in line with concepts in the Disaster Risk Reduction (and CIP) communities. The paper described the seven interconnected modules constituting the IVAVIA process, presented the set of software tools developed to support end-users in the course of the IVAVIA process, and shared some experiences gained while executing a risk-based vulnerability analysis for the city of Bilbao, Spain. As demonstrated by applying IVAVIA on the municipalities Bilbao, Greater Manchester, Paris, and Bratislava, the process is a feasible means to analyze risks and vulnerabilities regarding the impact of climate change in local urban contexts. While supporting its end-users with practical guidance, IVAVIA is flexible enough to be applicable to urban areas of different size and organization, and suffering from different combinations of hazards. In further steps, the case studies will be completed, enabling further validation of the process and tool set, and helping to ensure applicability for end-users.
Acknowledgments
The authors thank their partners in the RESIN consortium for their valuable contributions during the development and test process. This paper is based in part upon work in the framework of the project “RESIN – Climate Resilient Cities and Infrastructures”. This project has received funding from the European Union’s Horizon 2020 research and innovation program under grant agreement no. 653522. The sole responsibility for the content of this publication lies with the authors. It does not necessarily represent the opinion of the European Union. Neither the EASME nor the European Commission are responsible for any use that may be made of the information contained therein.
We would like to thank Till Below (GIZ) and Stefan Schneiderbauer (Eurac) as representatives of the colleagues in their organizations who have created the “The Vulnerability Sourcebook” in 2014. We are also grateful for the repeated collaboration and exchanges between GIZ, Eurac and Fraunhofer since 2016, which contributed to shaping both the Sourcebook supplement and the IVAVIA Guideline document.