Presentation Slides and Transcript
Hello, everyone, my name is Dmitry Vostokov, and I teach this training course.
These prerequisites are hard to define. Some of you have software development experience and some not. However, one thing is certain that to get most of this training, you are expected to have basic troubleshooting experience. Another thing I expect you to be familiar with is hexadecimal notation and that you have seen or can read programming source code in some language. The ability to read assembly language has some advantages but not necessary for most of this training.
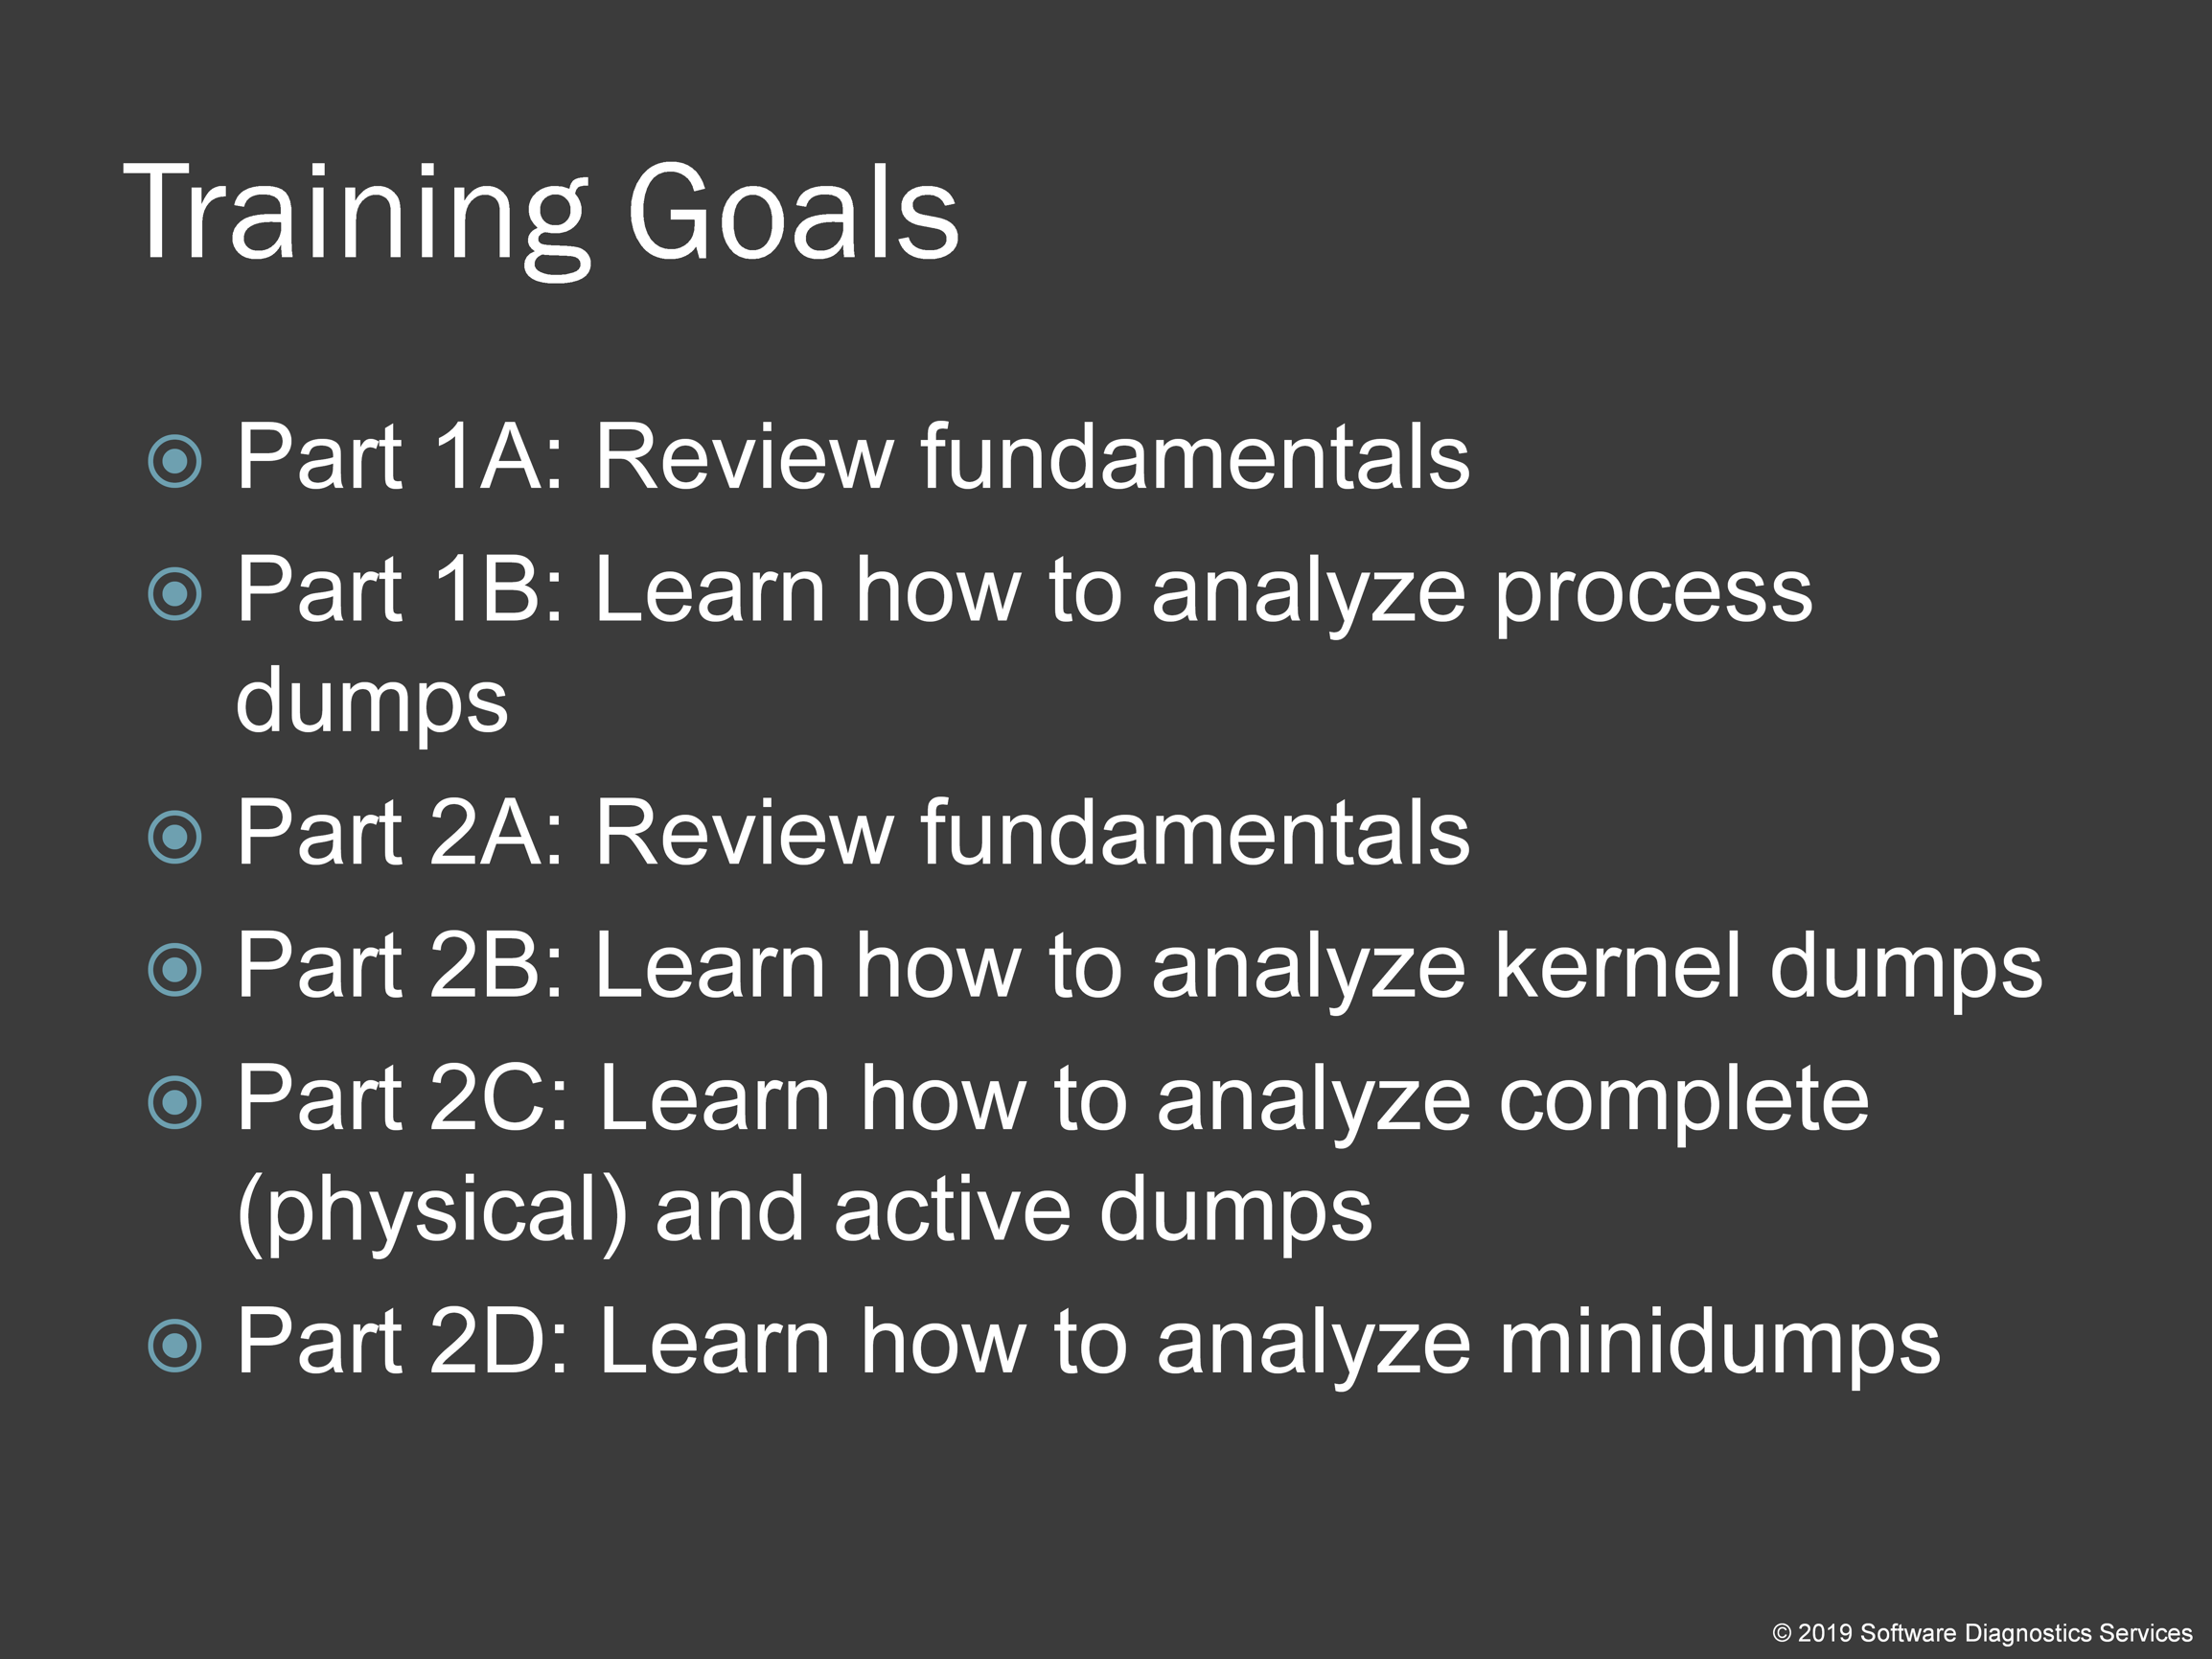
Our primary goal is to learn memory dump analysis in an accelerated fashion. So first, we review absolutely essential fundamentals necessary for memory dump analysis. Then we learn how to analyze different types of memory dumps. Part 1 is concerned with process memory dumps. Part 2 is about kernel, complete (physical), and minidumps. Also, this training is about memory dump analysis and not about memory dump collection methods, tricks, and tips. Some collection methods and principles are listed in the following presentation’s Special Topic section:
http://www.patterndiagnostics.com/files/LegacyWindowsDebugging.pdf
For me, there were many training formats to consider, and I decided that the best way is to concentrate on exercises. Specifically, for this part of the training, I developed 20 of them. I also left out many concepts traditionally included in such training courses because I felt that they were not really necessary for accelerated training. More specialized topics for process memory dump analysis are covered in the follow-up training courses “Accelerated .NET Memory Dump Analysis” and “Accelerated Windows Malware Analysis with Memory Dumps.” See the slide “Further Training Courses” at the end of this training.
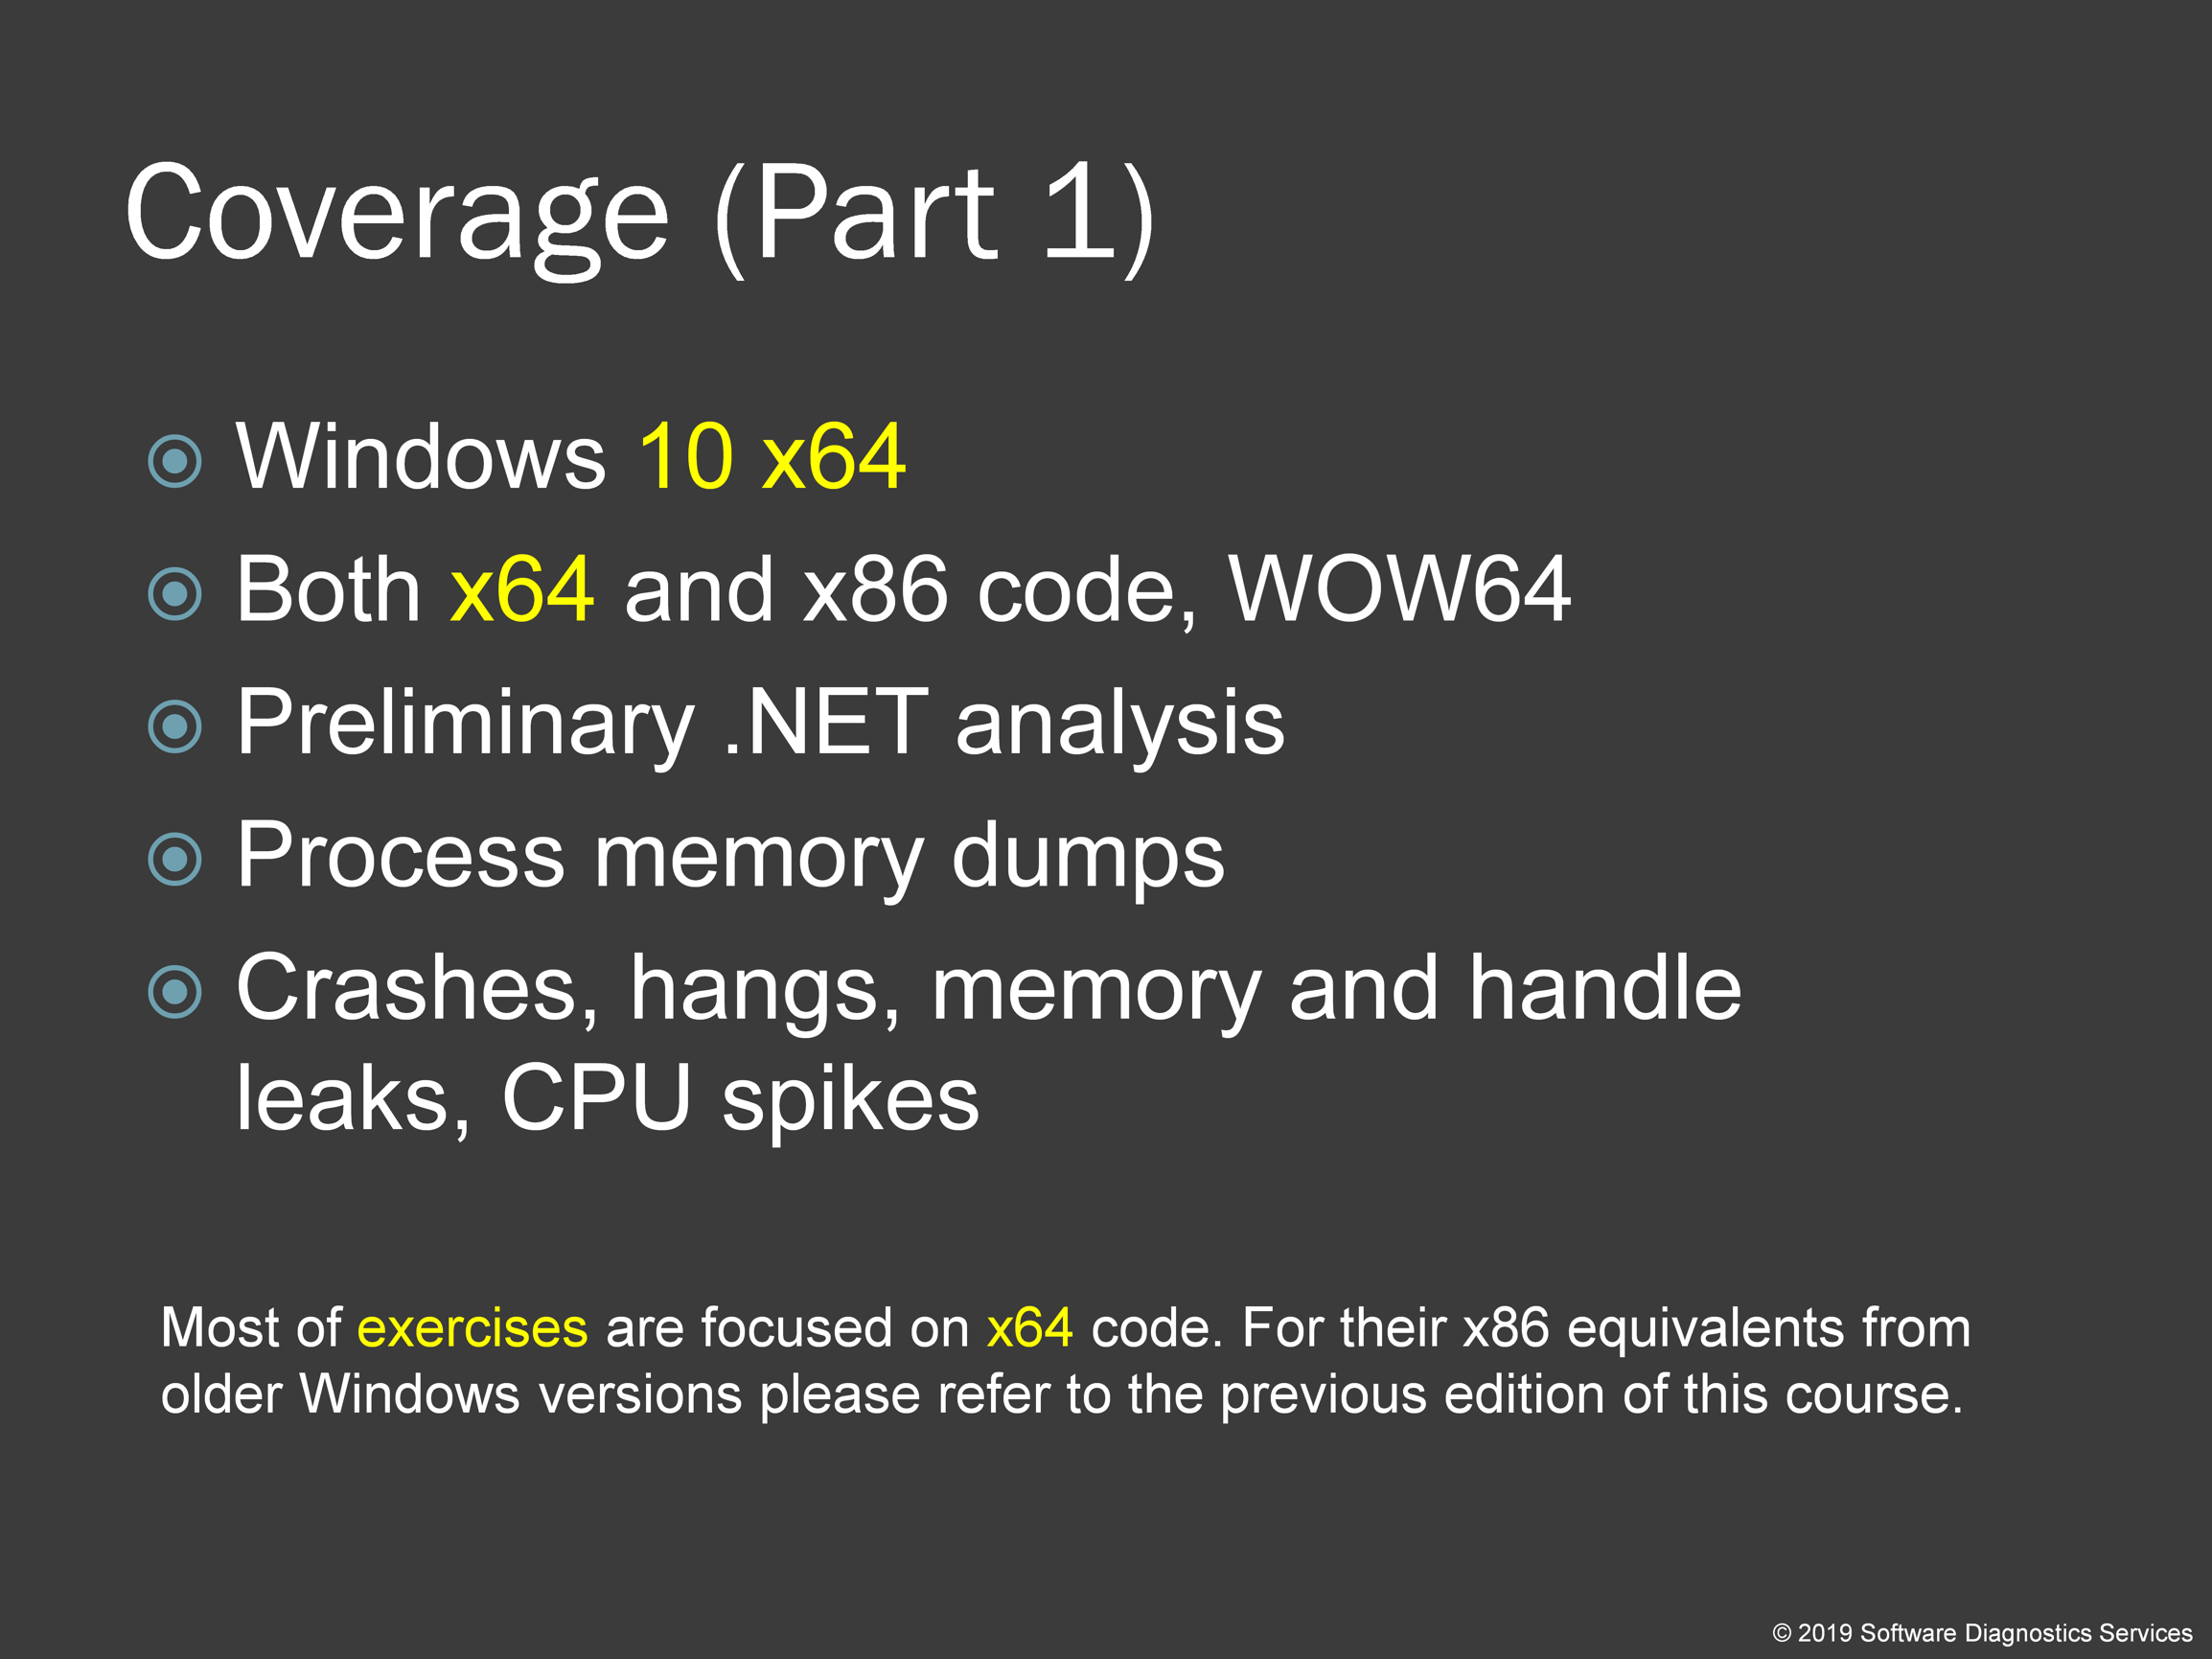
All exercises from this edition focus on memory dumps from Windows 10 x64 platform. Exercises using memory dumps from Windows Vista and Windows 7 are available in the previous editions.
So now I present you some pictures. In the previous editions, we used mostly 32-bit diagram examples since most of the time, fundamentals do not change when we move to x64 Windows platform, and the analysis process most of the time is the same. However, in this edition we added 64-bit diagram examples to reflect recent changes in virtual memory layout and also shift all major slide explanations to them instead of x86.
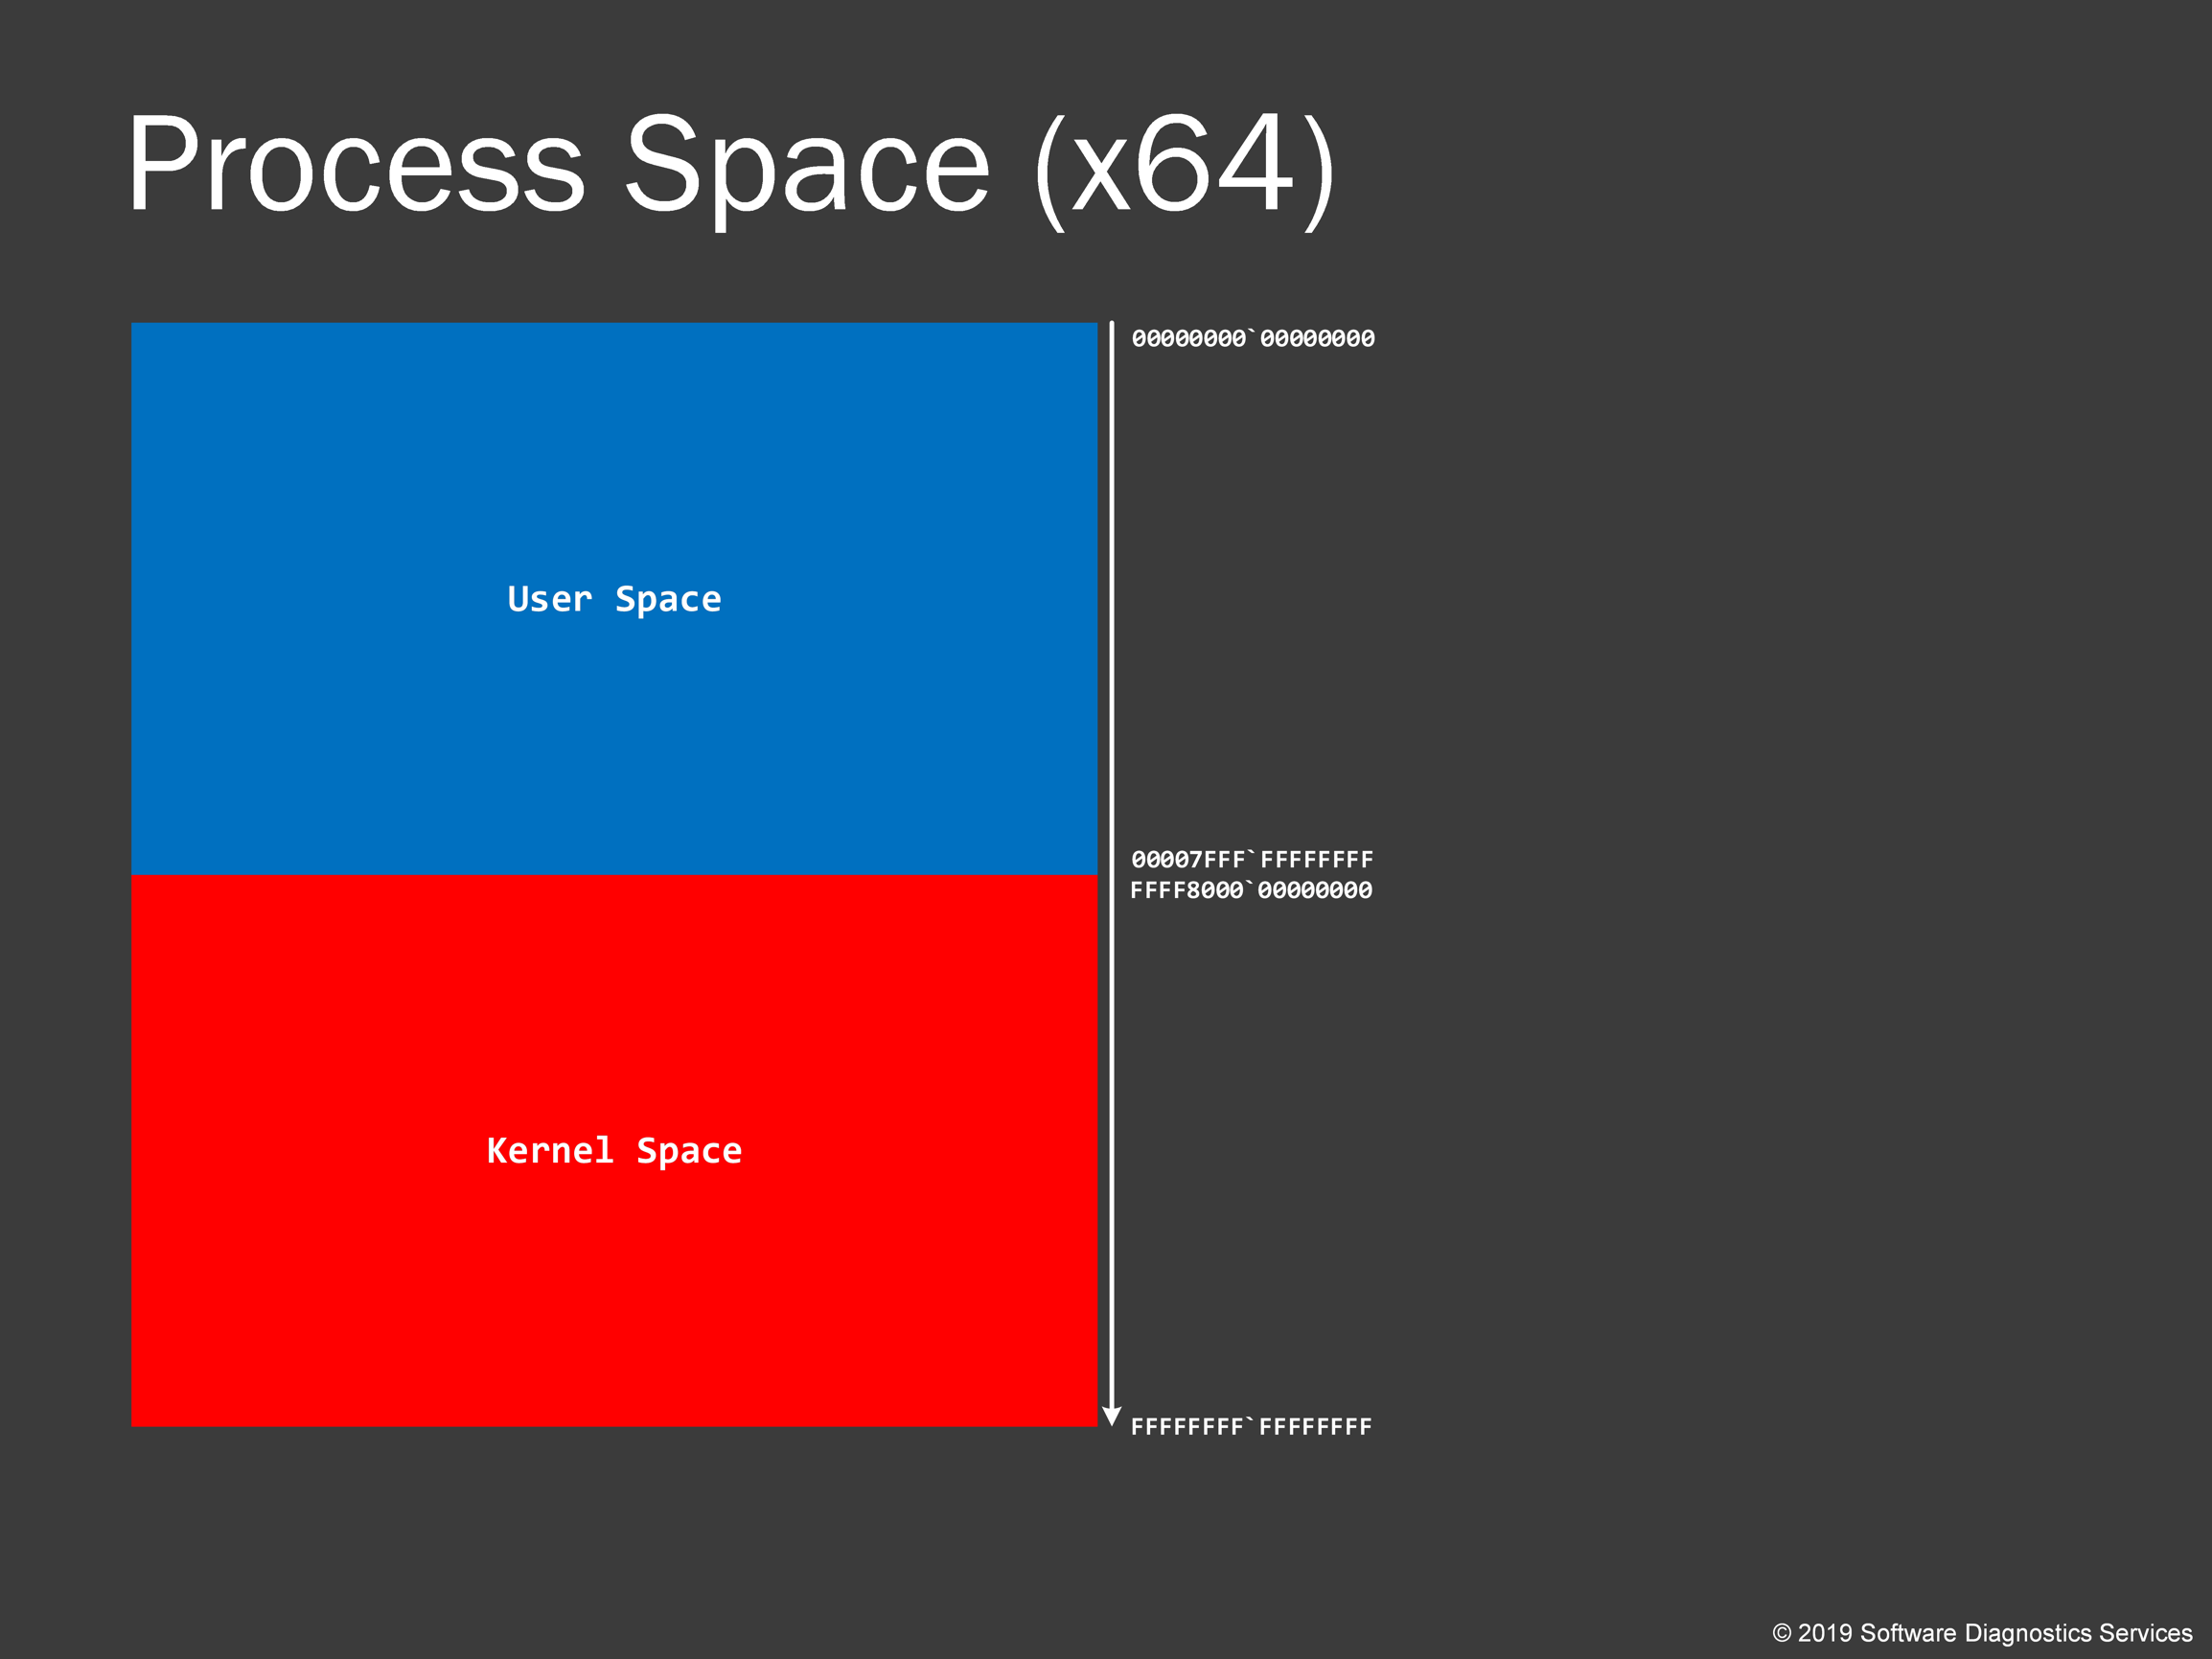
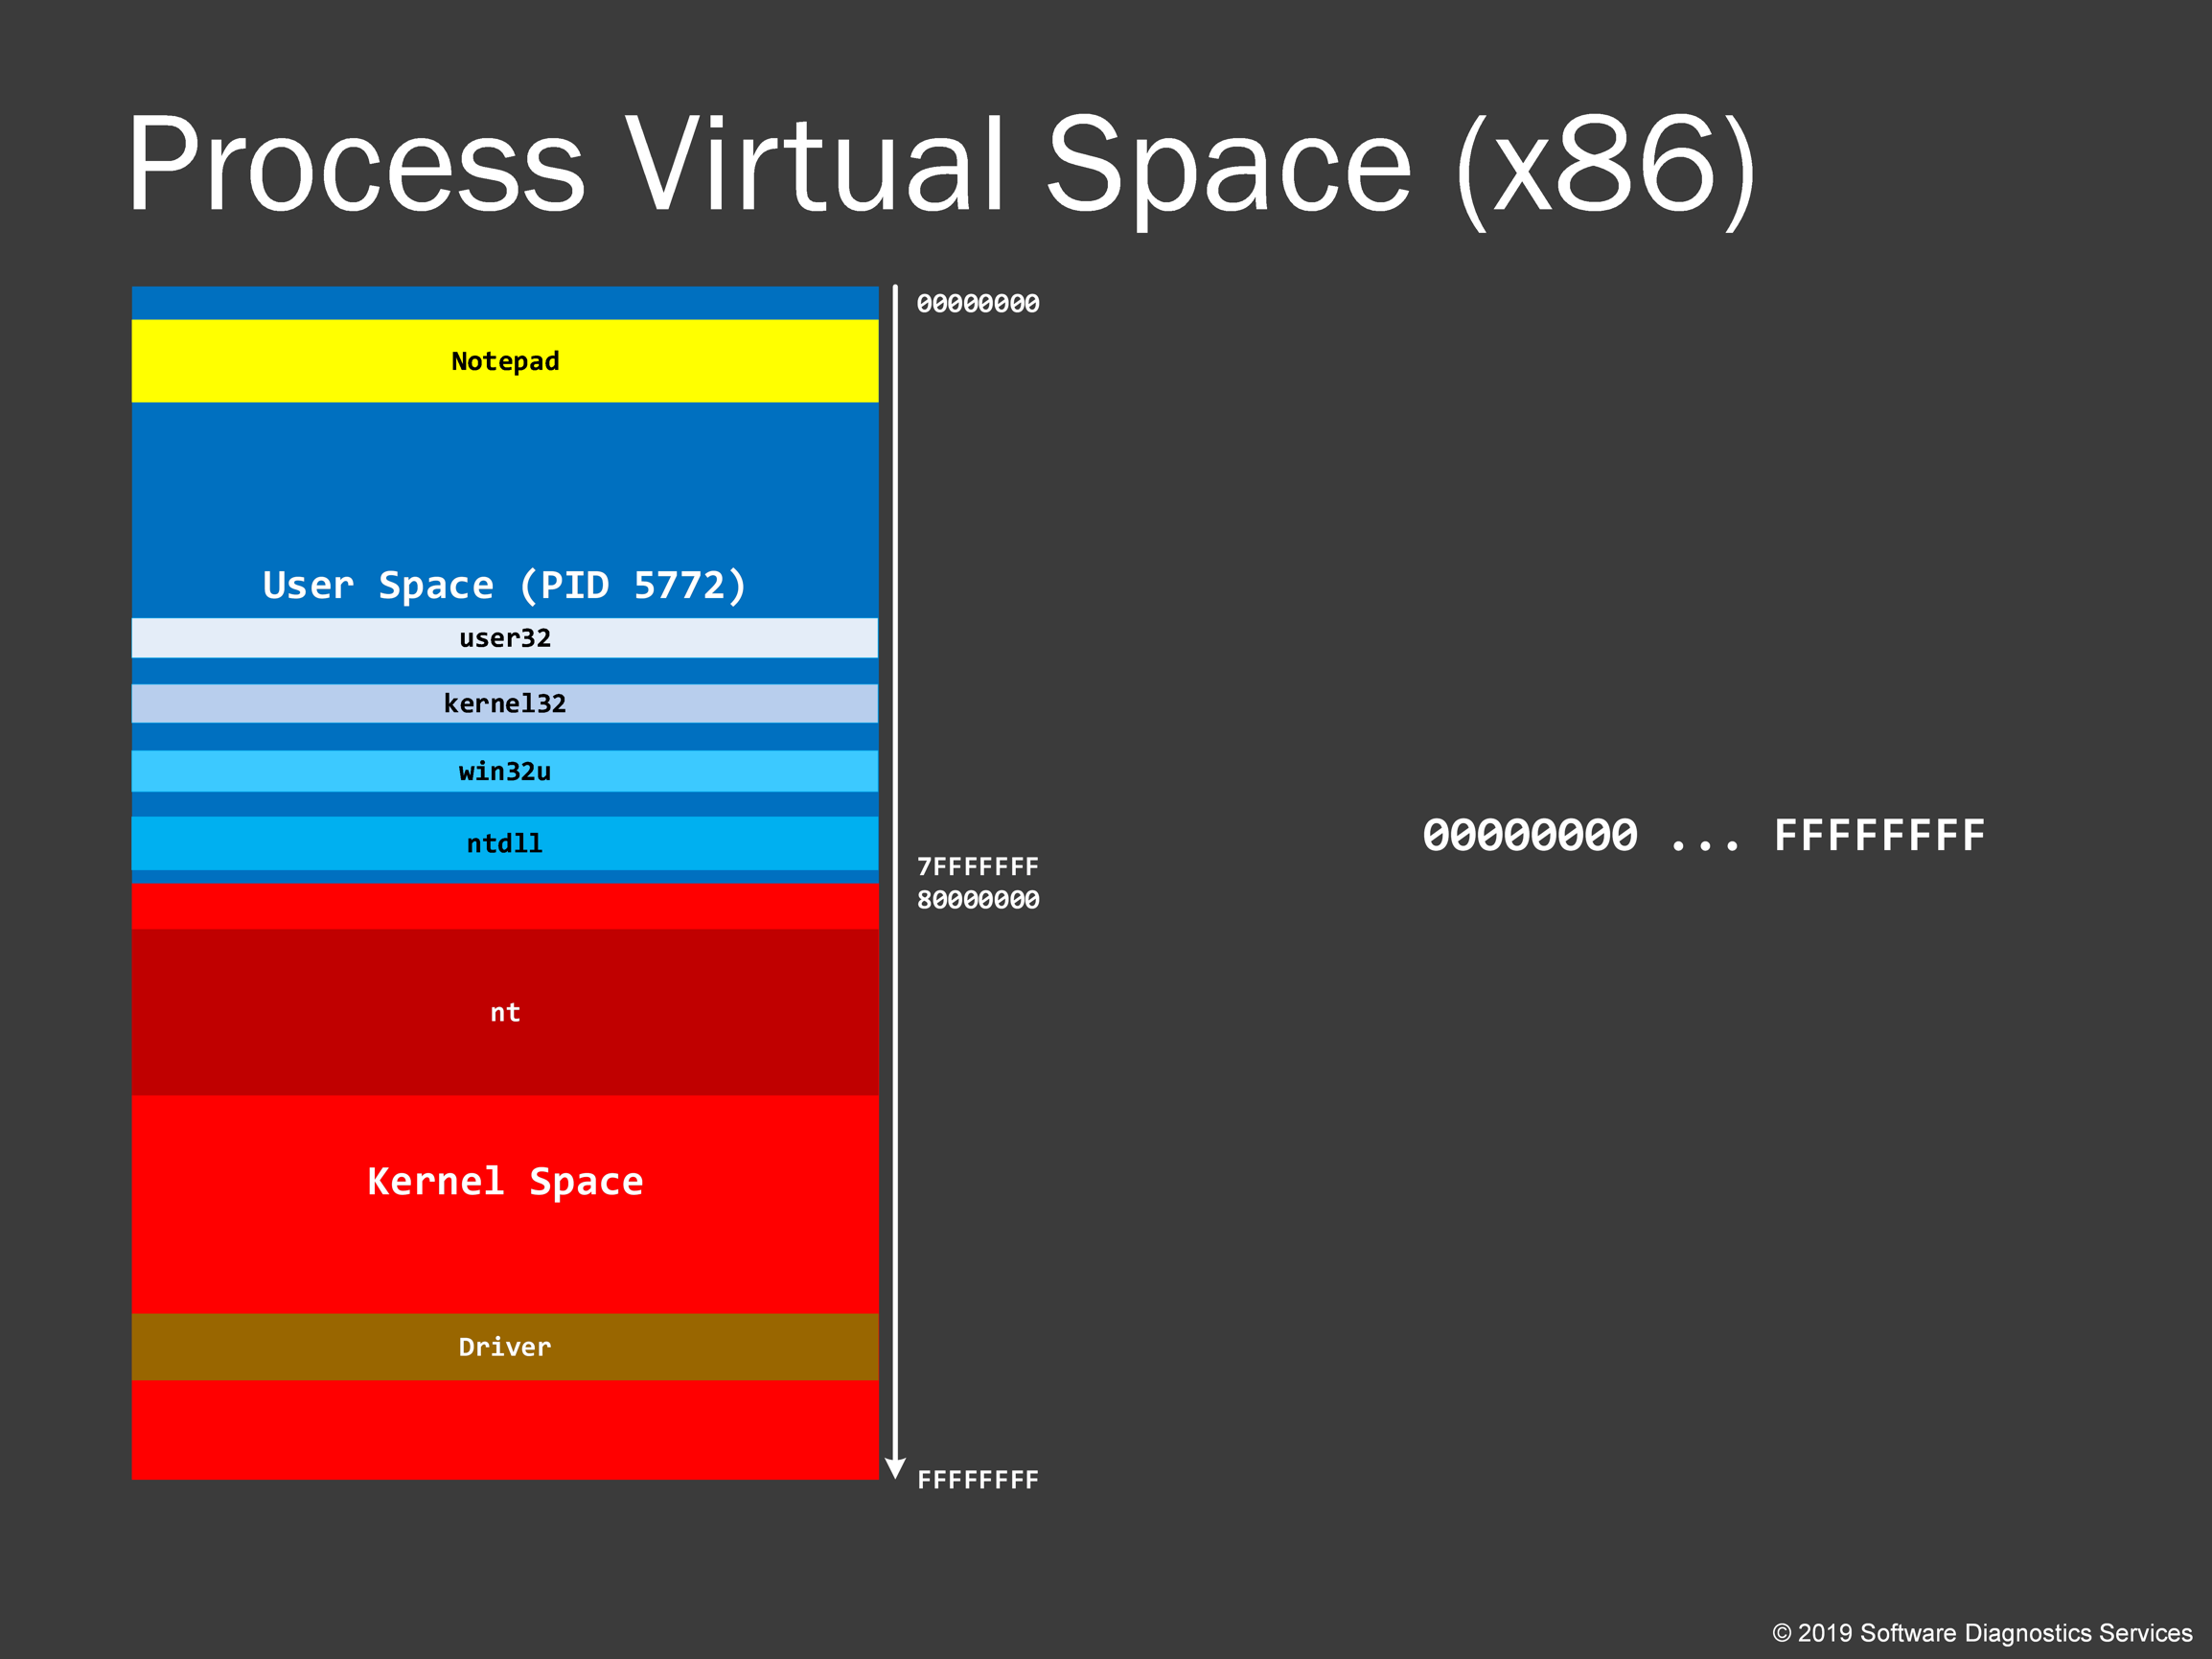
For every process, Windows process memory range is divided into kernel space part and user space part. I follow the long tradition to use red color for kernel and blue color for user part. Please note that there is a difference between space and mode. The mode is execution privilege attribute, for example, code running in kernel space has higher execution privilege than code running in user space. However, kernel code can access user space and access data there. We say that such code is running in kernel mode. On the contrary, the application code from user space is running in user mode, and because of its lower privilege, it cannot access kernel space. This prevents accidental kernel modifications. Otherwise, you could easily crash your system. I put addresses on the right, and on 64-bit systems, all kernel addresses start with a hexadecimal digit “F”. This uniform memory space is called virtual process space because it is an abstraction that allows us to analyze memory dumps without thinking about how it is all organized in physical memory. When we look at process dumps, we are concerned with virtual space only.
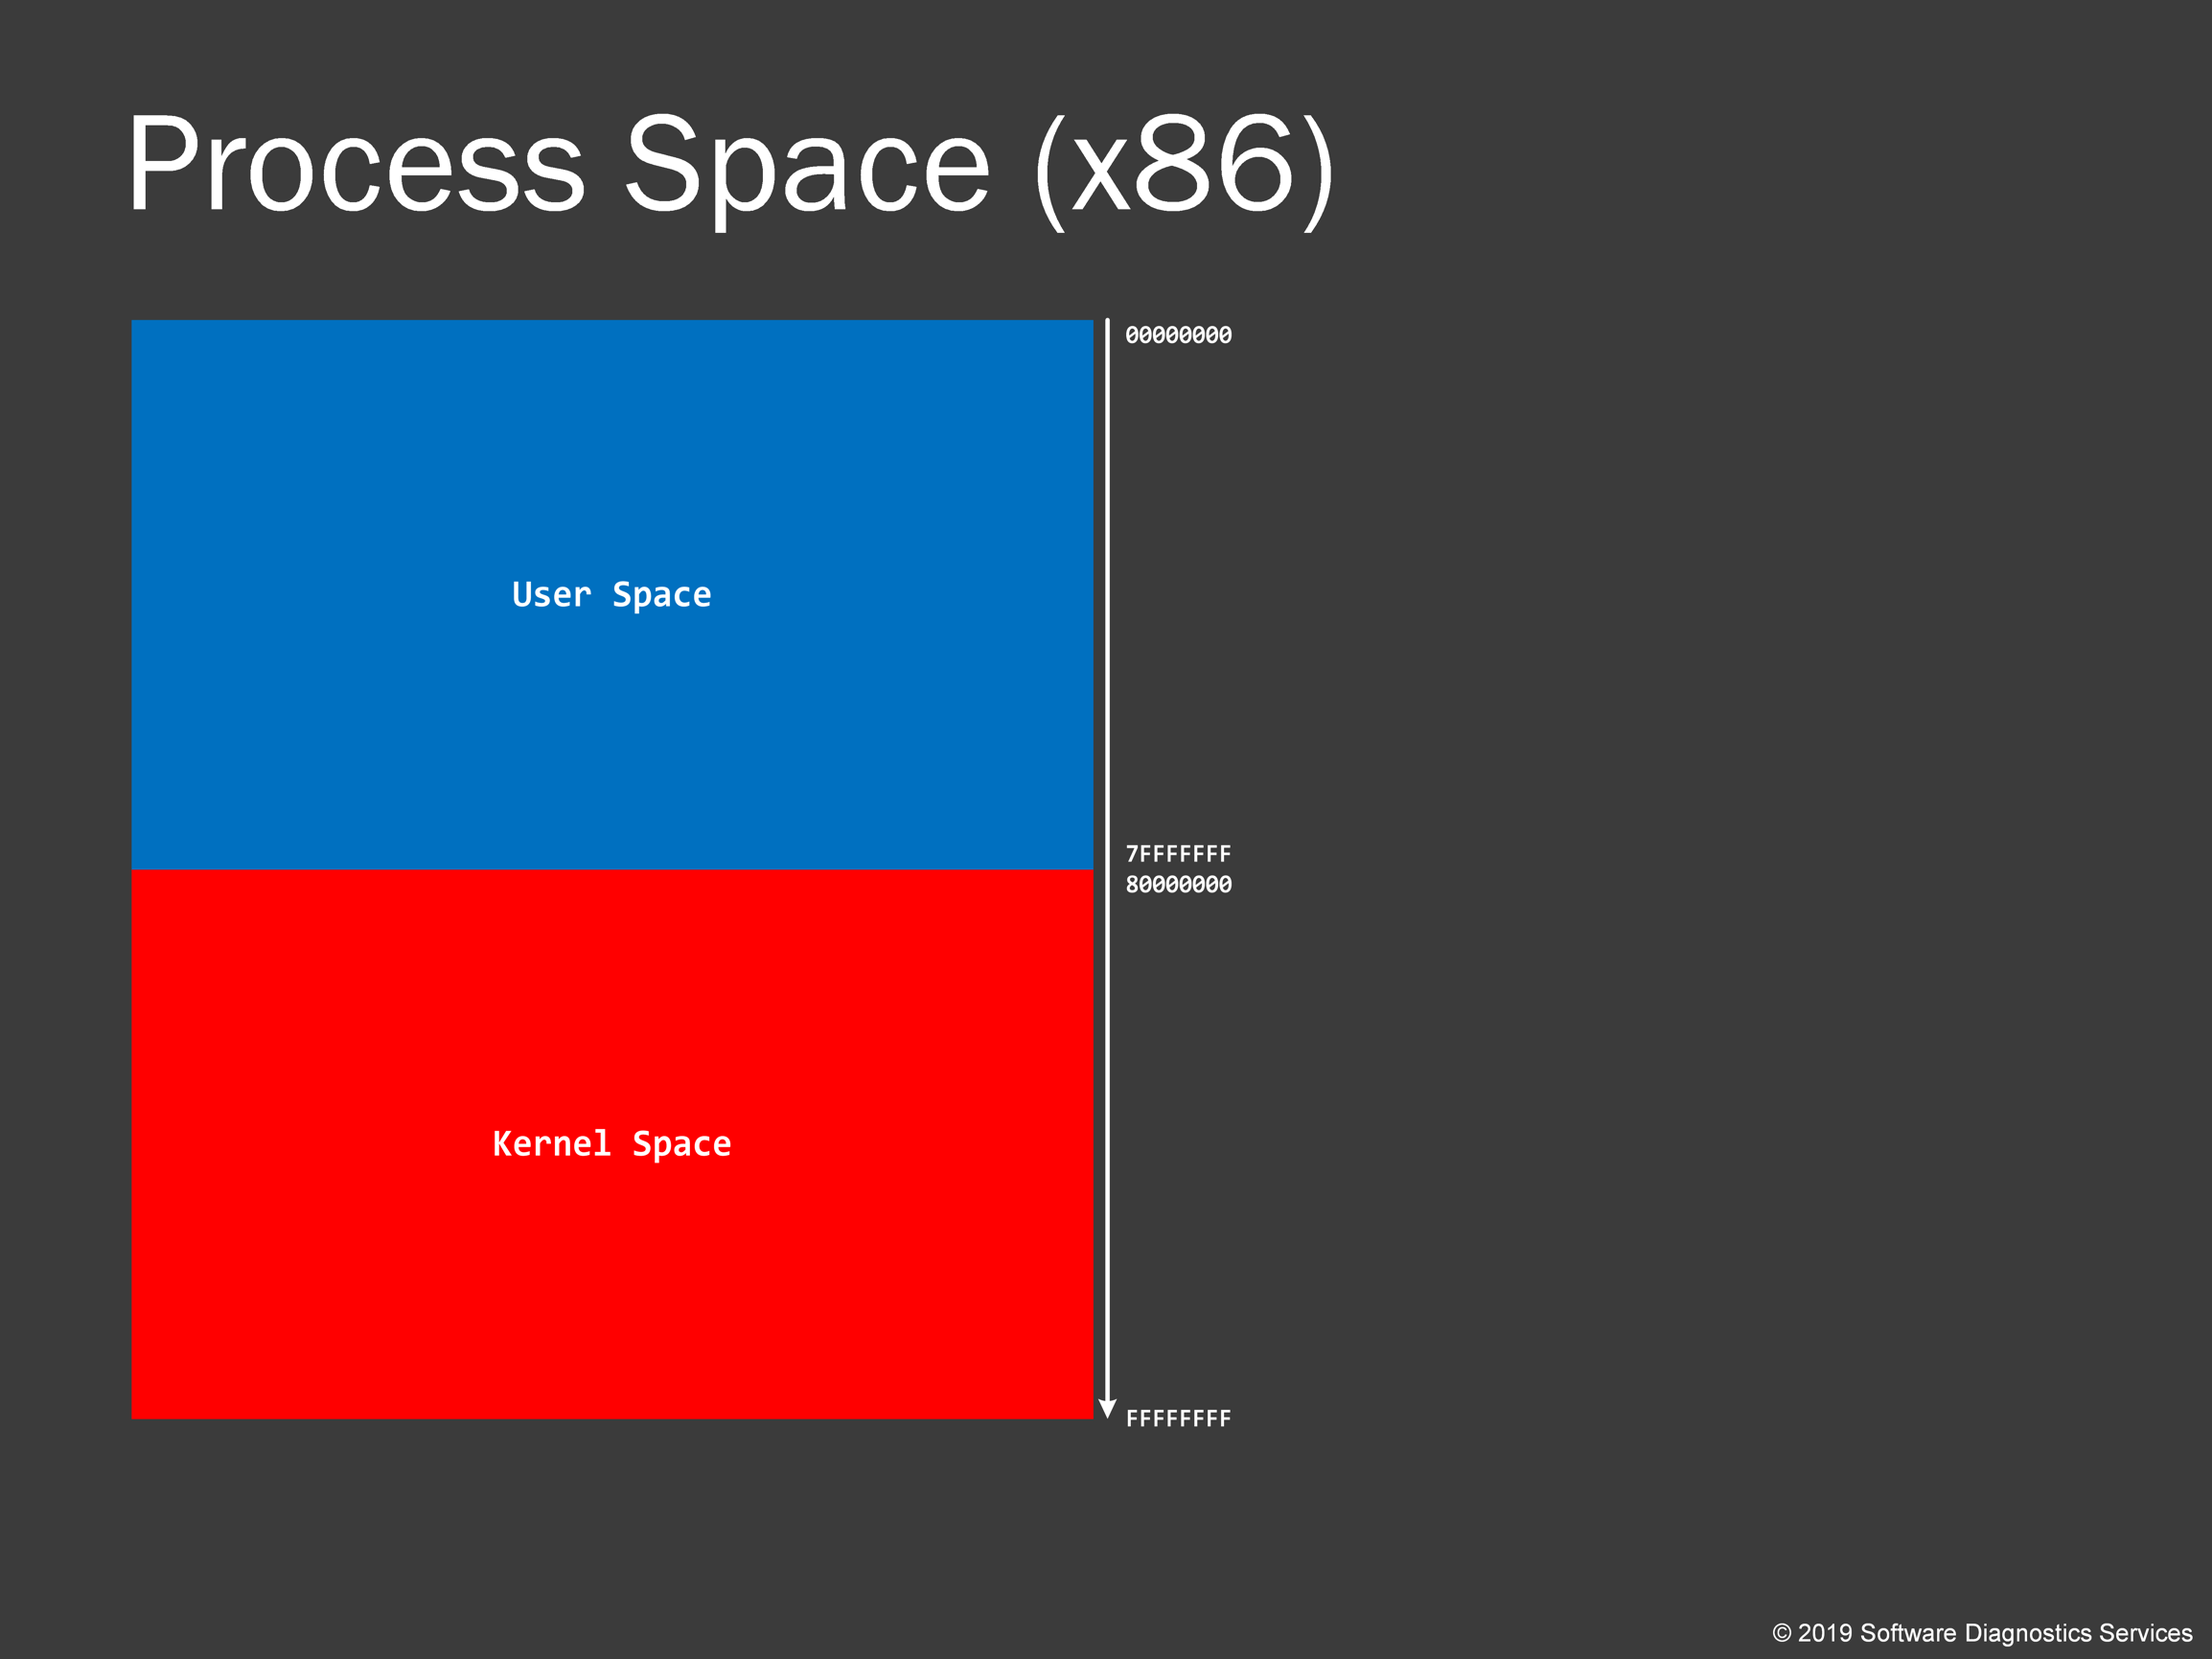
Here’s a typical virtual process address space on 32-bit Windows. We see that kernel space addresses start with a digit “8”.
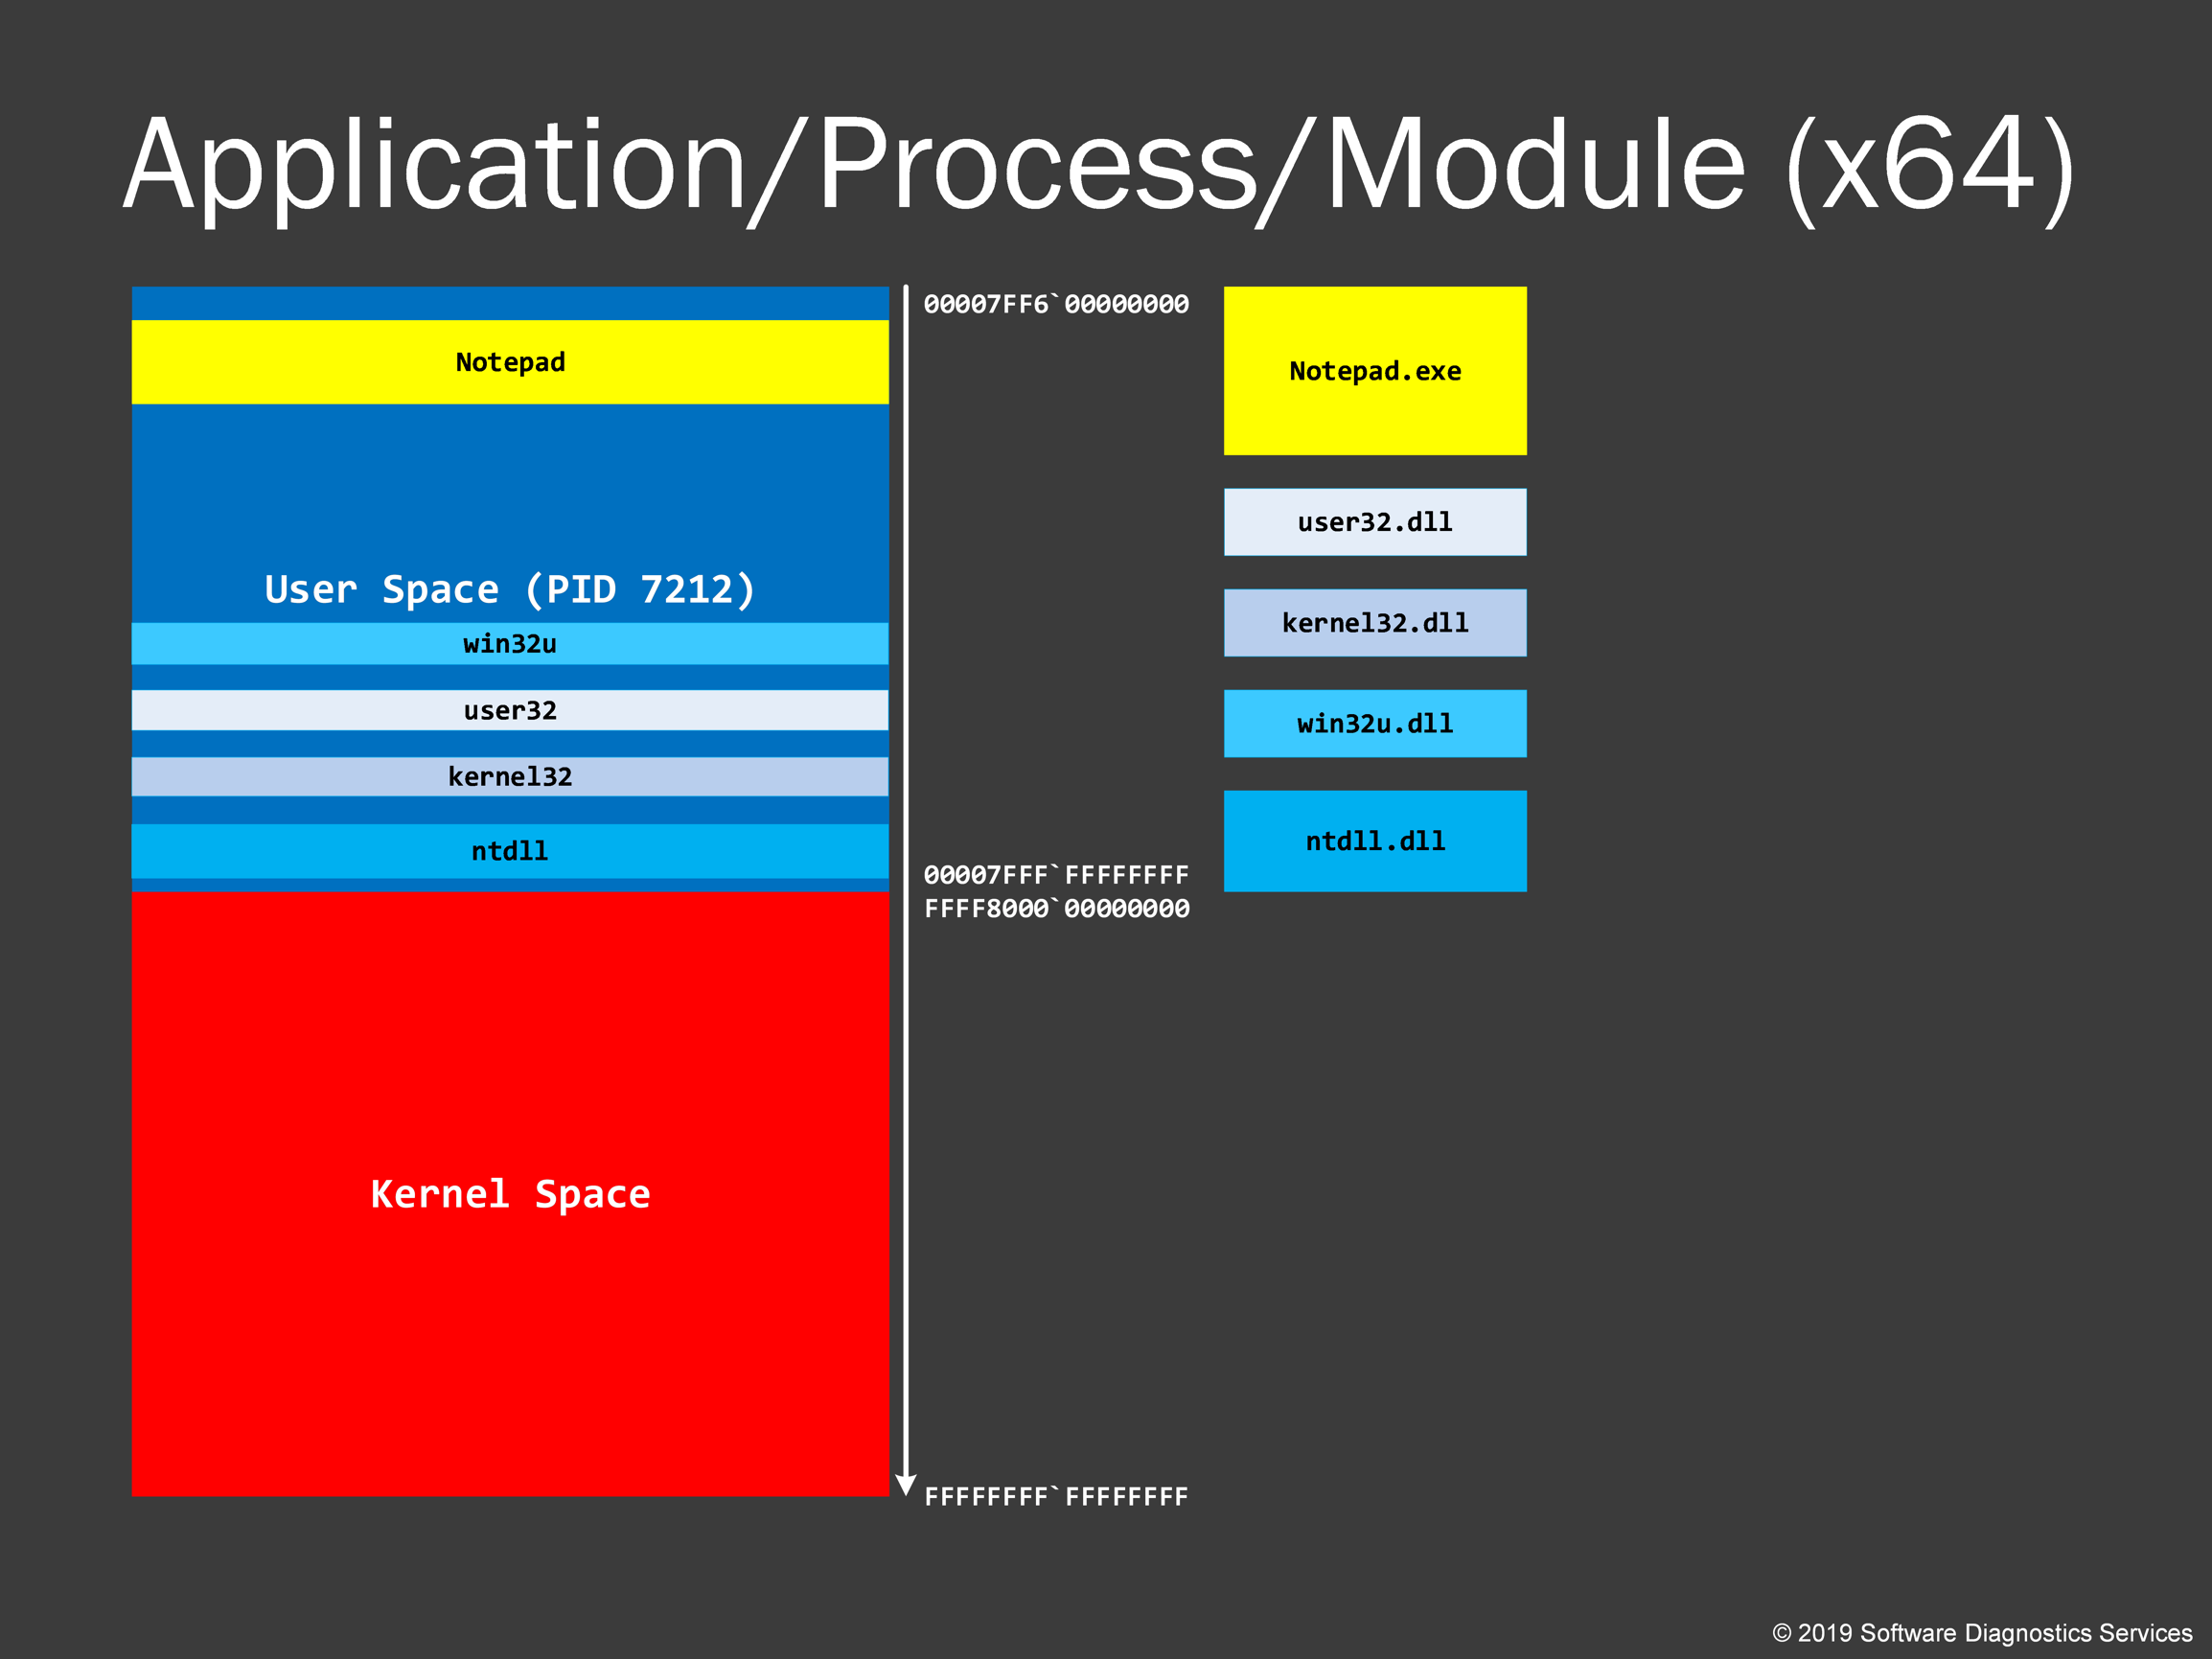
When an application is loaded, all modules (an executable image on a disk and associated DLLs) are organized sequentially in virtual memory space. Some modules can also be loaded twice at different virtual memory locations. A process then is set up for running, and a process ID is assigned to it. If you run another such process it will have the different virtual memory space (could be exactly the same in layout but most recent Windows versions put modules in a different order). We see that the main application executable module is usually loaded above 00007FF0`00000000 address (subject to change with every major update).

32-bit virtual process space has a slightly different arrangement with the main application executable module, which is usually loaded closer to the lower addresses.
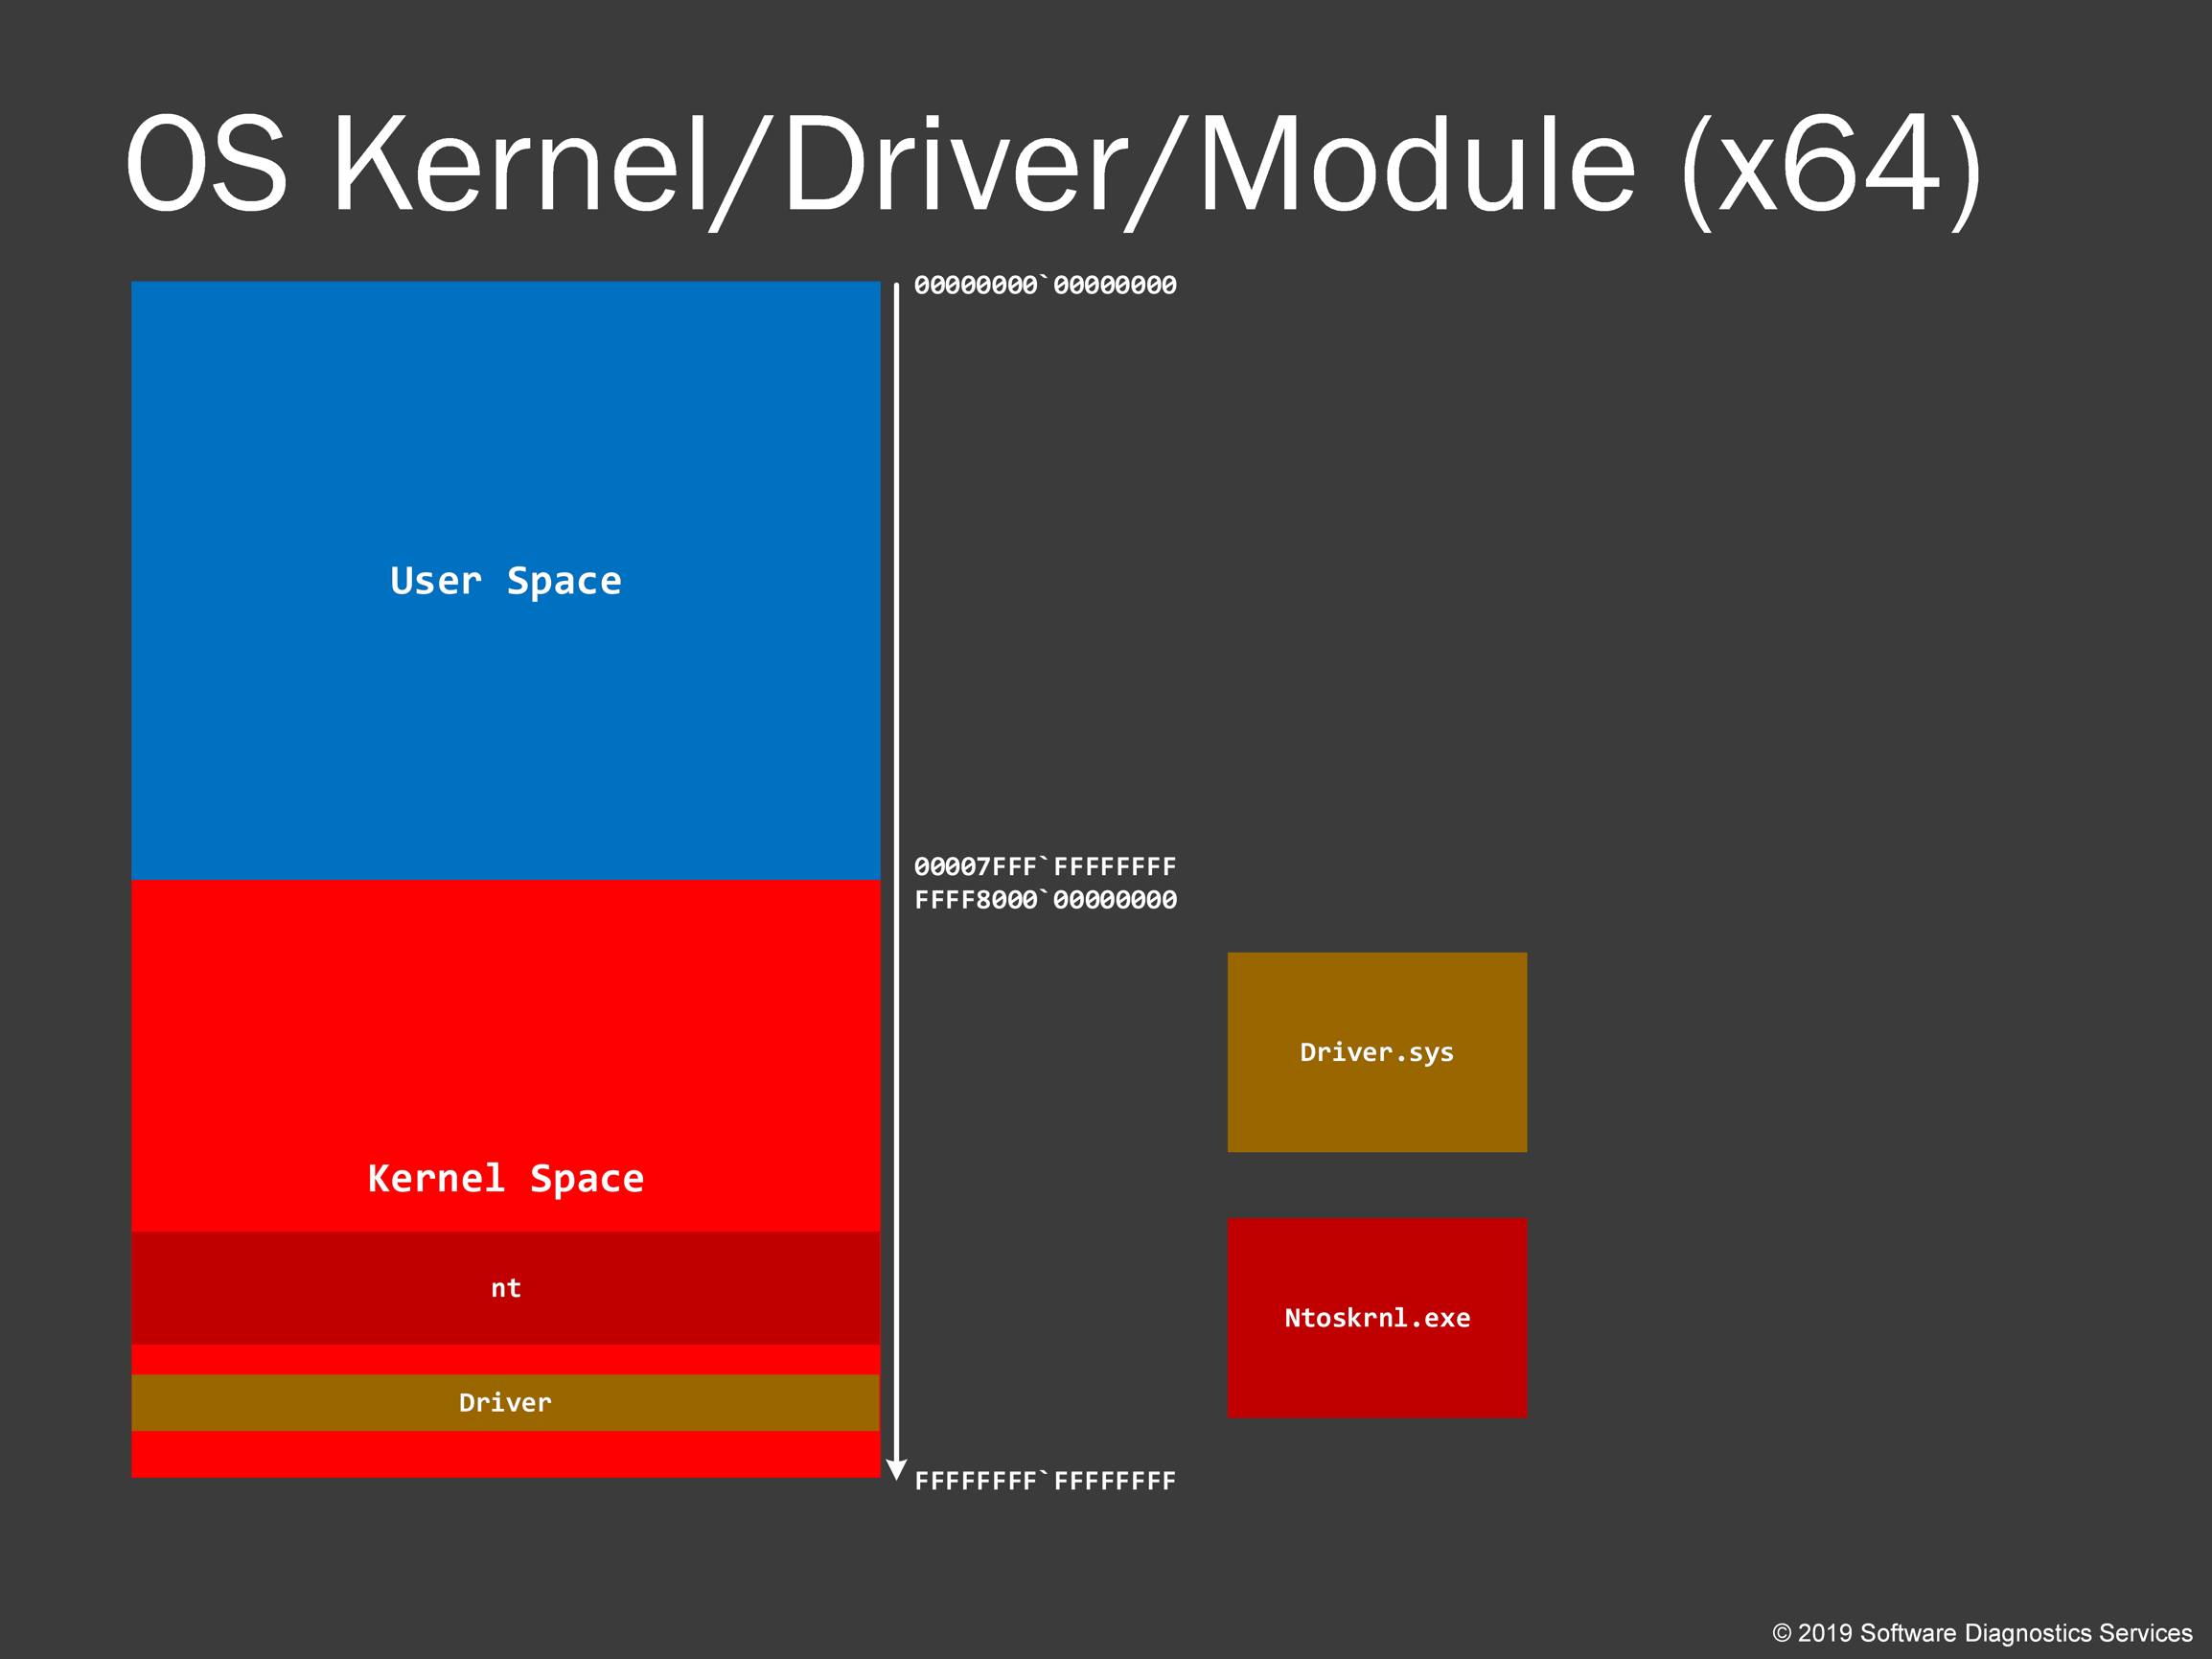
With kernel virtual address space, it is all the same. Actually, the image of Windows kernel is also .exe, and system drivers have similar if not the same format as DLLs and just have a different .sys extension.
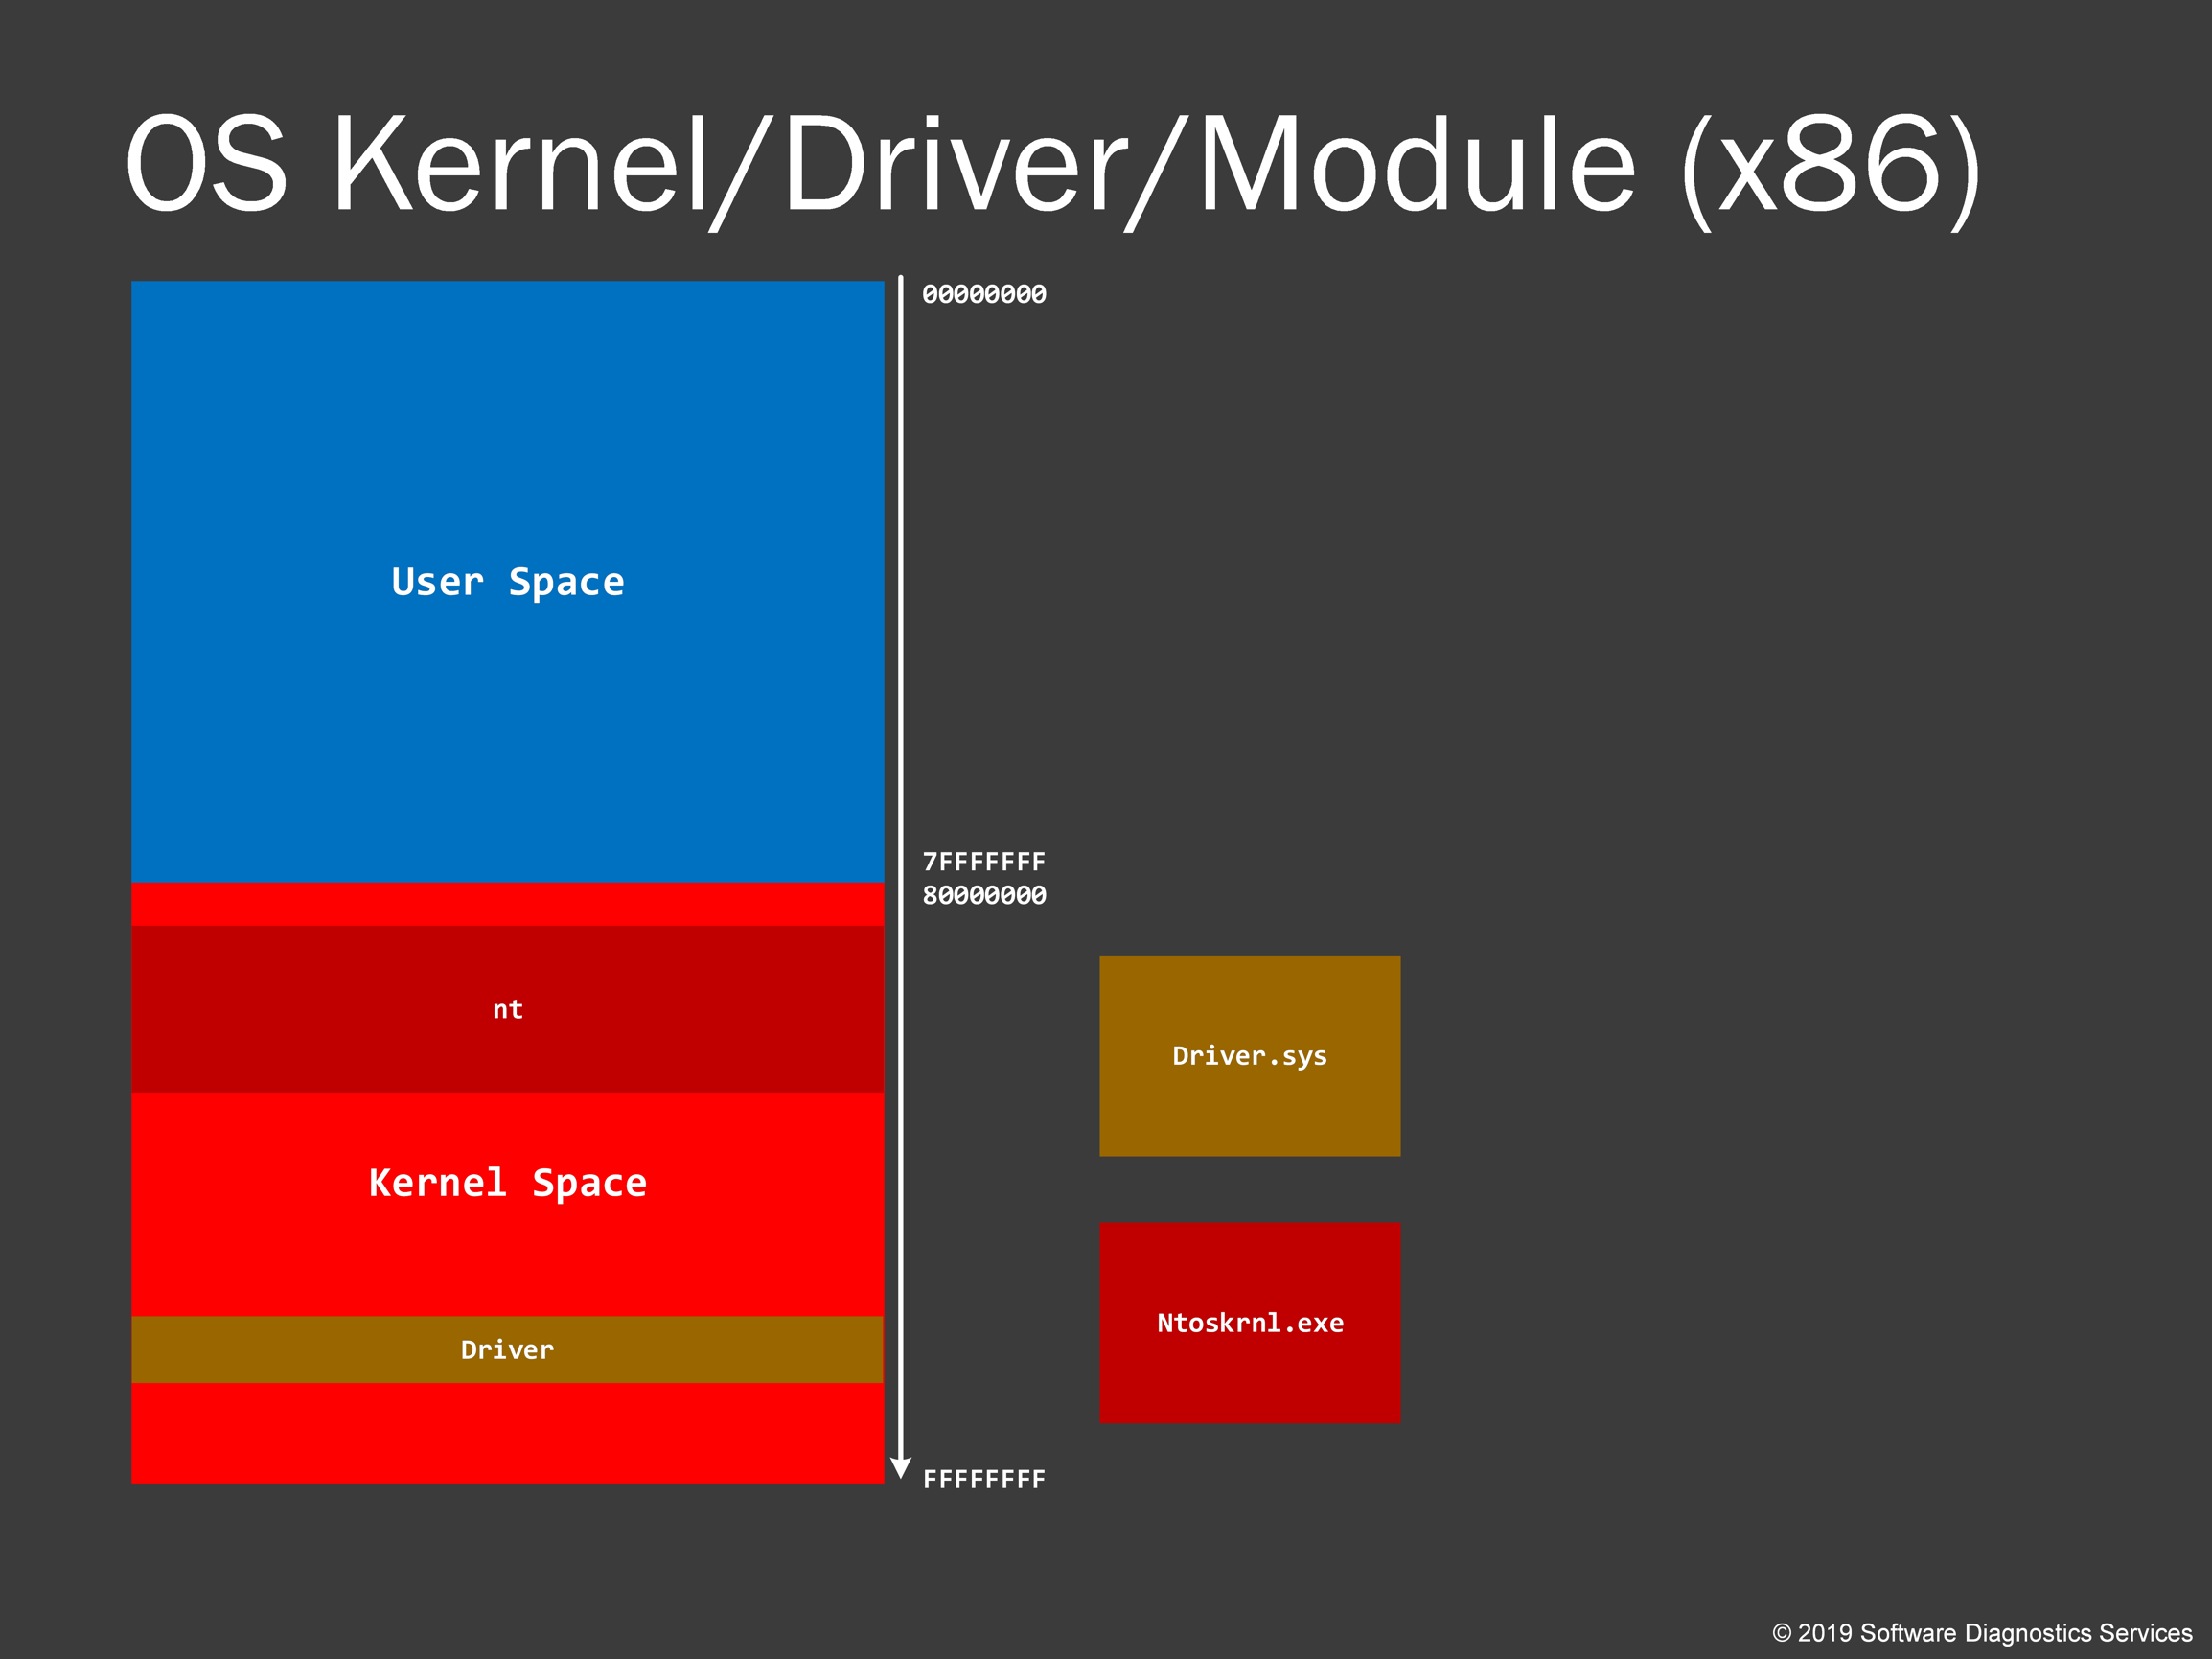
32-bit kernel virtual address space layout is similar too.
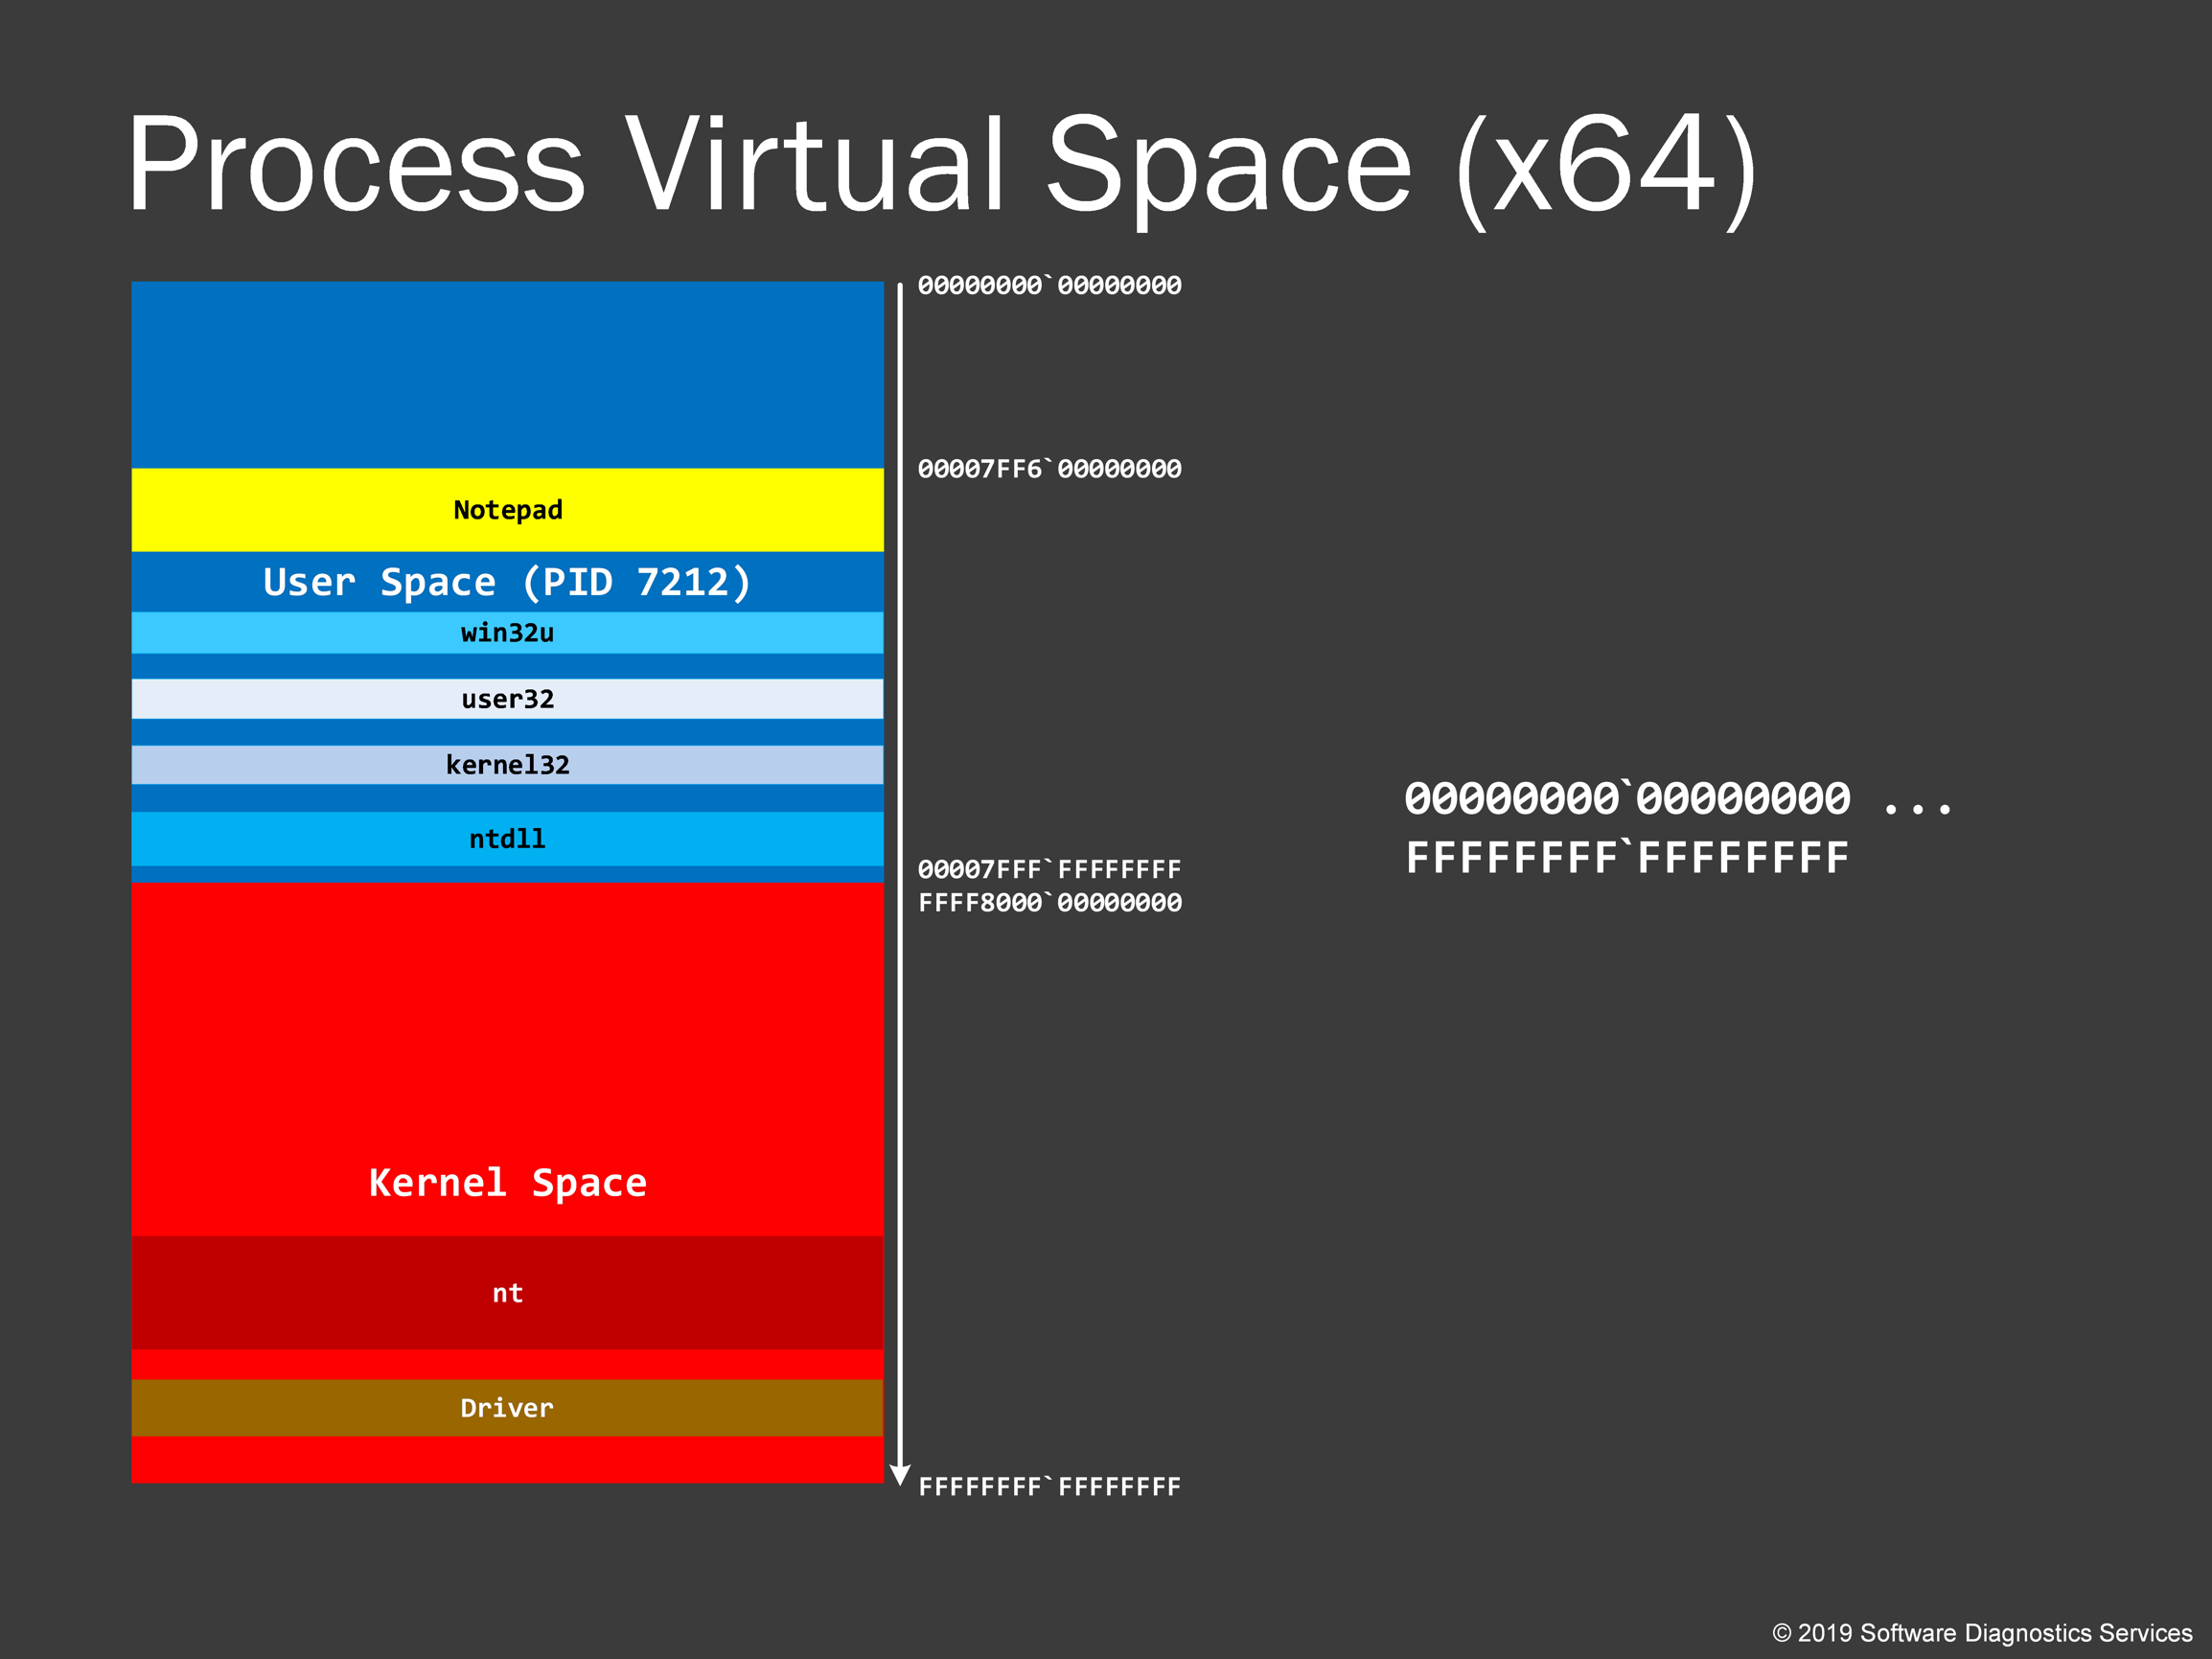
Let’s now see the big picture: the whole virtual process memory space and how it all maps to memory dumps.
32-bit whole process virtual address space has a similar layout.
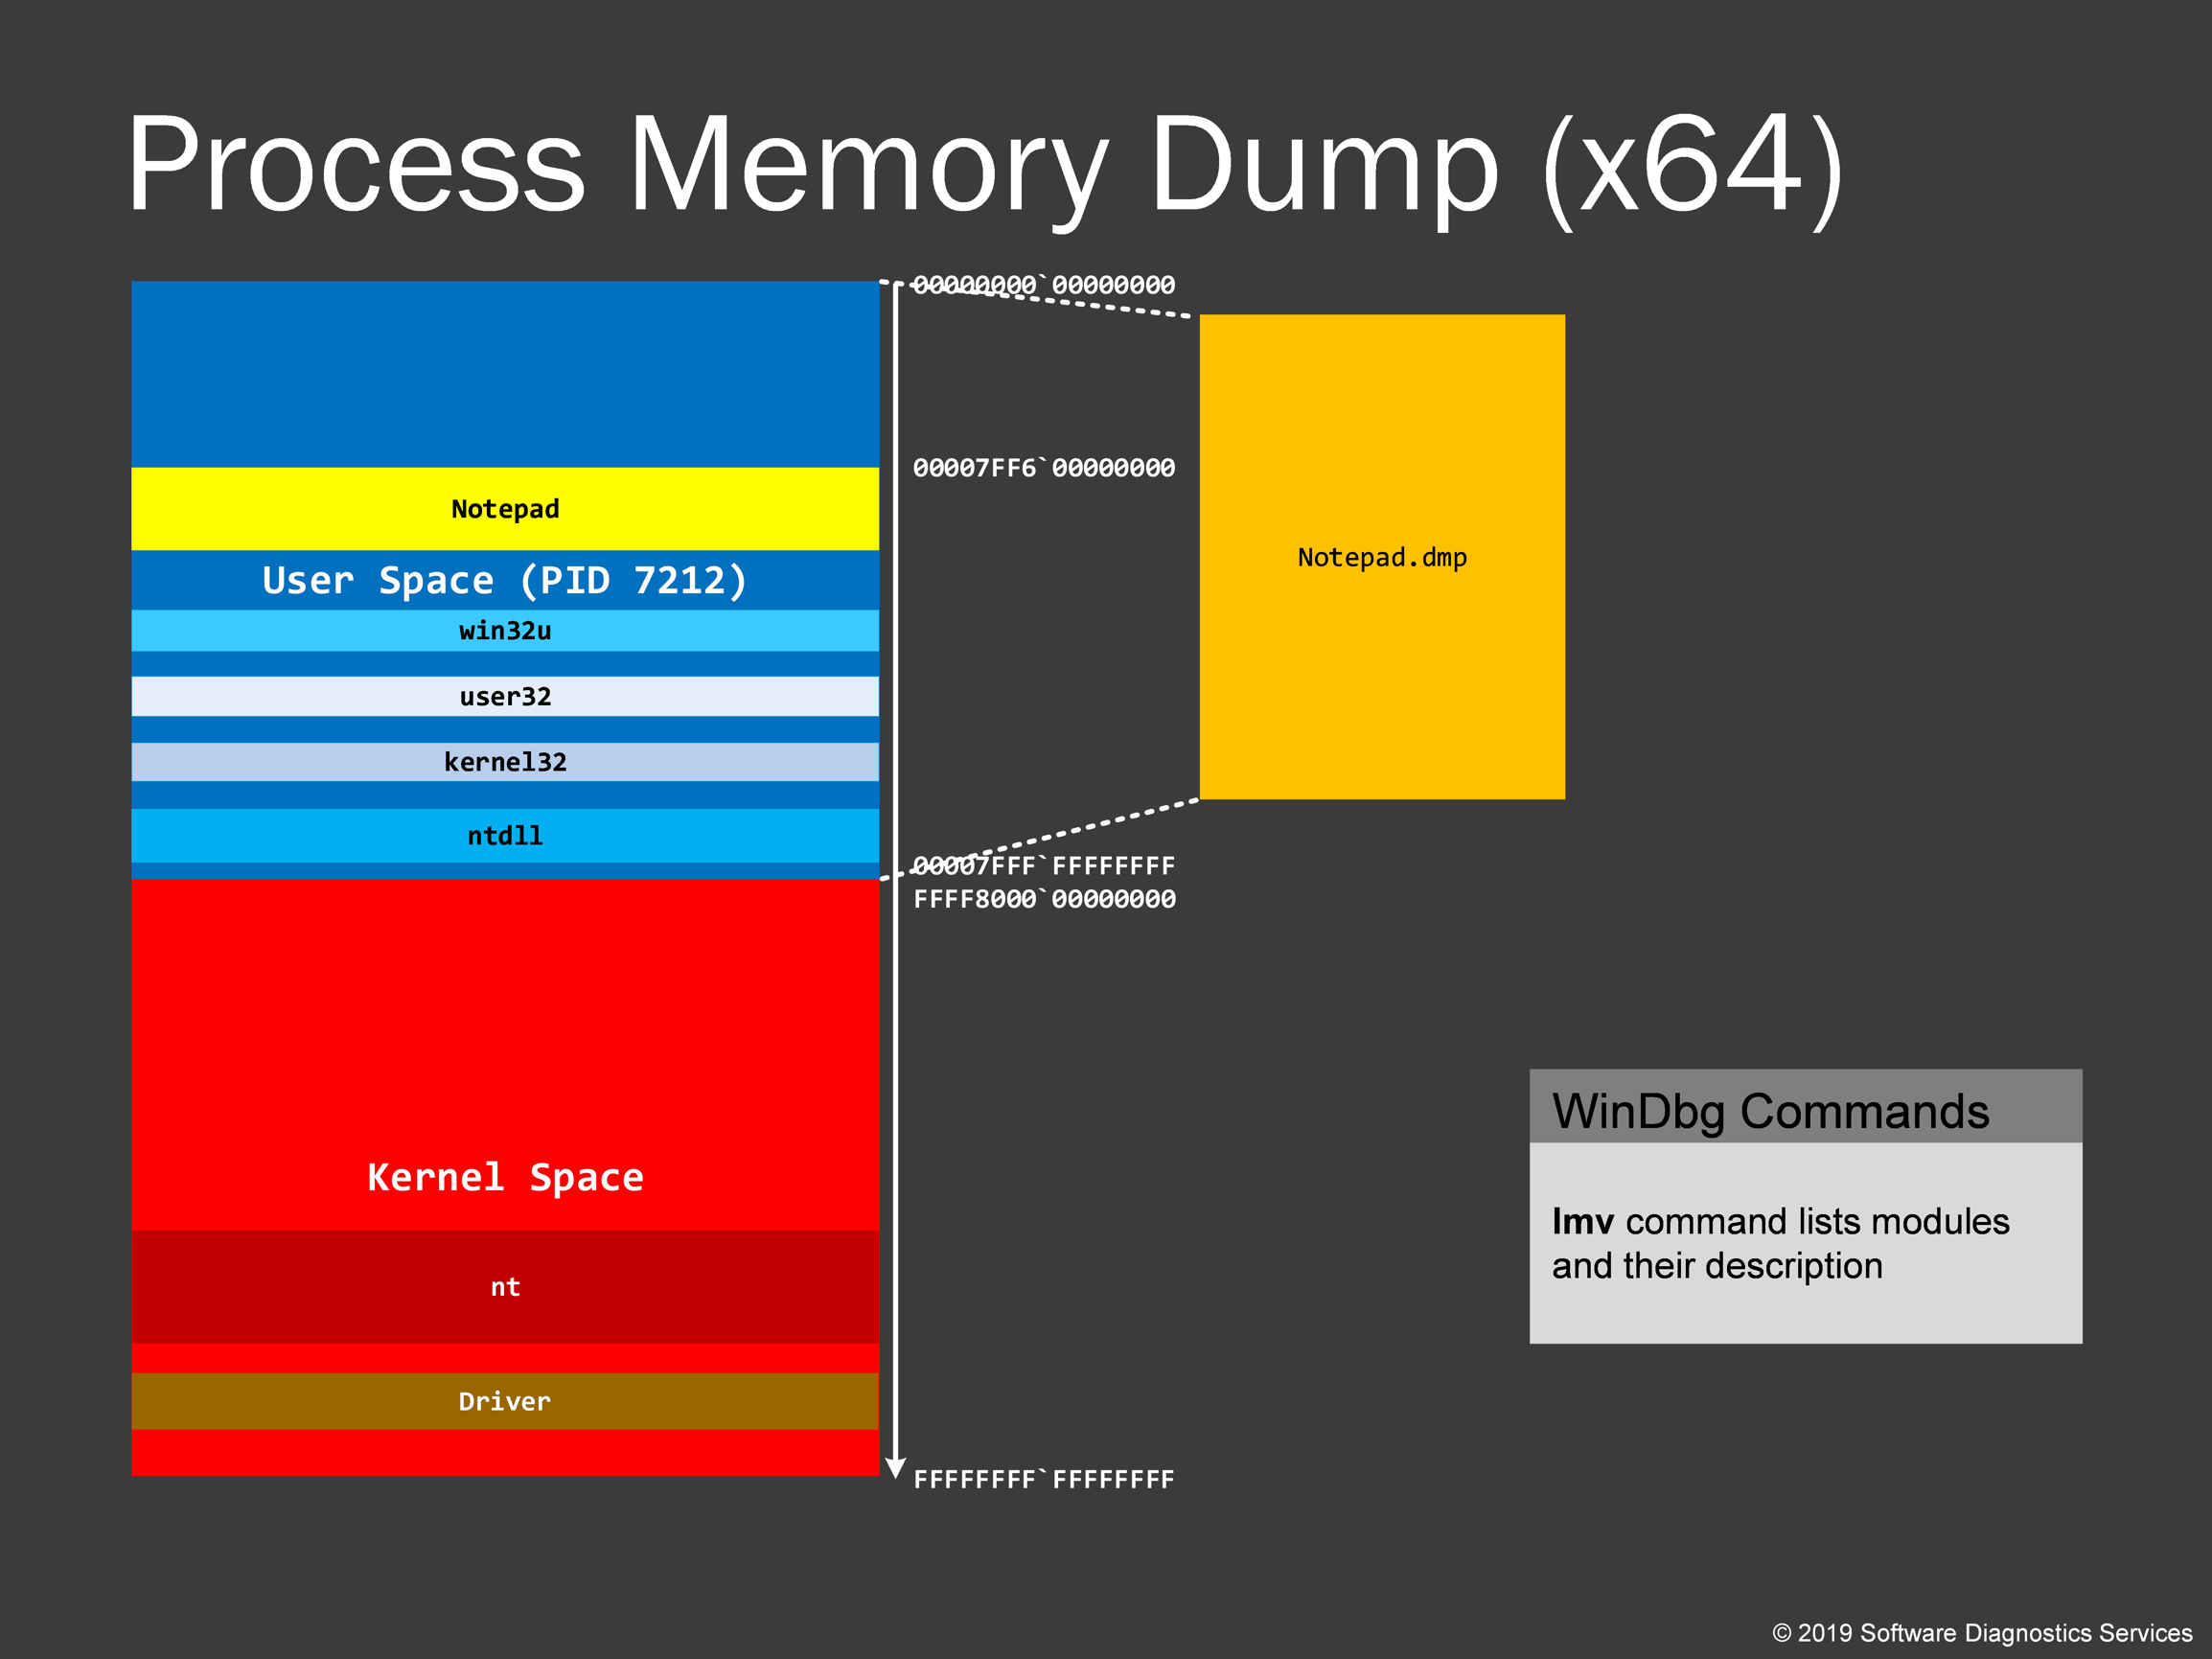
When we save a process memory dump, a user space portion of the application virtual process space is saved without any kernel virtual space stuff. However, we usually don’t see process memory dumps of several gigabytes in size unless we have memory leaks. This is because process space has gaps unfilled with modules and data. These unallocated parts are not saved in a memory dump. However, if some parts were paged out and reside in a page file, they are usually brought back before saving a memory dump. You may have noticed that sometimes when you save a dump file, for example, by using Task Manager, process memory consumption increases.
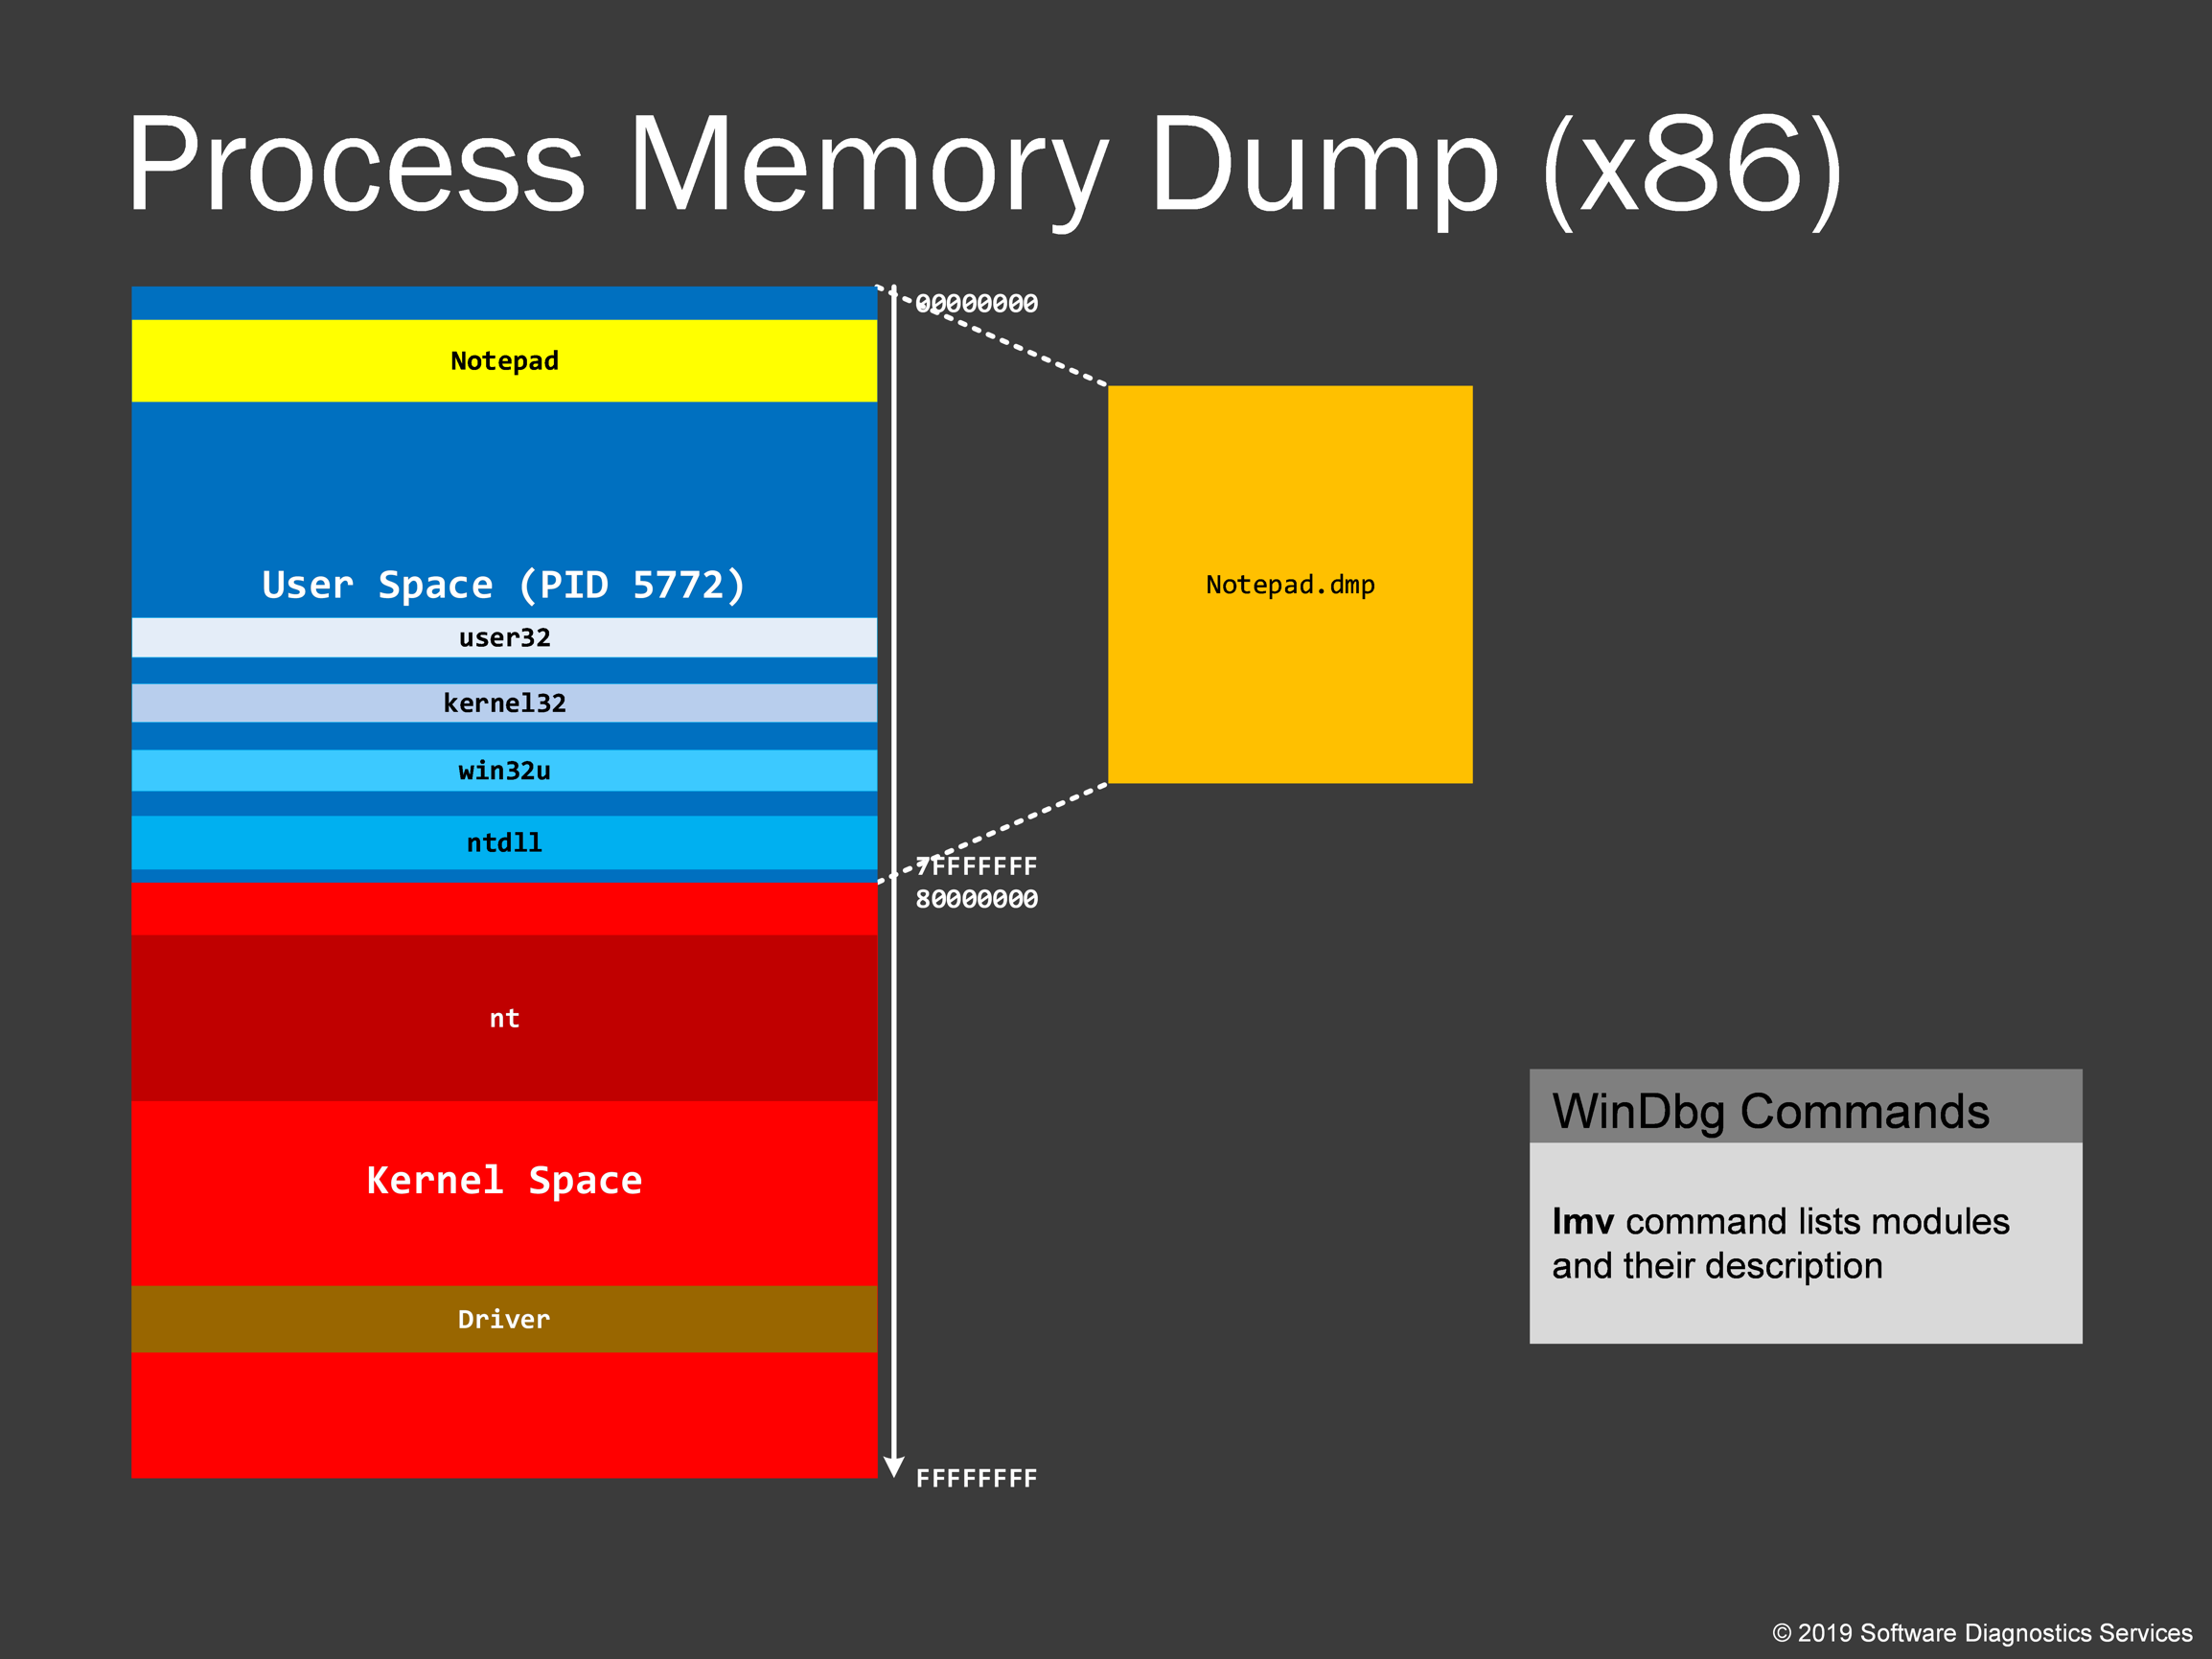
Process memory dumps from 32-bit Windows are usually smaller than their x64 counterparts, and, also, we usually don’t see 2 GB sizes unless we have memory leaks.
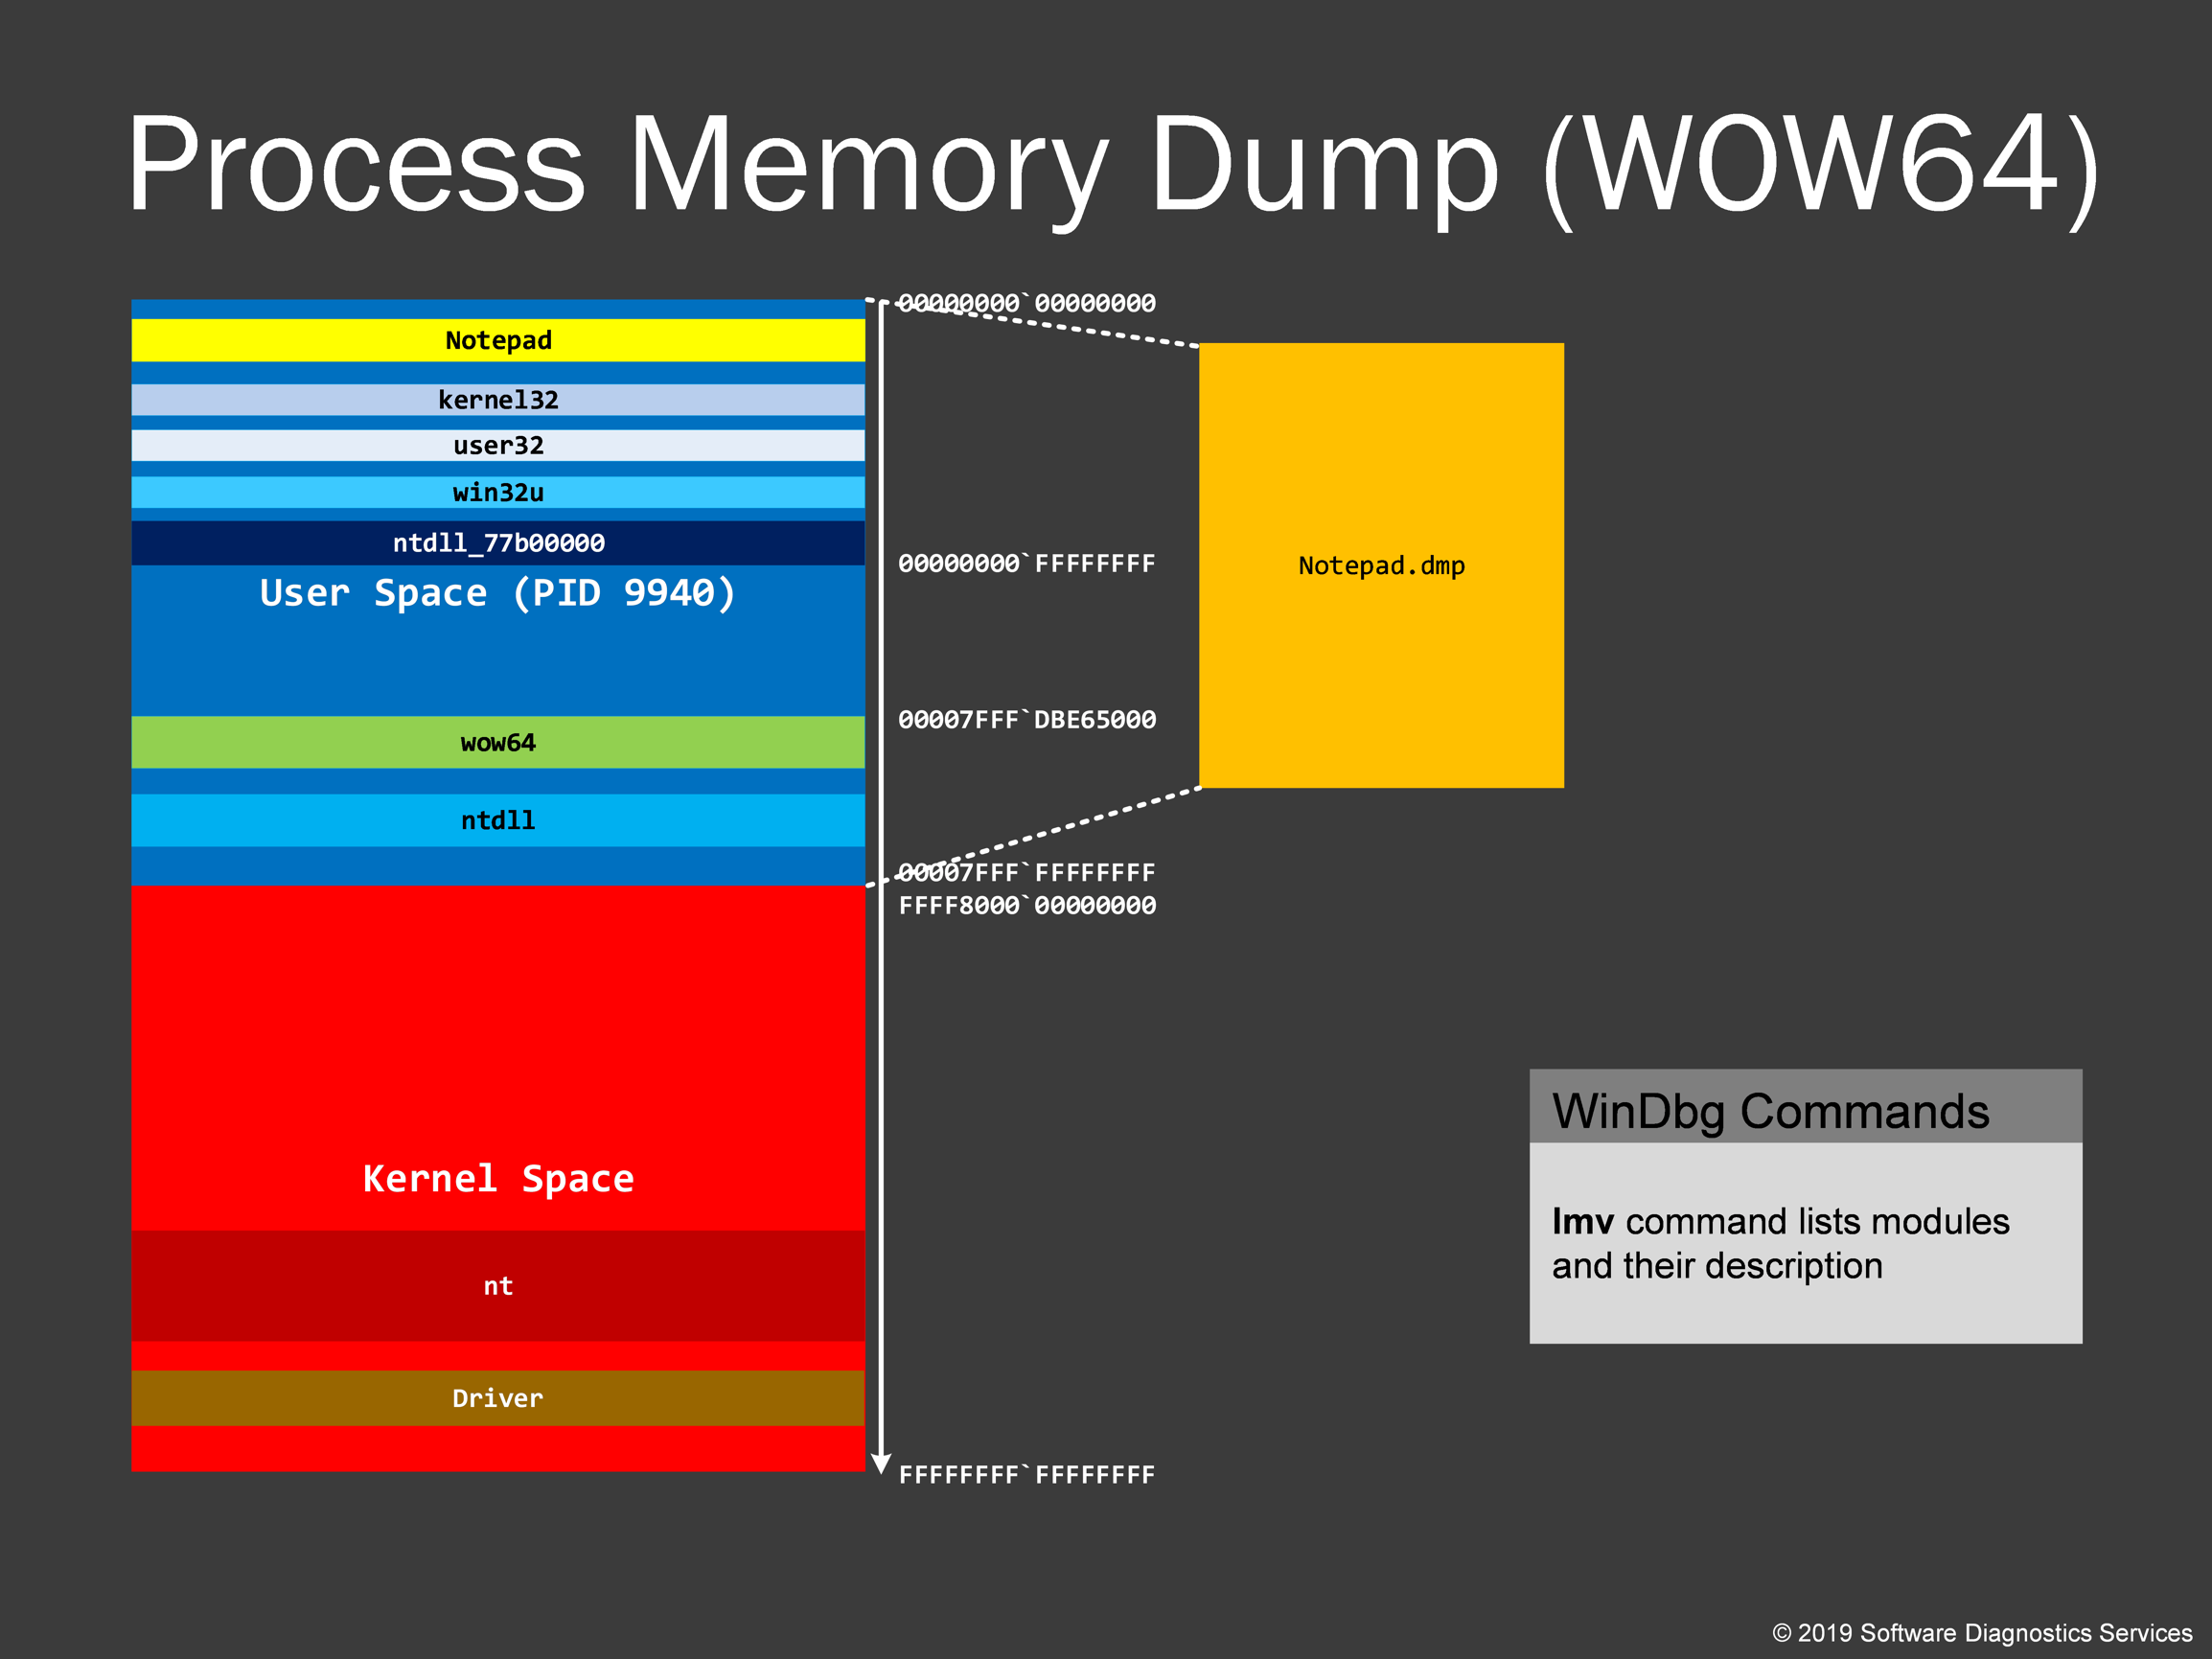
On x64 Windows, 32-bit applications are executed as 64-bit processes (the so-called WOW64). Therefore, the default 64-bit Task Manager saves them as 64-bit process memory dumps. The virtual memory layout is mostly the same as for 32-bit memory dumps except that it also includes some 64-bit modules.
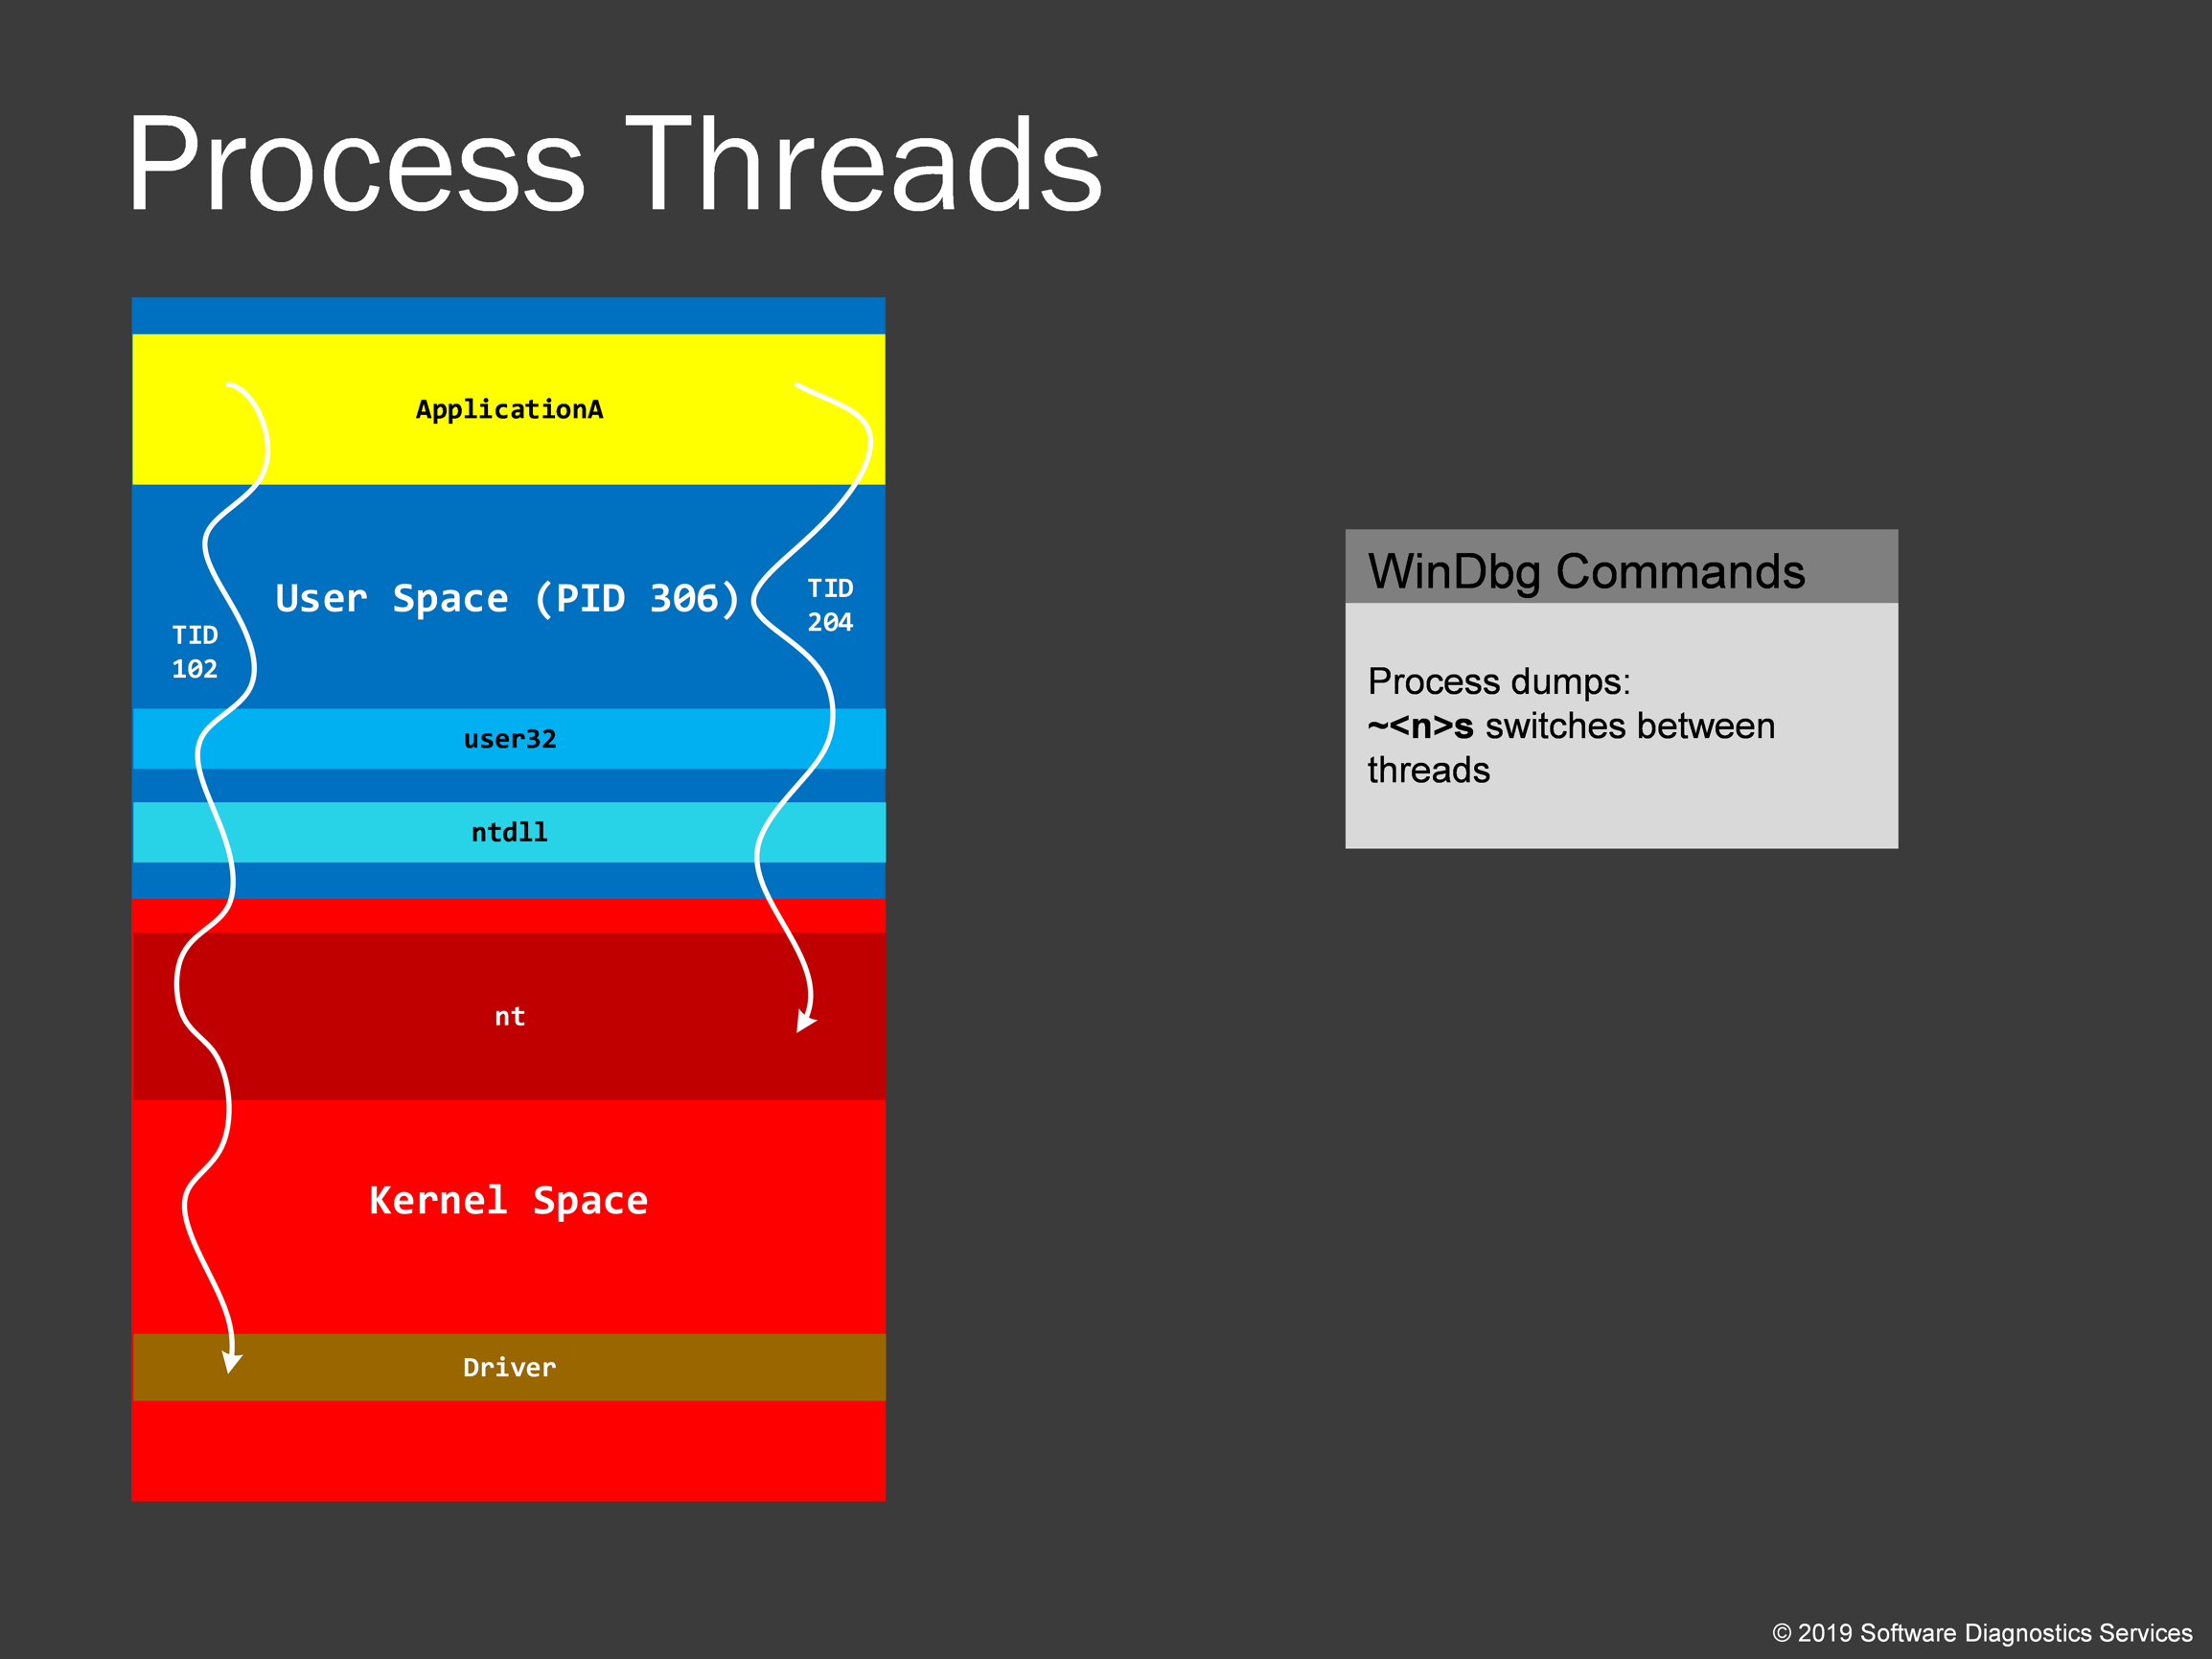
Now we come to another important fundamental concept in Windows memory dump analysis: thread. It is basically a unit of execution, and there can be many threads in a given process. Every thread just executes some code and performs various tasks, for example, in Internet Explorer, one thread can download a page, another responds to parse JavaScript on a different page, and yet other threads can support Java or .NET virtual machine and execute graphics code. Every thread has its ID. In this training, we also learn how to navigate between process threads. They are called process threads because they originate in user space.
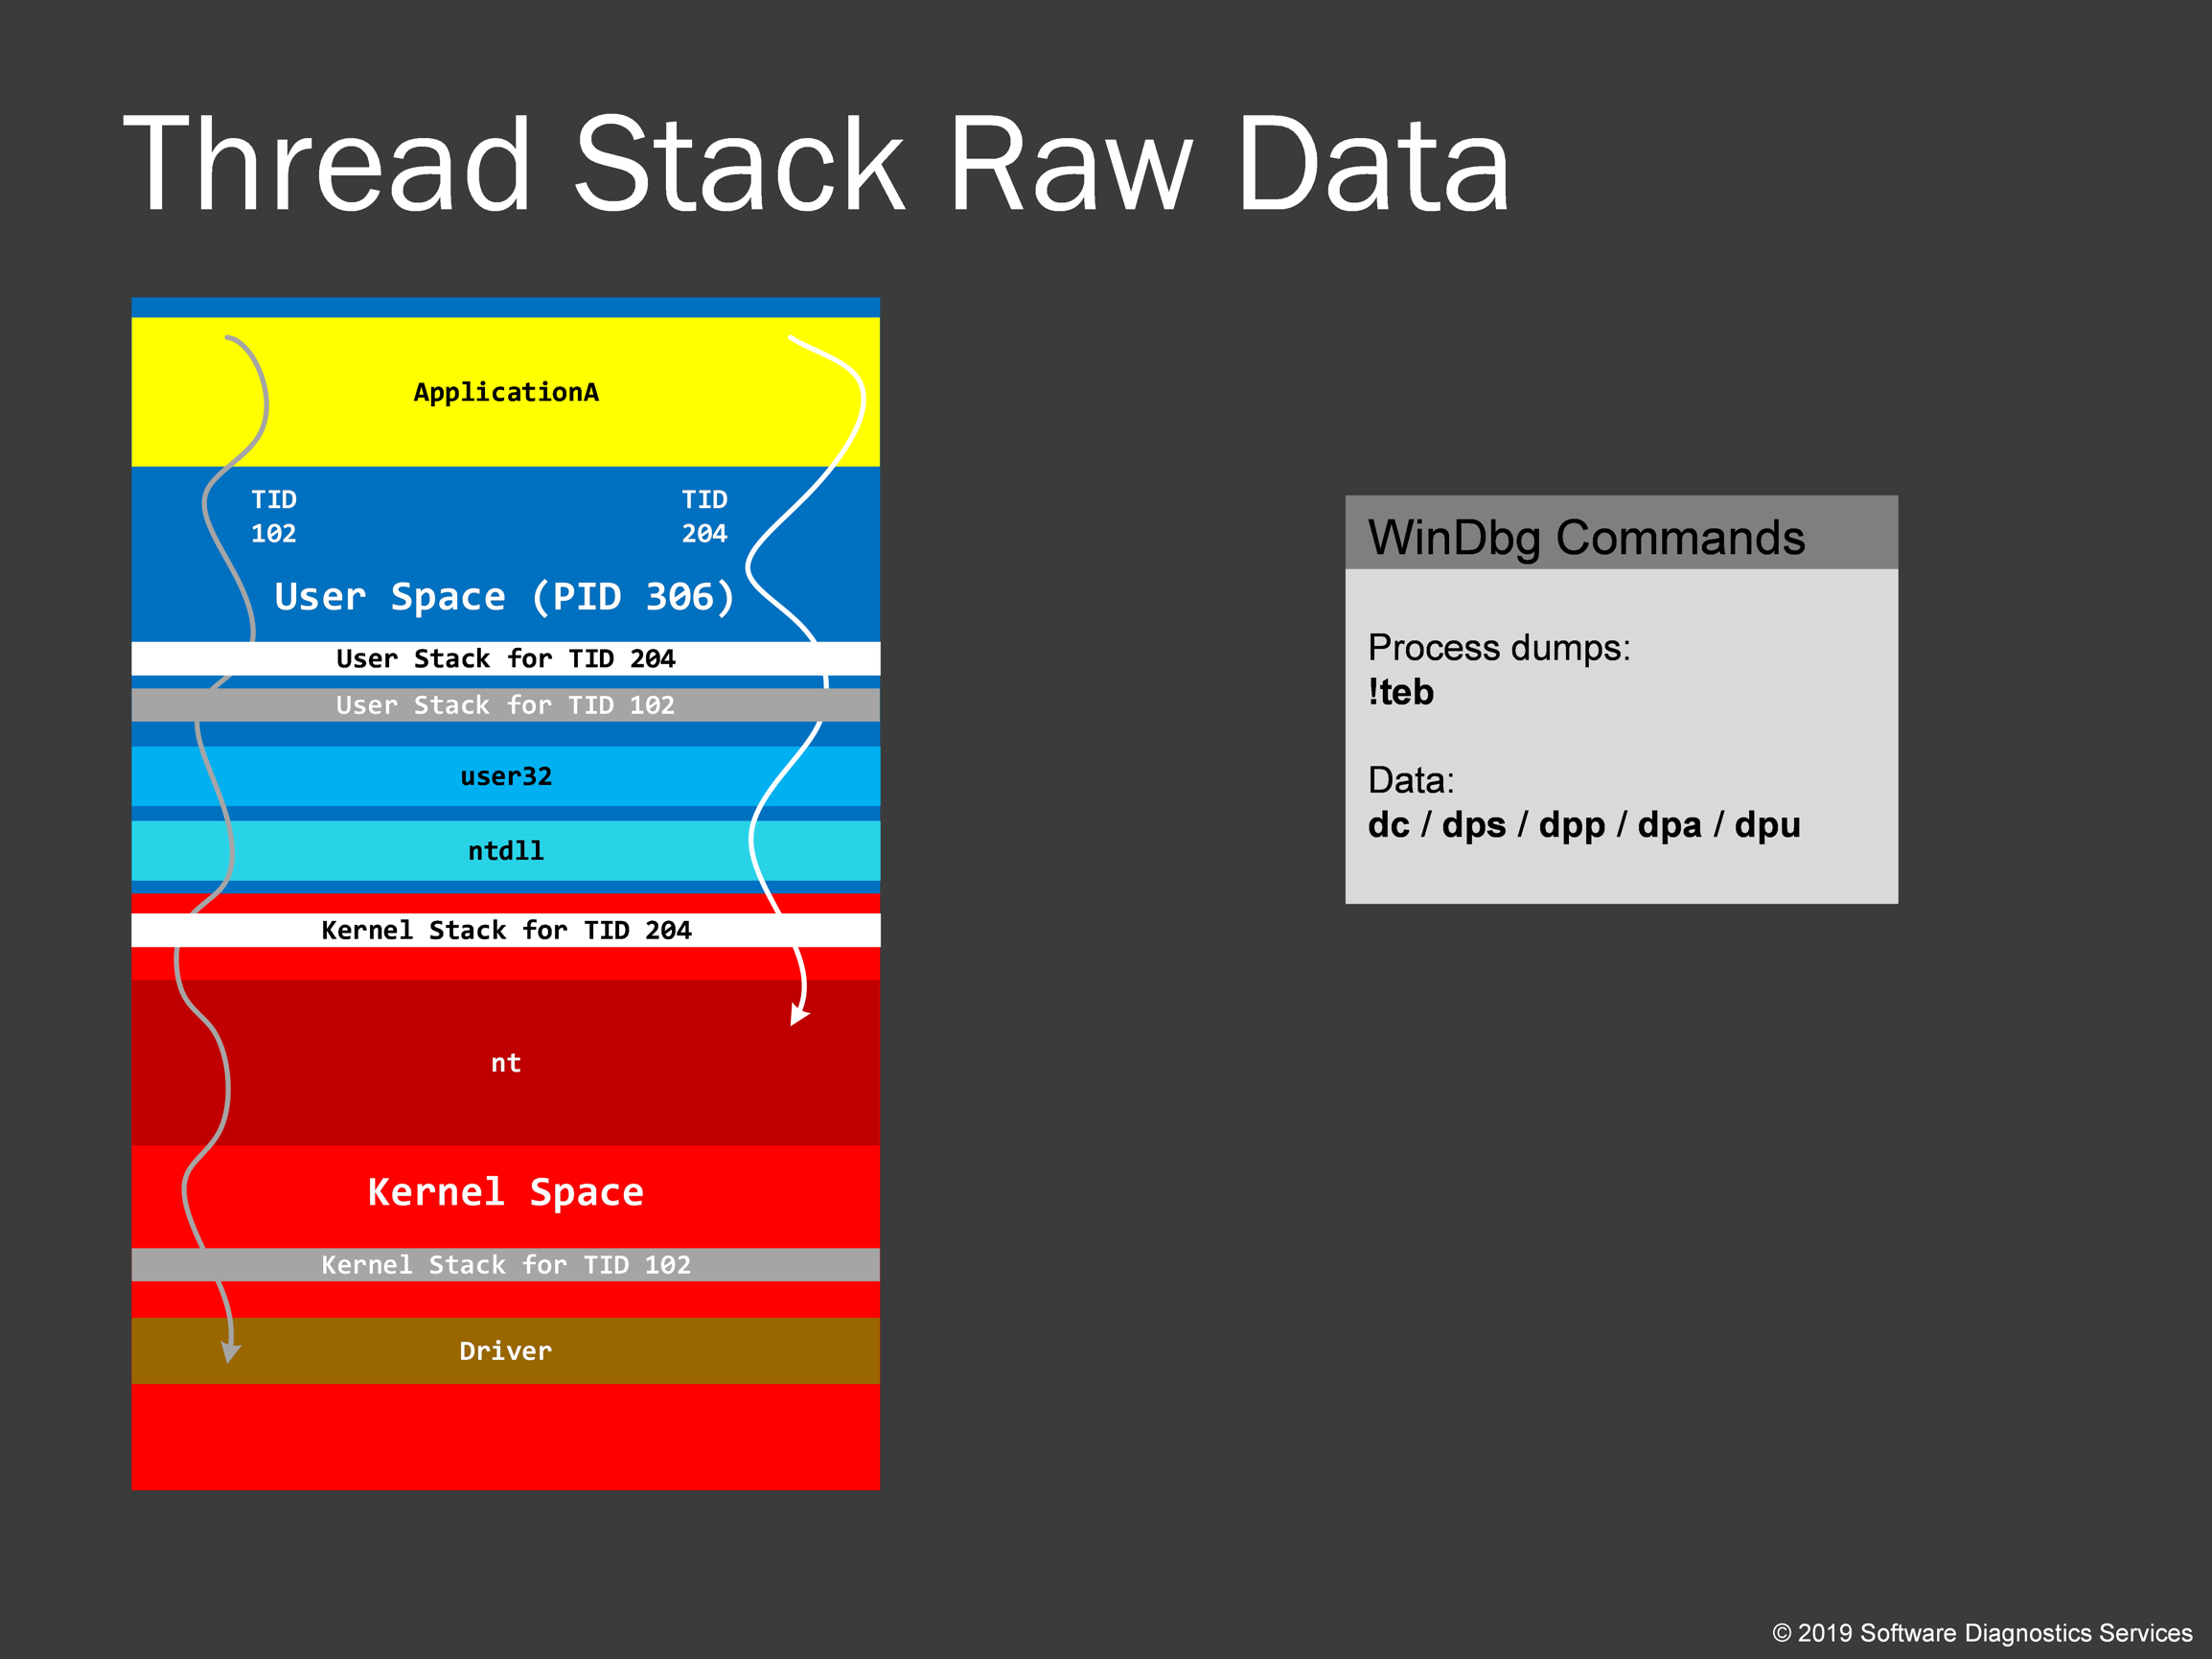
Every thread needs a temporary memory region to store its execution history and temporary data. This region is called a thread stack. To avoid conflict, OS designers split thread stack into 2 parts: user and kernel. In the picture, you see them for both threads with TID 102 and 204. Please note that stack region is just any other memory region, and you can use any WinDbg data dumping commands there. We will also learn how to get thread stack region address range. Examining raw stack data can give some hints to the past system behavior: the so-called Execution Residue pattern.
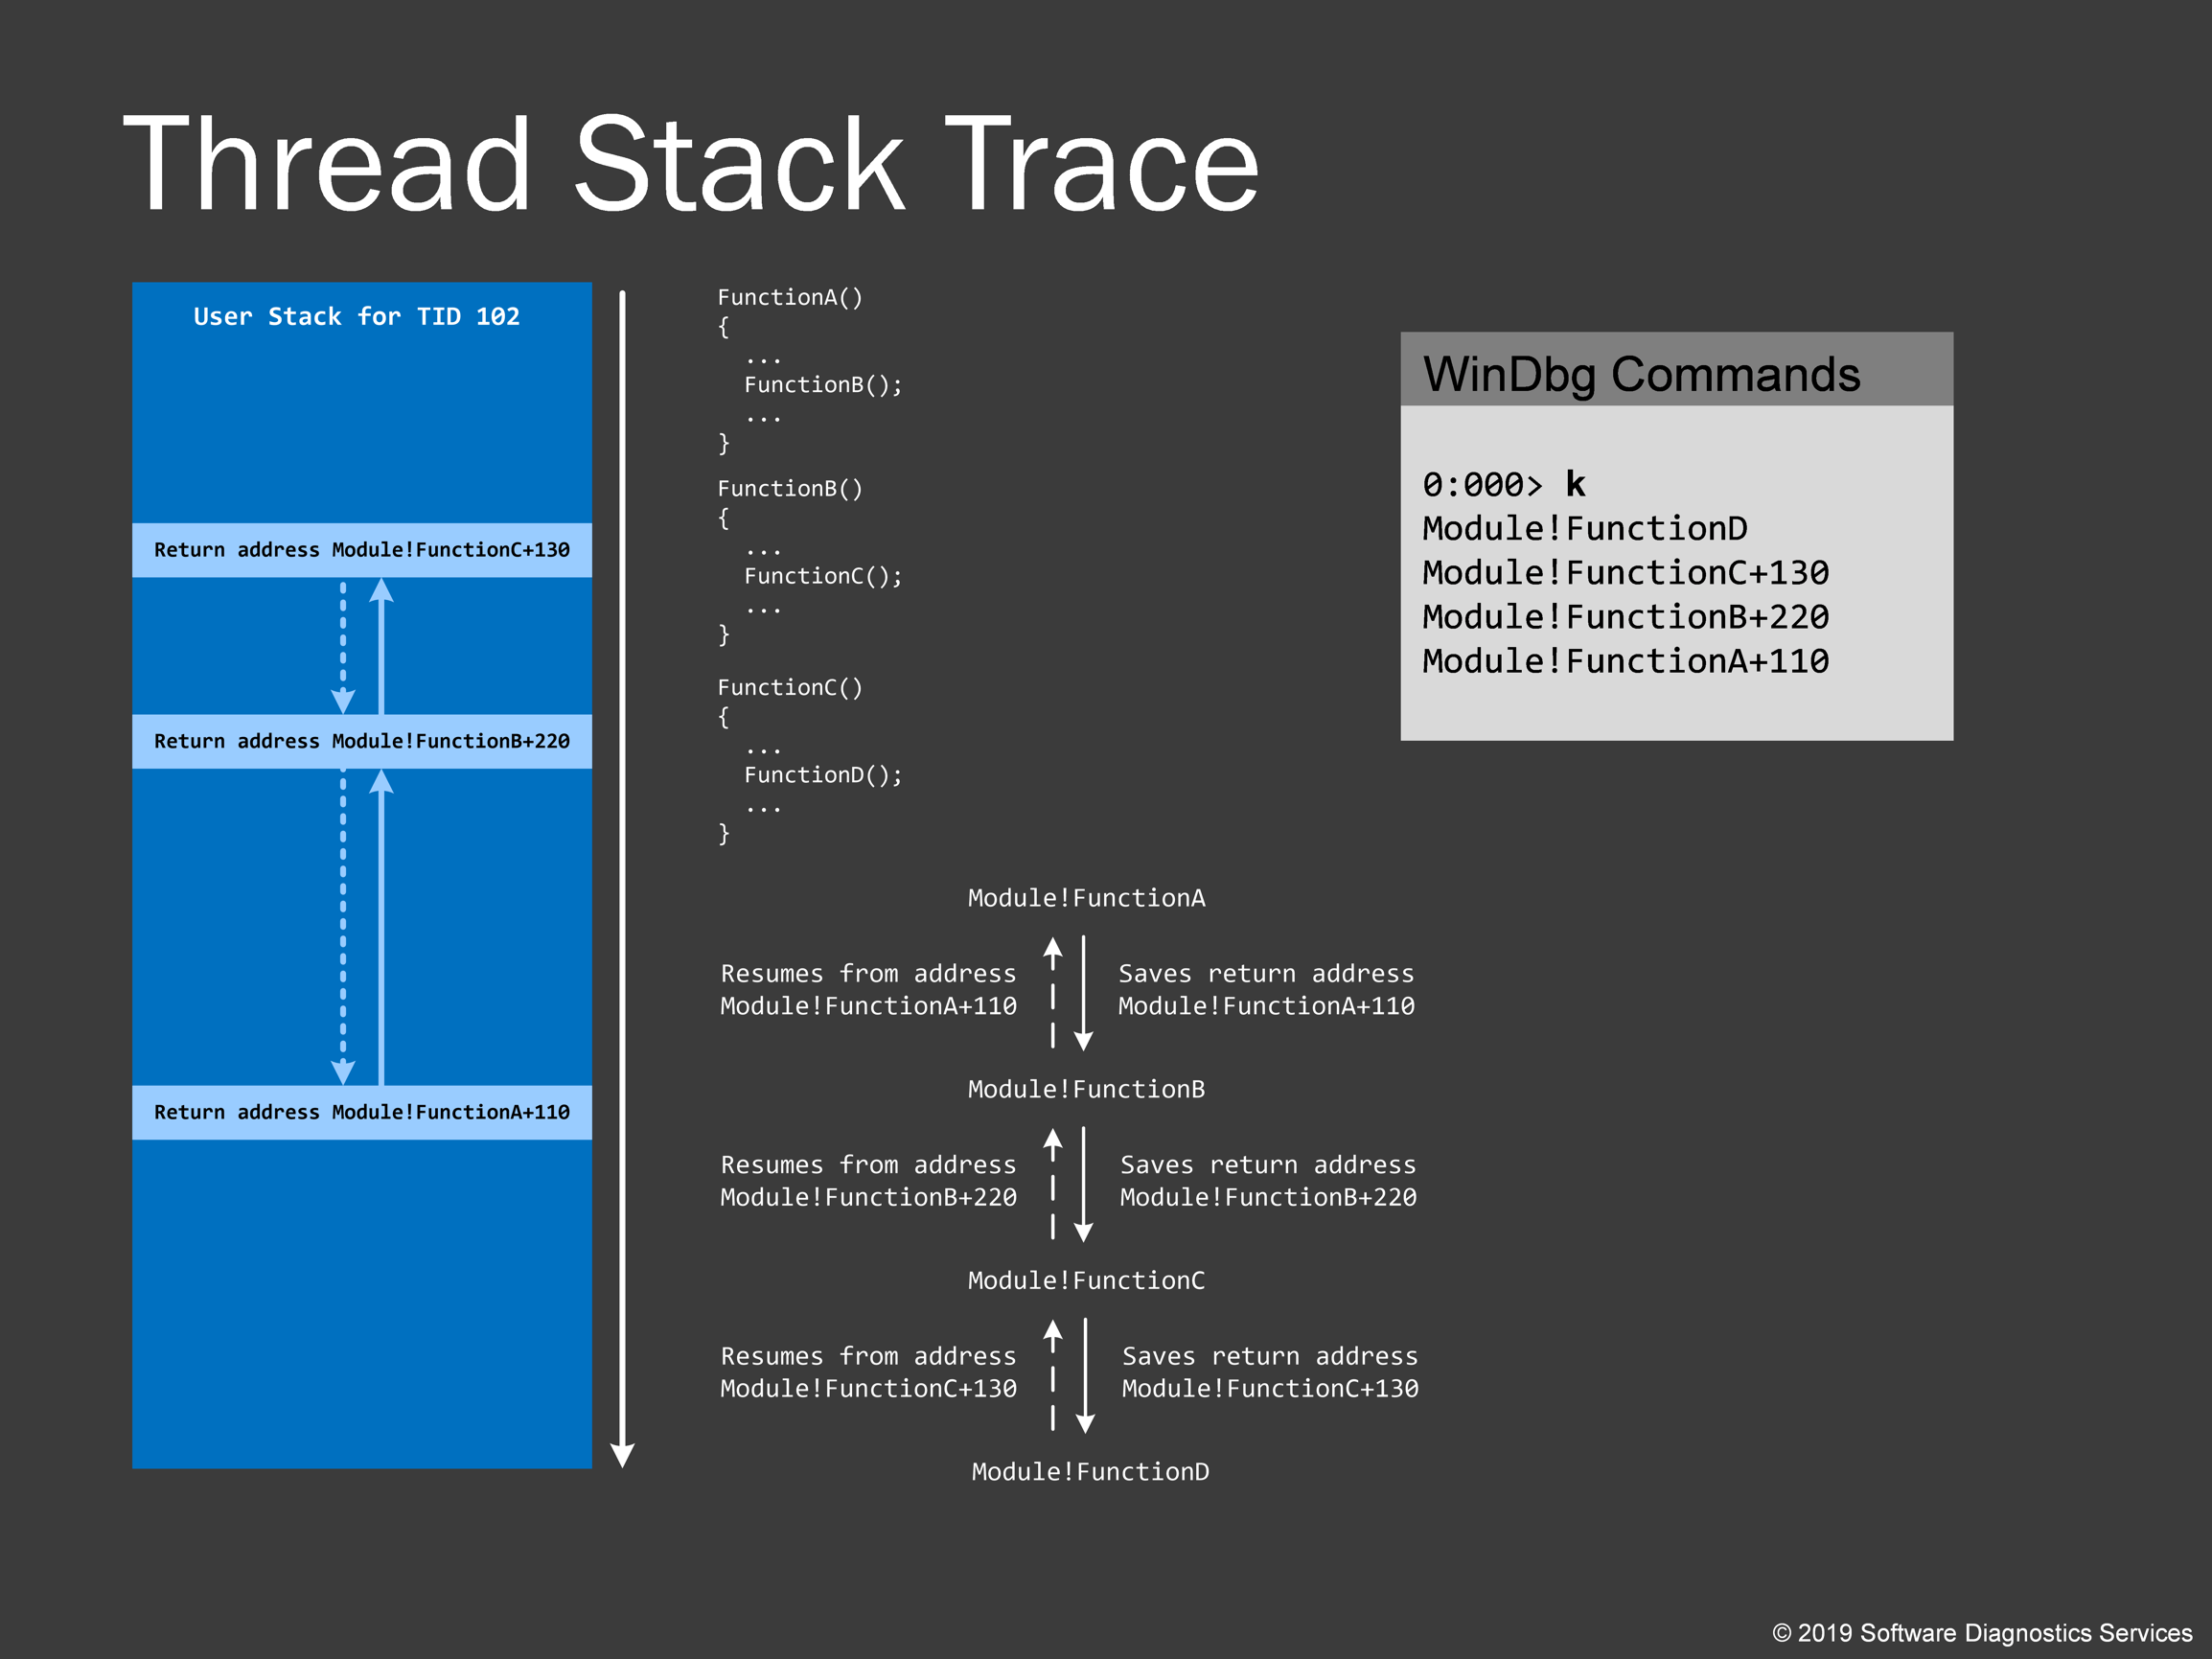
Now we explain thread stack traces. Suppose we have source code where FunctionA calls FunctionB at some point and FunctionB calls FunctionC and so on. This is a thread of execution. If FunctionA calls FunctionB, you expect the execution thread to return to the same place where it left and then resume from there. This is achieved by saving a return address in the thread stack region. So every return address is saved and then restored during the course of thread execution. Although the memory addresses grow from top to bottom on this picture, return addresses are saved from bottom to top. This might seem counter-intuitive to all previous pictures, but this is how you would see the output from WinDbg commands. What WinDbg does when you instruct it to dump a stack trace from a given thread is to analyze thread raw stack data and figure out return addresses, map them to symbolic form according to symbol files and show them from top to bottom. Note that FunctionD is not present in the raw stack data on the left because the thread is currently executing the function FunctionD called from FunctionC. However, FunctionC called FunctionD, and the return address of FunctionC was saved. In the gray box on the right, we see the results of the WinDbg command.
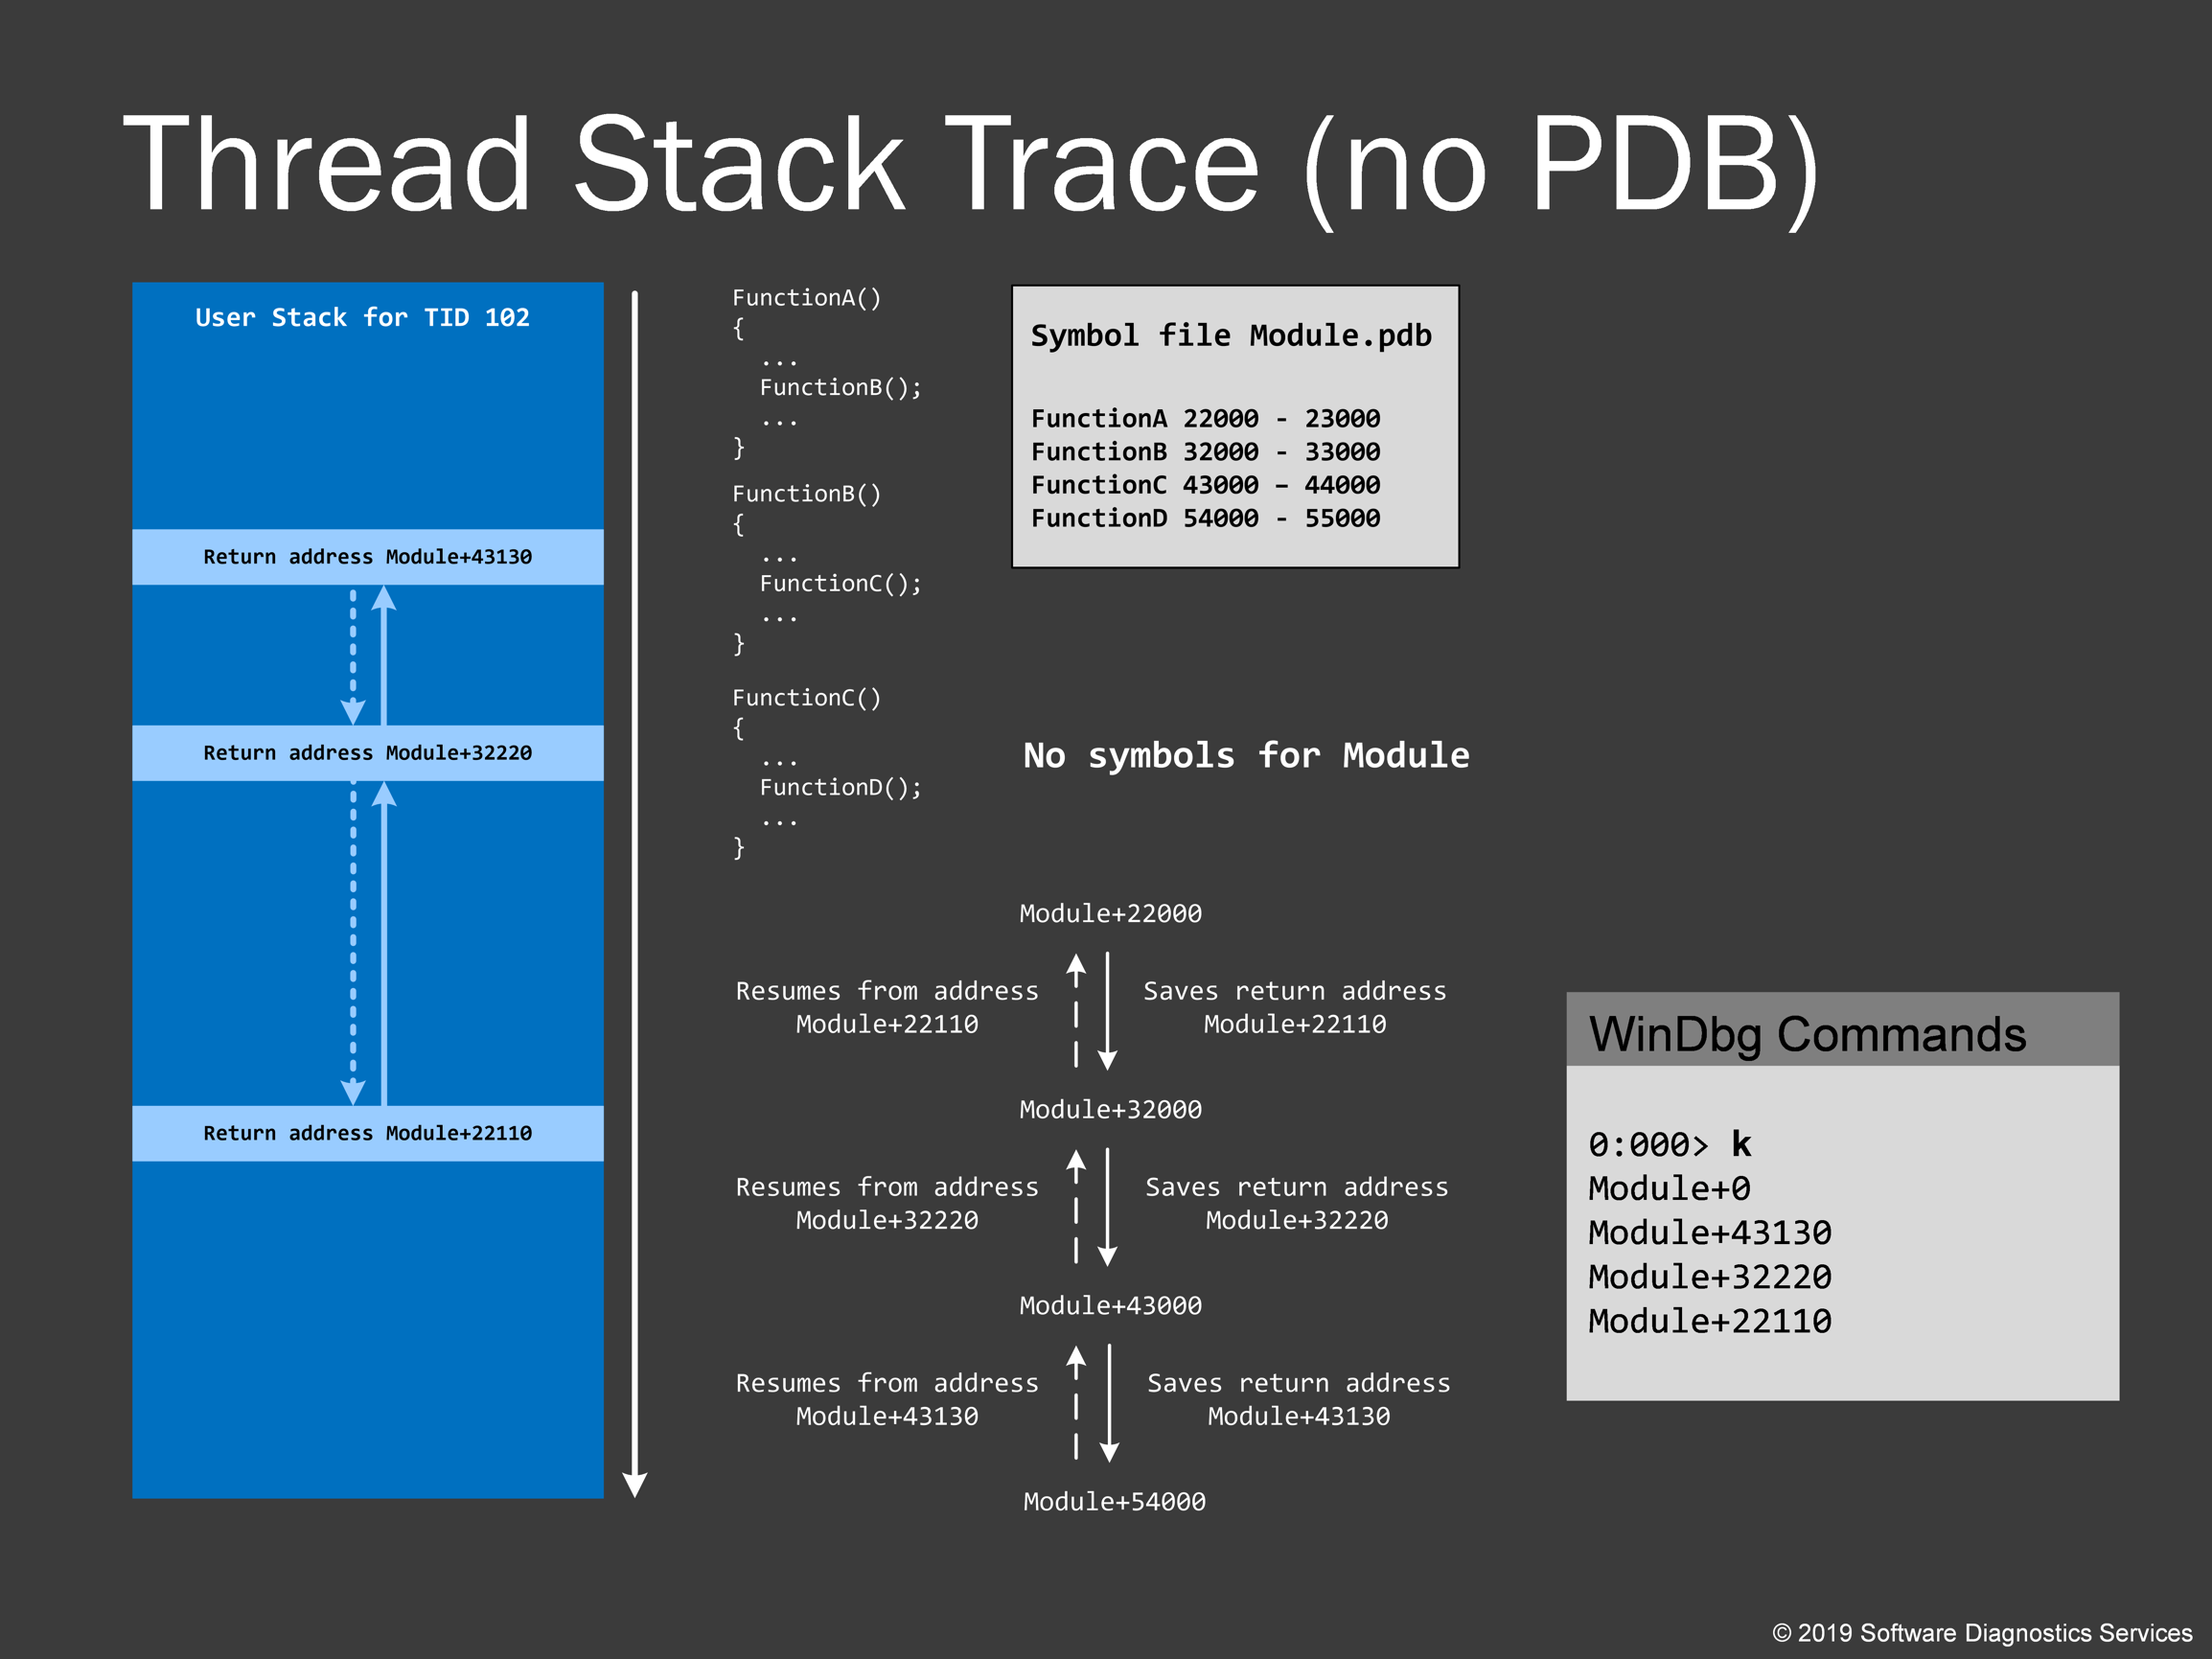
Here I’d like to show you why symbol files are important and what stack traces you get without them. Symbol files just provide mappings between memory address ranges and associated symbols like a table of contents in a book. So in the absence of symbols, we are left with bare module names that are saved in a dump. Dumps with .NET code are much better because .NET assembly modules usually include full code description inside.
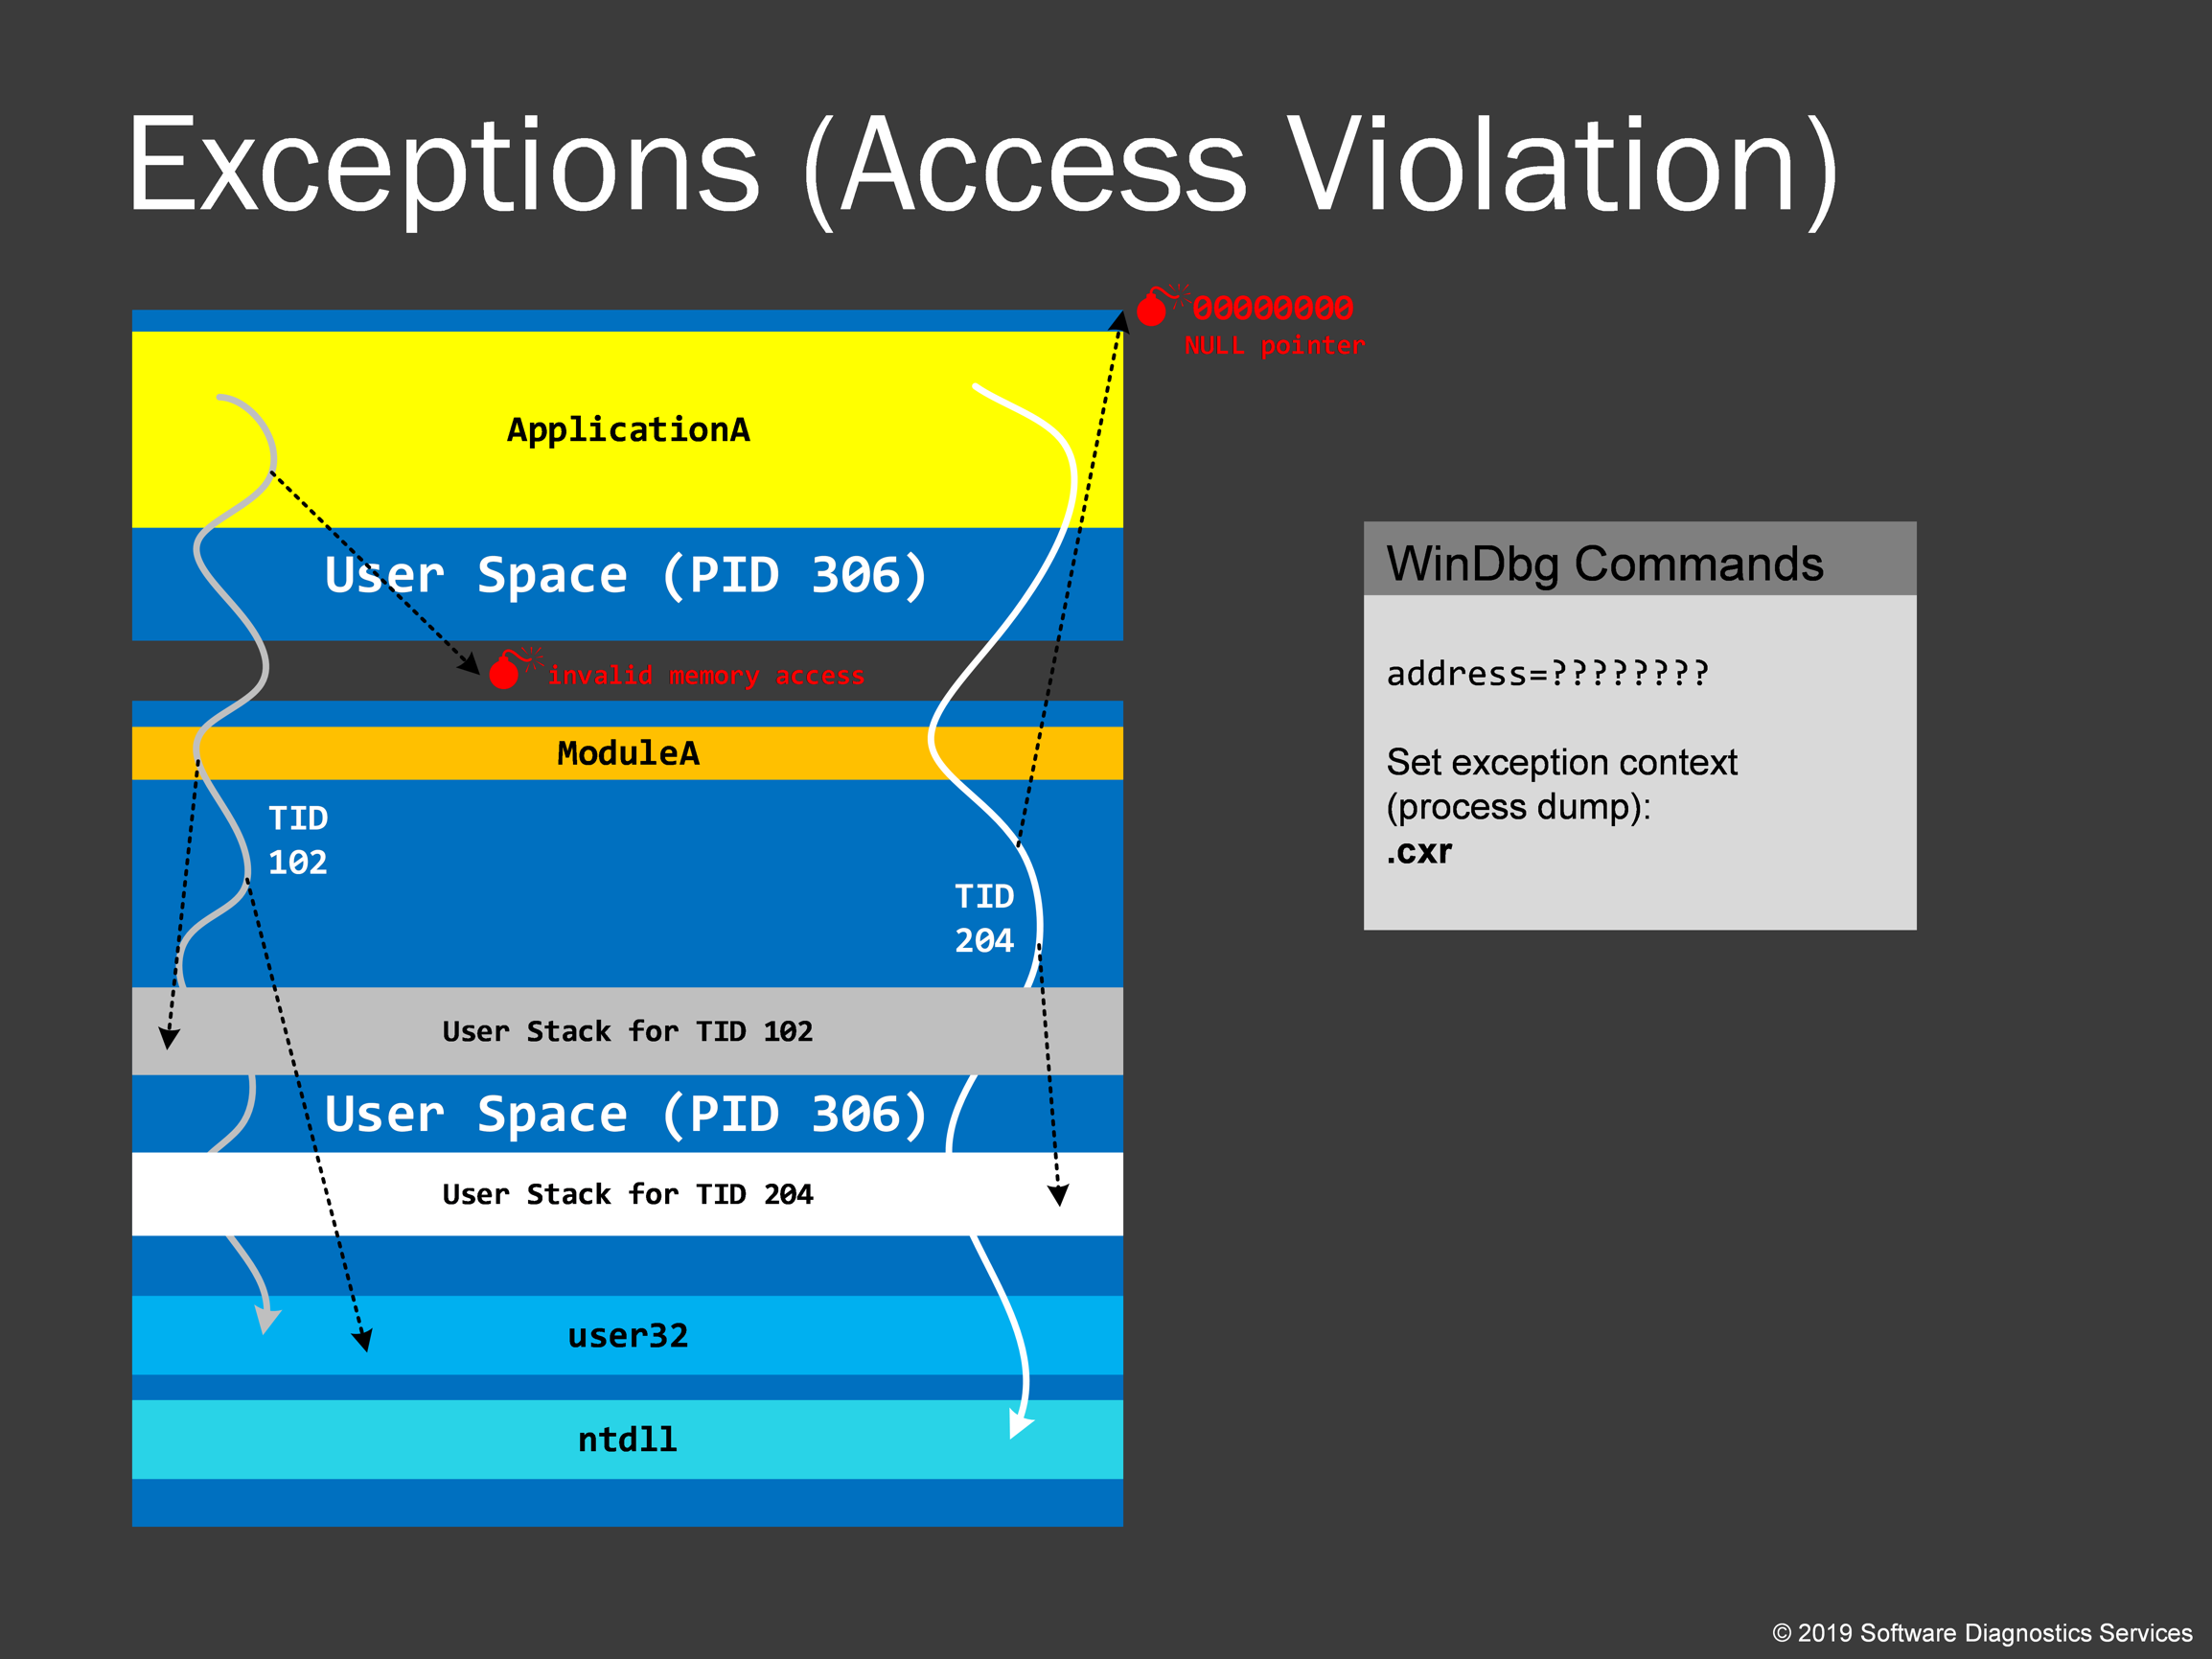
Now we talk about access violation exceptions. During thread execution, it accesses various memory addresses doing reads and writes. Sometimes the memory is not present due to gaps in virtual address space or different protection levels like read-only or no execute memory regions. If a thread tries to violate that we get an exception, or it is often called fault or trap in kernel space. OS stores an exception context and transfers execution to exception processing code. In practical exercises, we would see how to recover that information because WinDbg is just a tool with its own assumptions and often is wrong in its conclusions when you just execute the default analysis command !analyze –v. A typical example is a page fault when a driver tries to access memory, which resides in a page file. Then OS brings that page to memory and restarts that processor instruction. However, in some situations, it is considered invalid to access such paged out memory, and we have a bugcheck, and a kernel memory dump is saved that allows us to find the driver name and its functions. Certain regions are forbidden to read and write such as near-zero addresses. If we have access violation there, then it is called NULL pointer access. Note that every thread can have an exception, and it often happens that there are multiple exceptions stored in a dump file. It is also sometimes the case that the code can catch these exceptions preventing a user from seeing error messages. Such exceptions can contribute to corruption, and we call then Hidden Exceptions, and we also learn how to recognize them in a dump file.
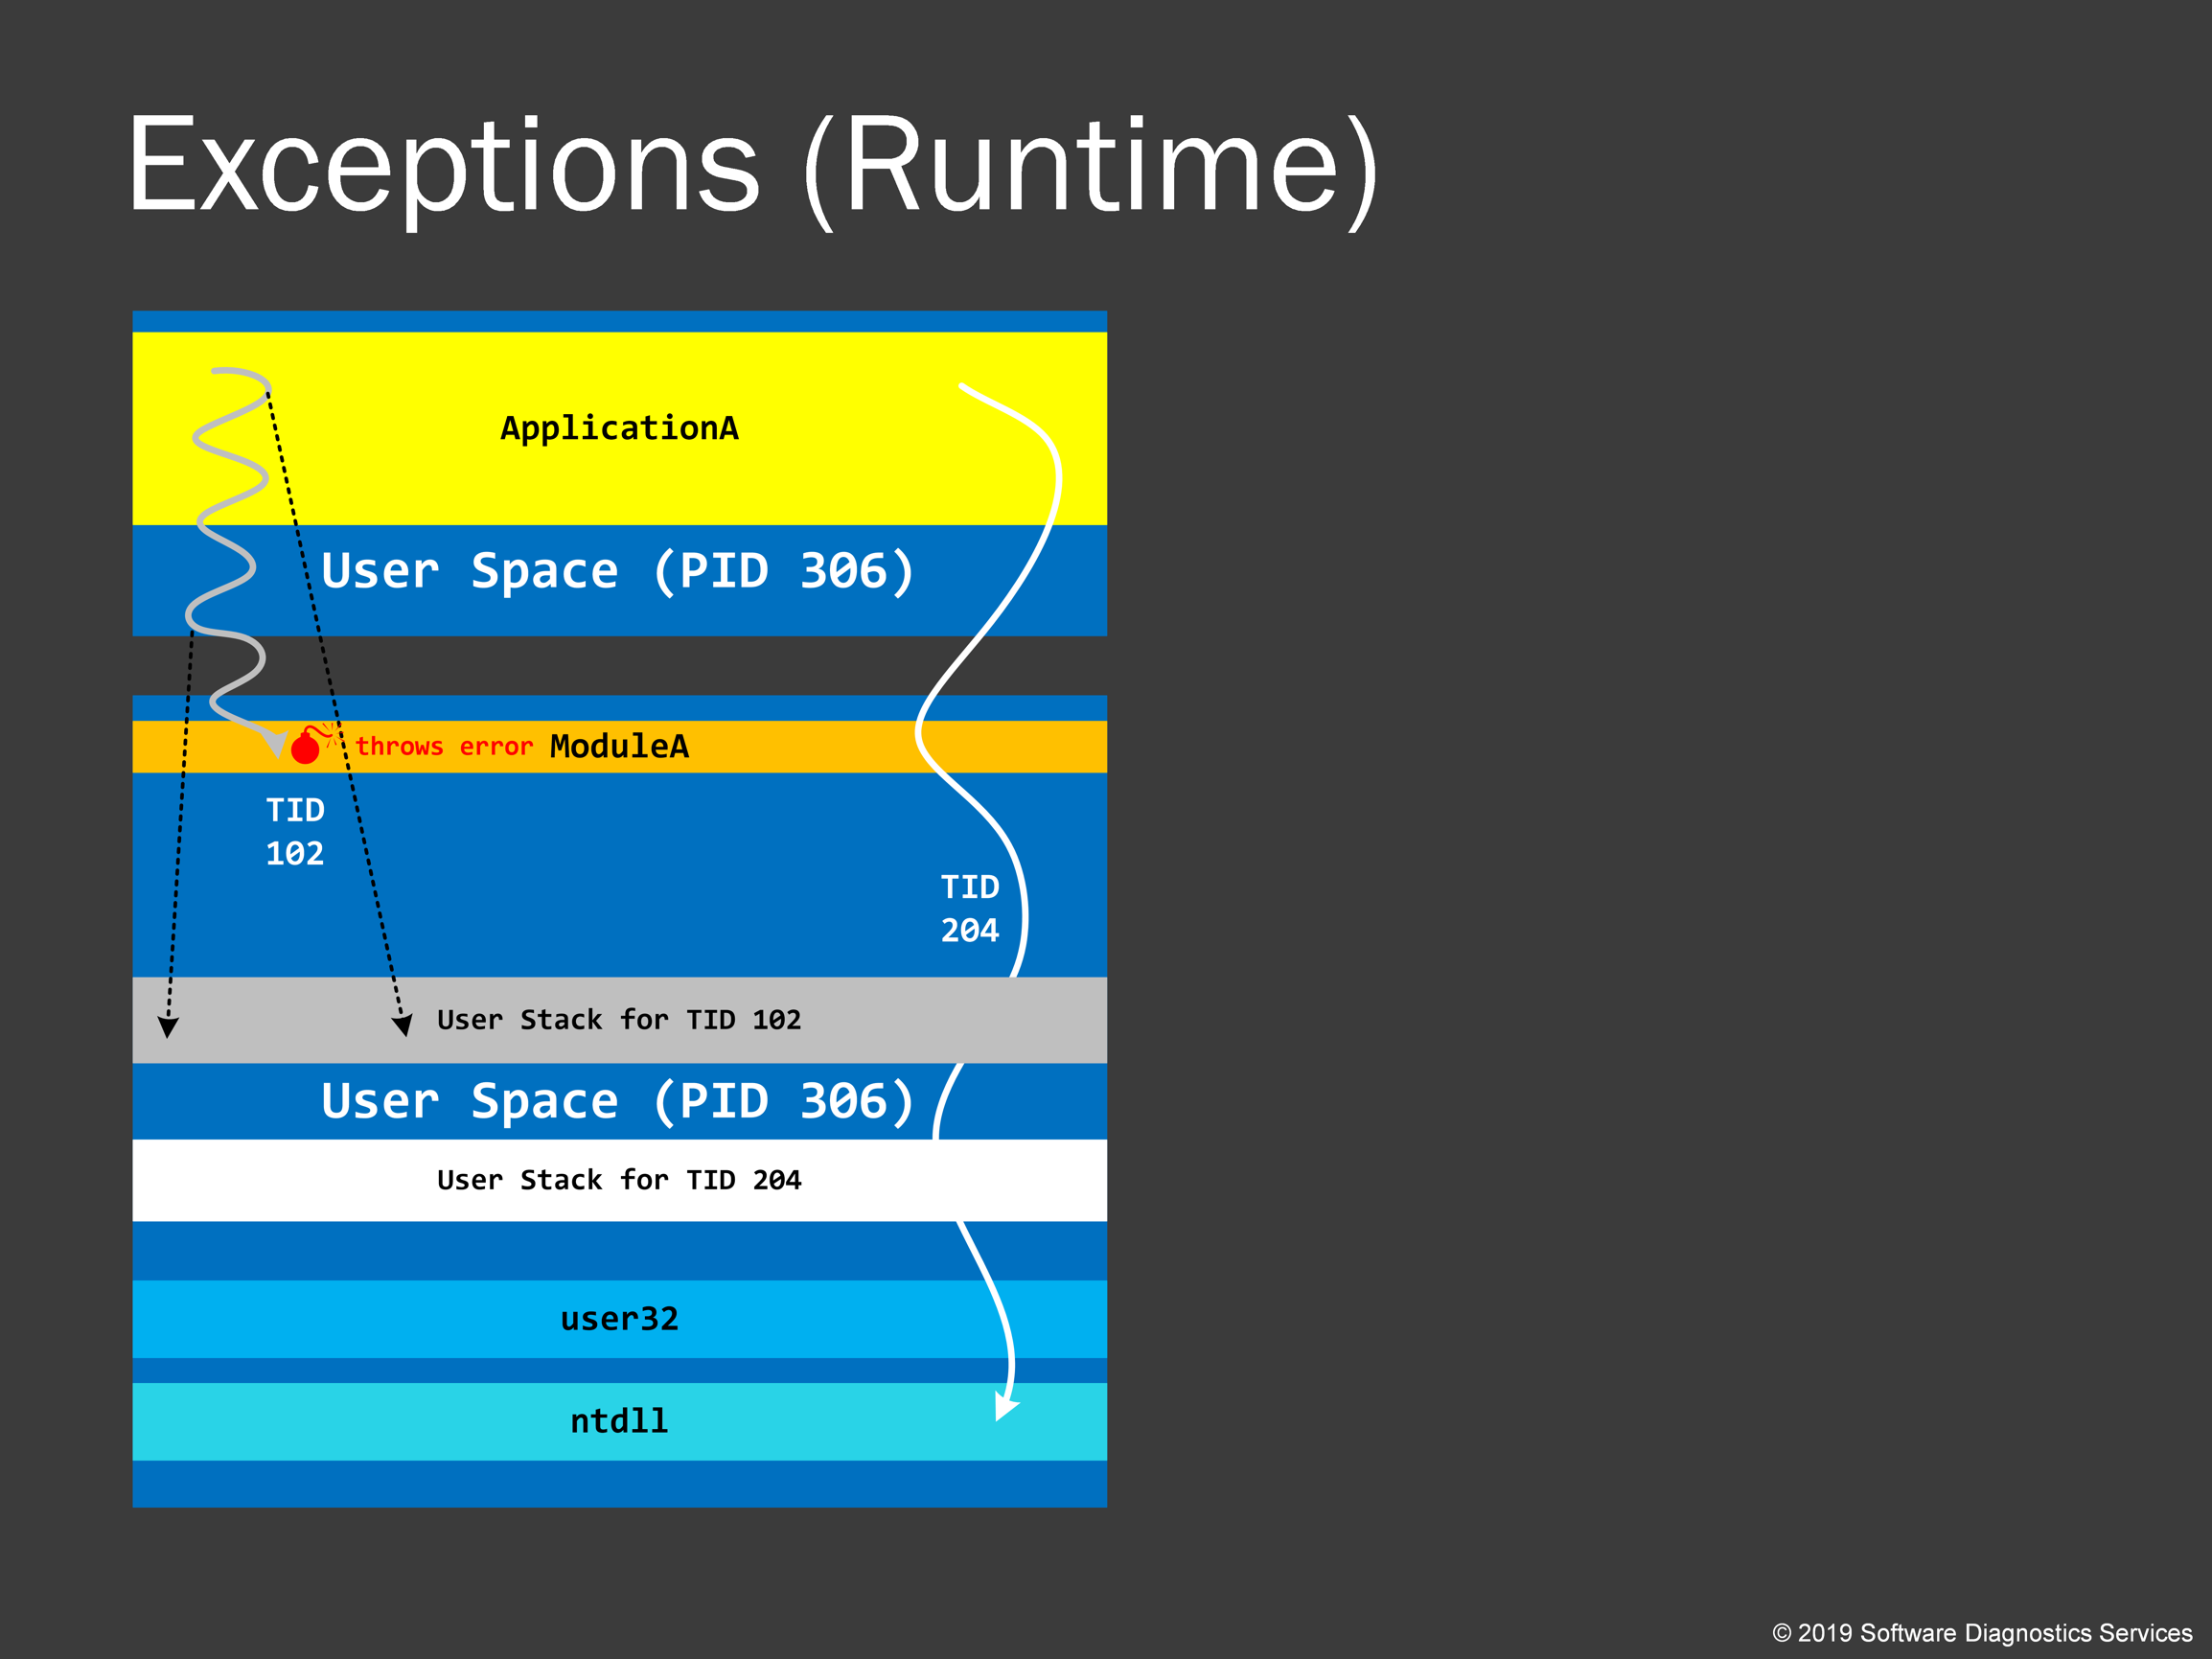
However, not all exceptions happen from invalid access. Many exceptions are generated by the code itself when it checks for some condition, and it is not satisfied, for example, when a code checks a buffer or an array to verify whether it is full before trying to add data. If it finds that it is already full, the code throws an exception. We would see that in one of our practice examples, when C++ code throws a C++ exception. Such exceptions are usually called runtime exceptions.
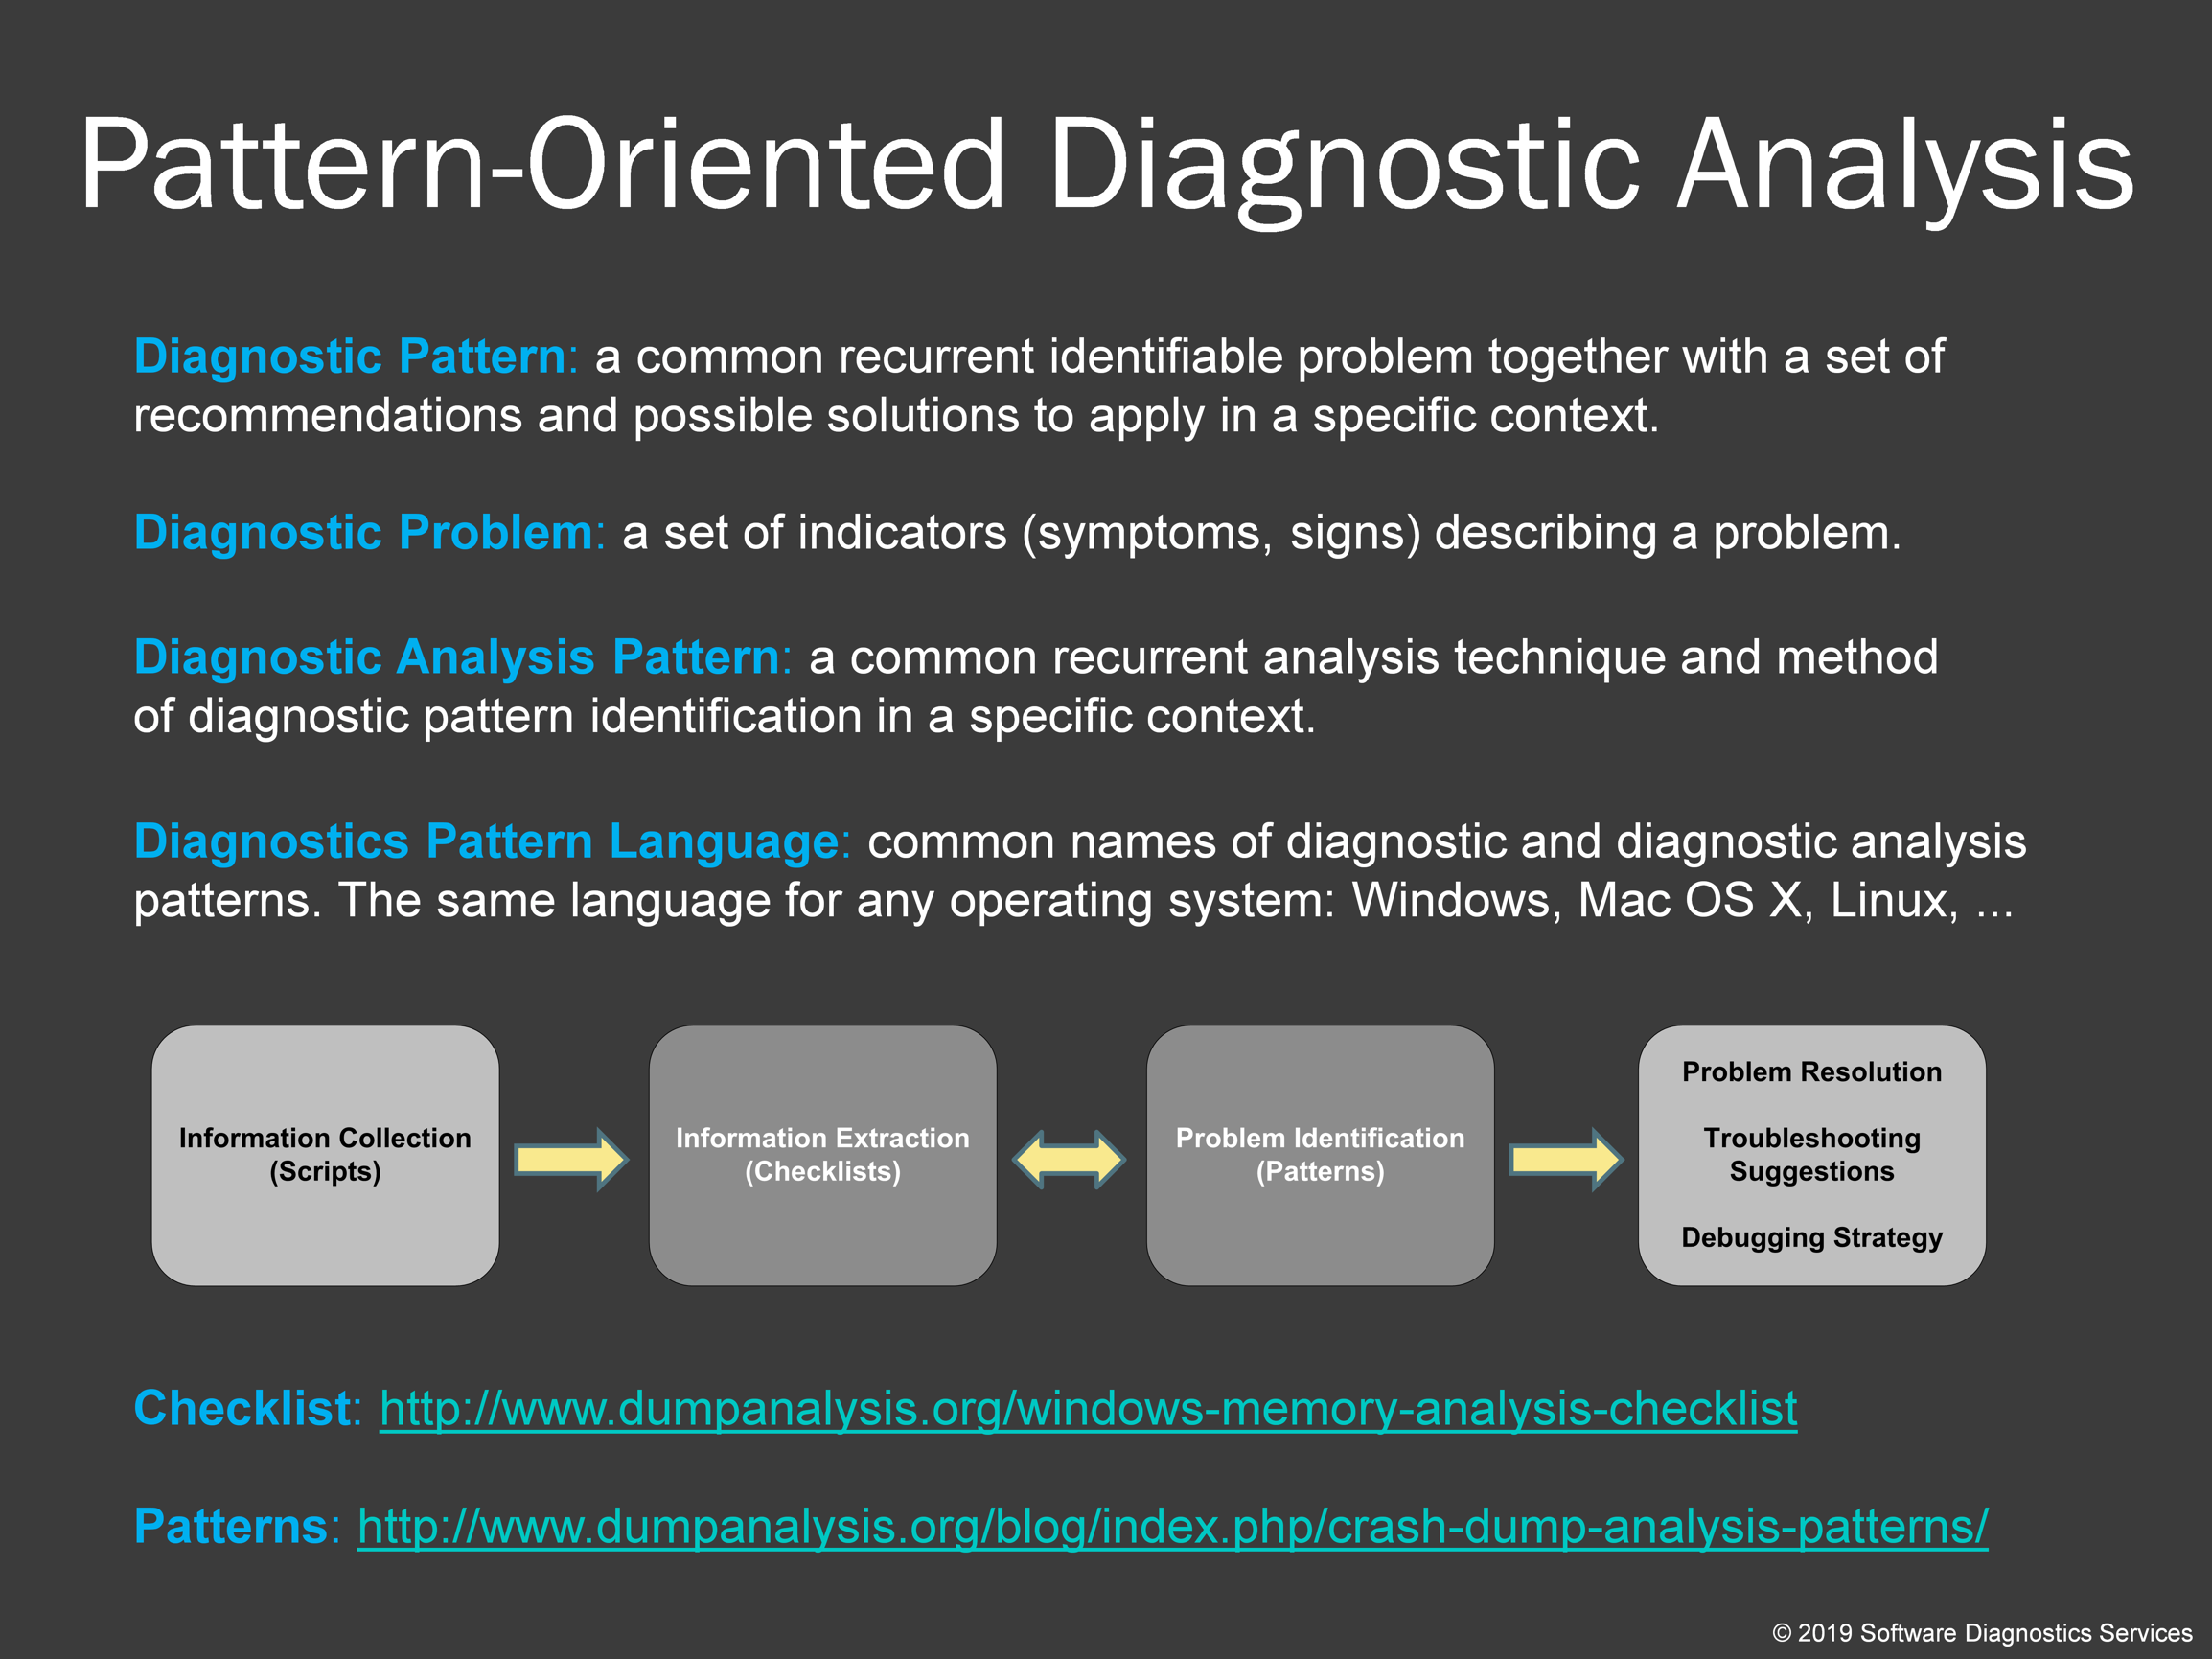
A few words about logs, checklists, and patterns. Memory dump analysis is usually an analysis of a text for the presence of diagnostic patterns. We run commands; they output text, and then we look at that textual output, and when we find suspicious diagnostic indicators, we execute more commands. Here checklists can be very useful. One such checklist is provided as a link. In some cases (such as complete memory dumps) it is beneficial to collect information into one huge log file by running several commands at once (like a script) and then do the first-order analysis.
Checklist: http://www.dumpanalysis.org/windows-memory-analysis-checklist
Patterns: http://www.dumpanalysis.org/blog/index.php/crash-dump-analysis-patterns/