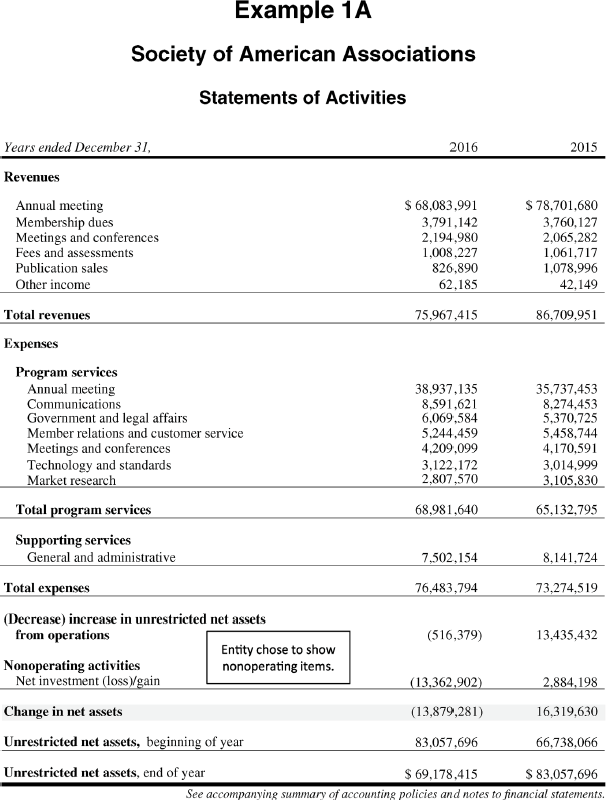
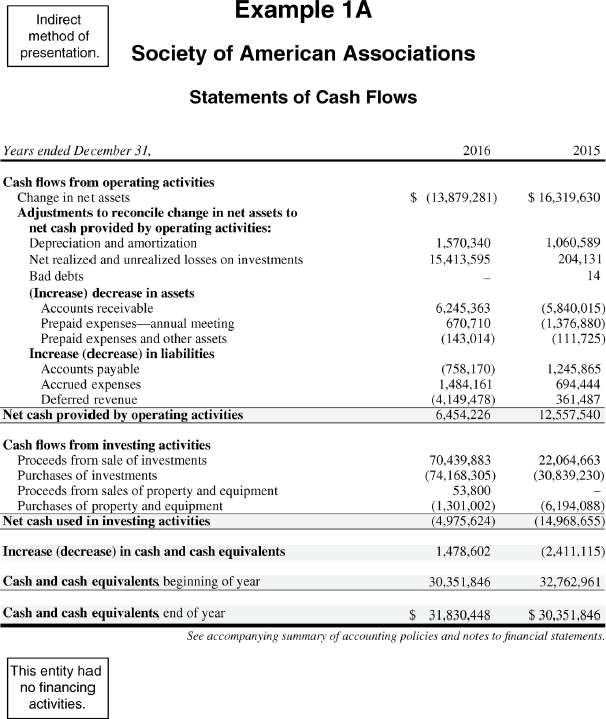
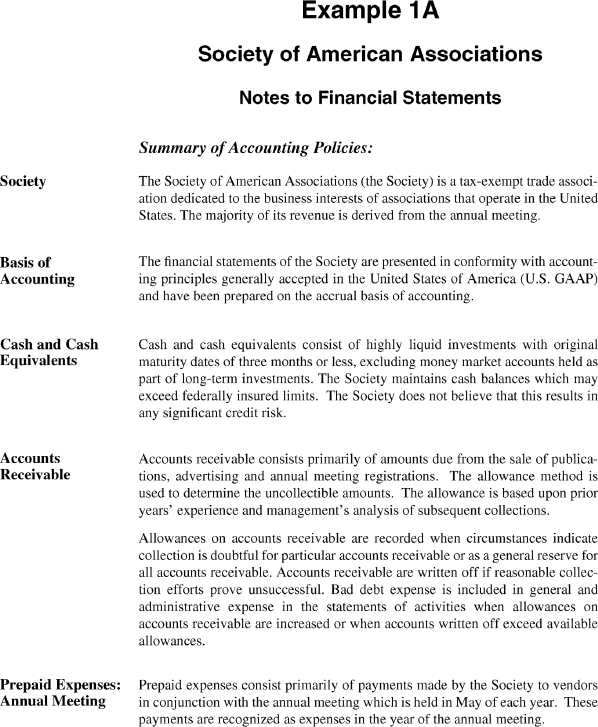
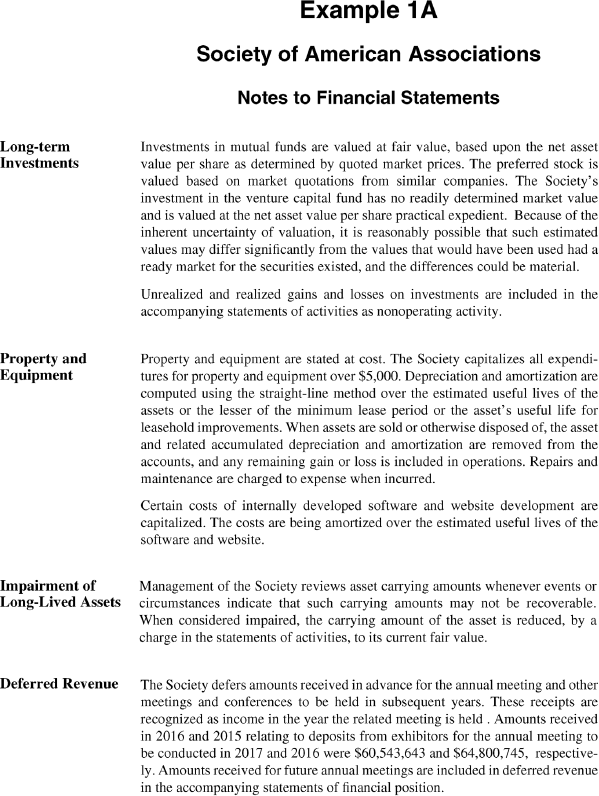
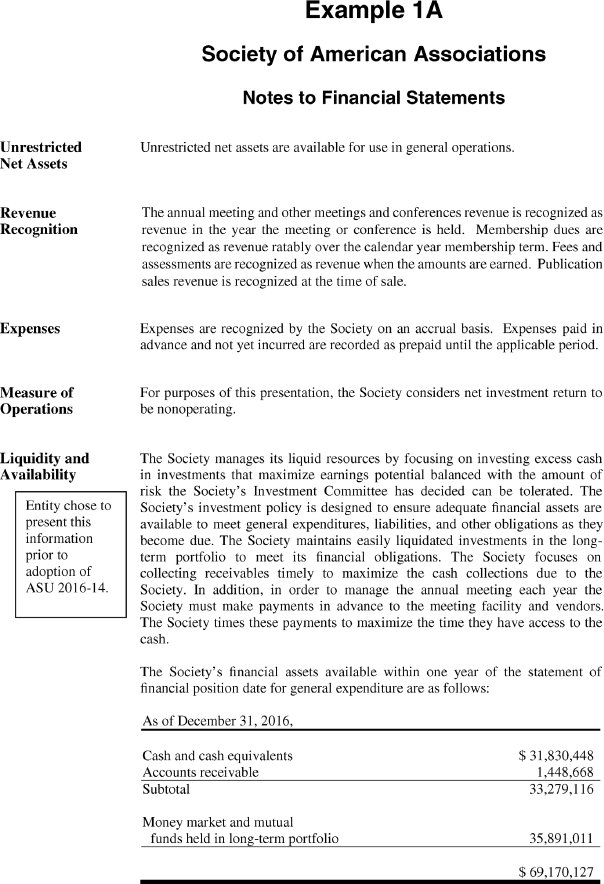
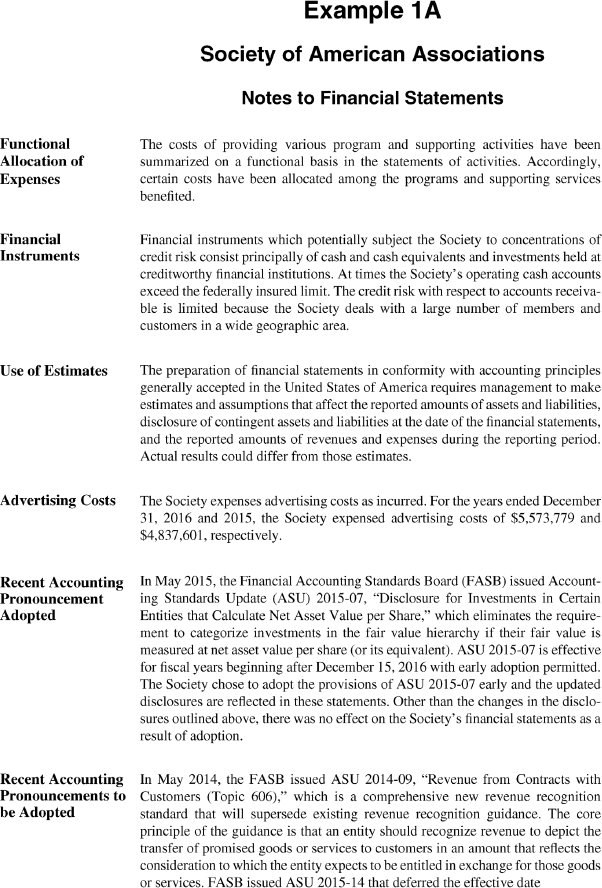
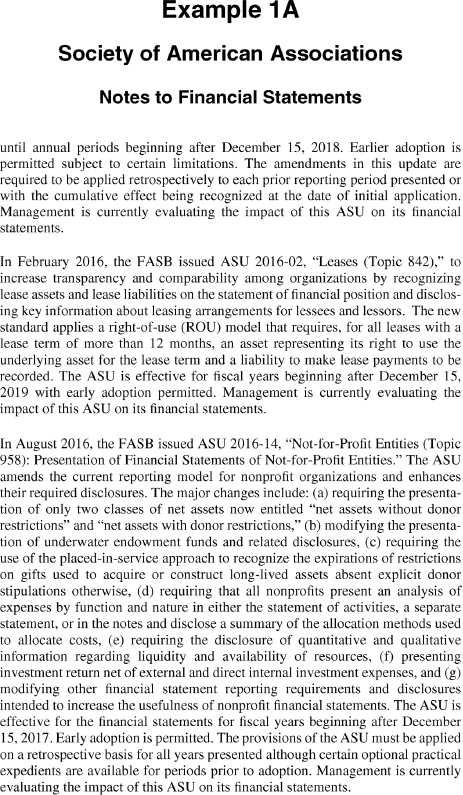
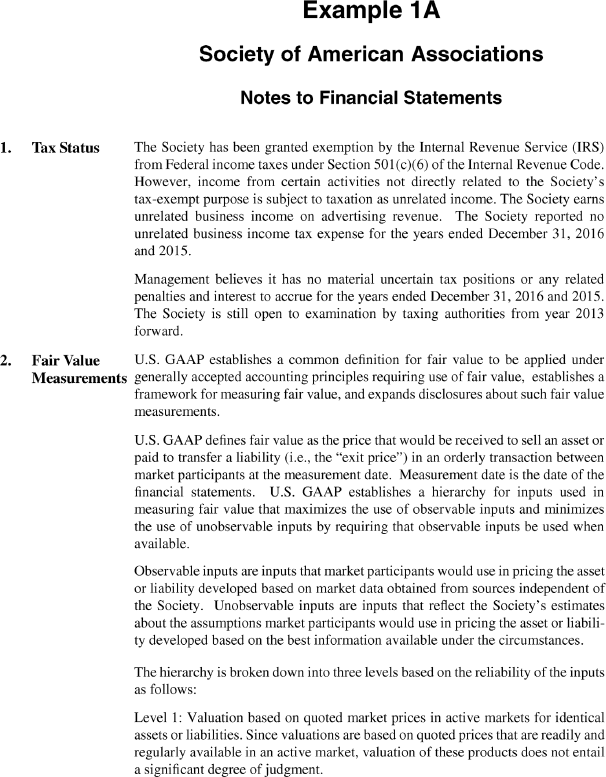
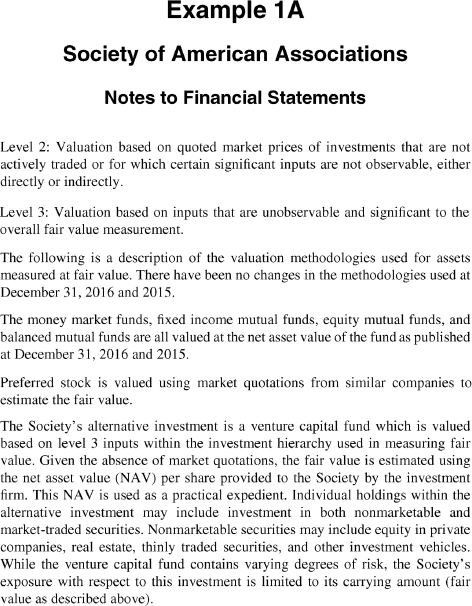
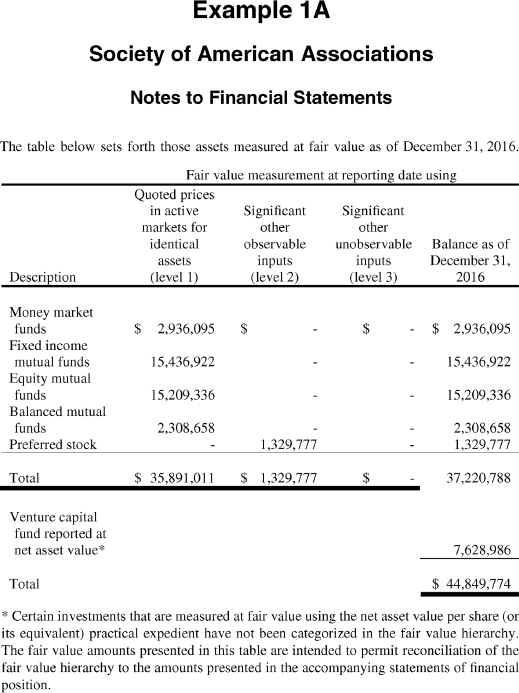
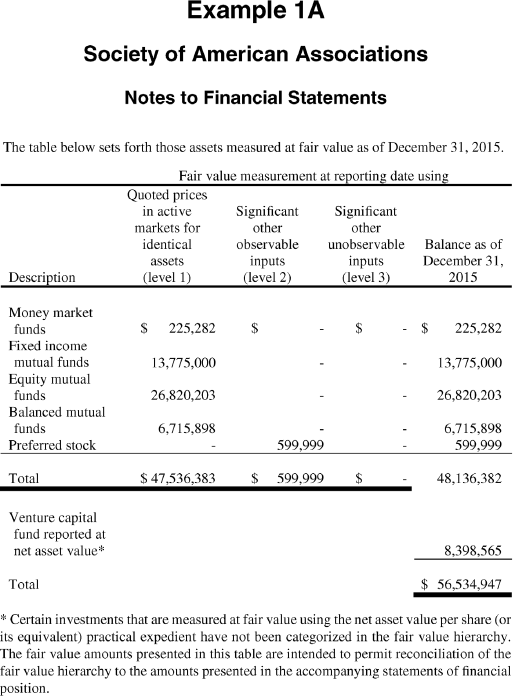
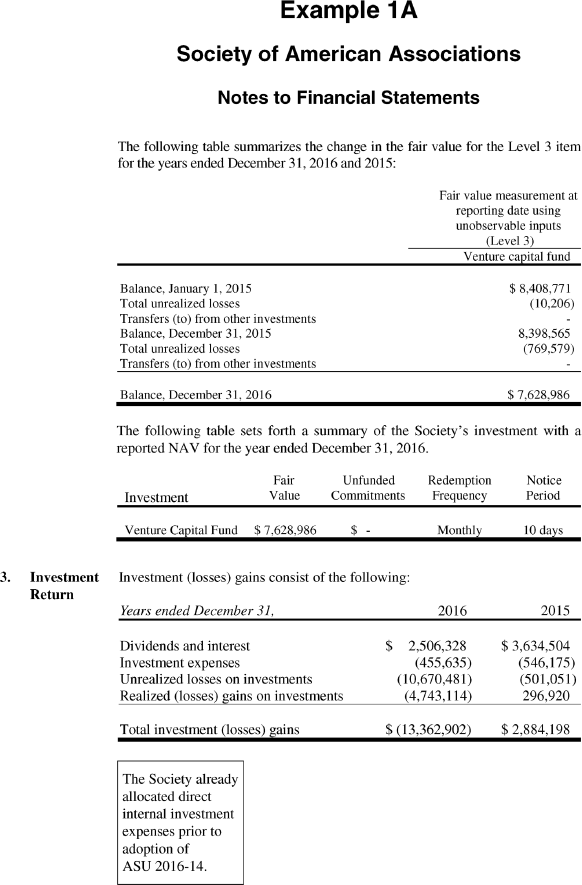
The following examples refer to a trade association, the Society of American Associations. The examples present the comparative financial statements for the years that ended December 31, 2016 and 2015.
Example 1A: Prepared using accounting guidance before the adoption of ASU 2016-14.
Example 1B: Prepared after the adoption of ASU 2016-14.


Use the financial statements in Example 1A for the Society of American Associations to familiarize yourself with a basic nonprofit financial statement that presents full comparative information for two years.
____________________________________________
____________________________________________
____________________________________________
____________________________________________
____________________________________________
____________________________________________
____________________________________________
____________________________________________
____________________________________________
____________________________________________
____________________________________________
____________________________________________
____________________________________________
____________________________________________
____________________________________________
____________________________________________
____________________________________________
____________________________________________
____________________________________________
____________________________________________
____________________________________________
____________________________________________
____________________________________________
____________________________________________
____________________________________________
____________________________________________
___________________________________________
___________________________________________
___________________________________________
____________________________________________
___________________________________________
____________________________________________
___________________________________________
____________________________________________
___________________________________________
___________________________________
___________________________________________
____________________________________________
___________________________________________
____________________________________________
___________________________________________
___________________________________________
___________________________________________
___________________________________________
____________________________________________
___________________________________________
___________________________________________
___________________________________________
___________________________________________
___________________________________________
___________________________________________
___________________________________________
___________________________________________
___________________________________________
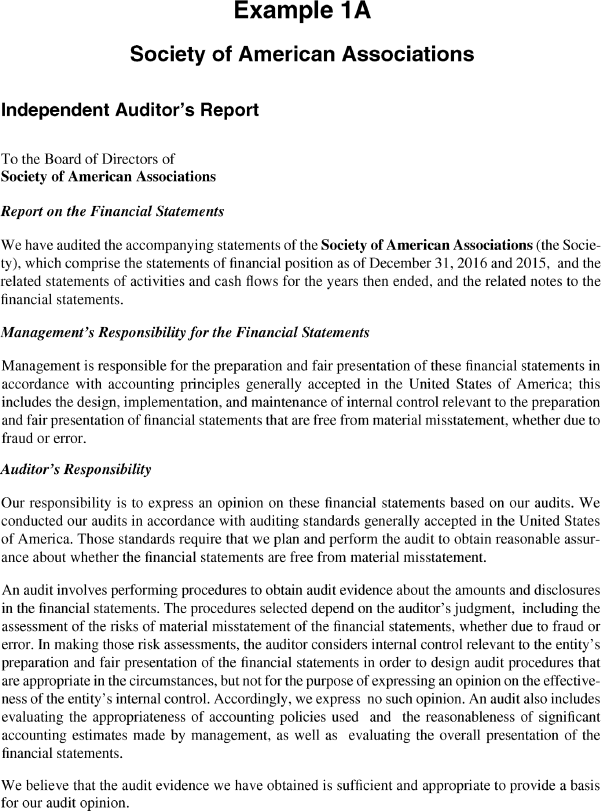
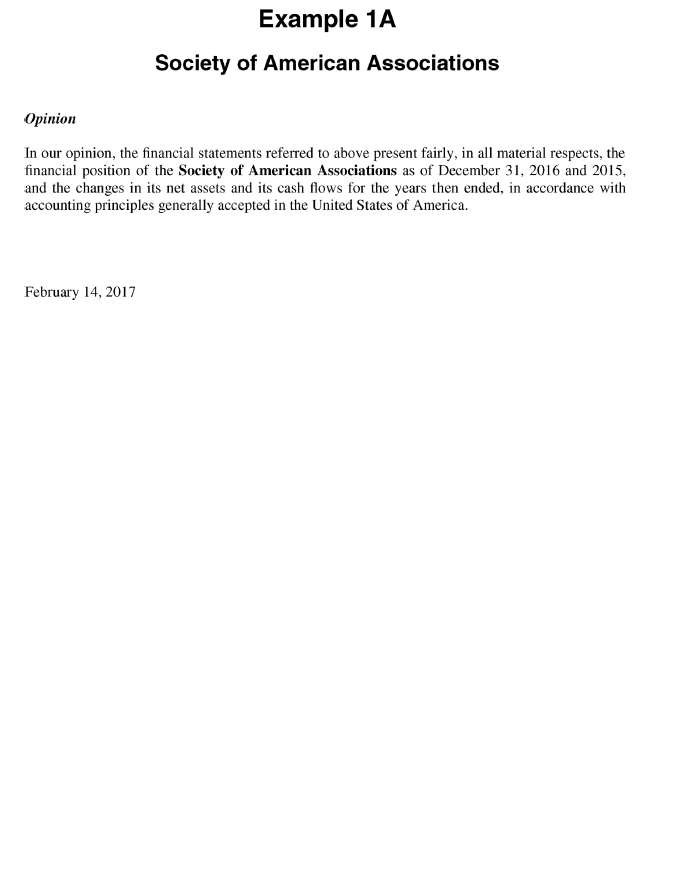
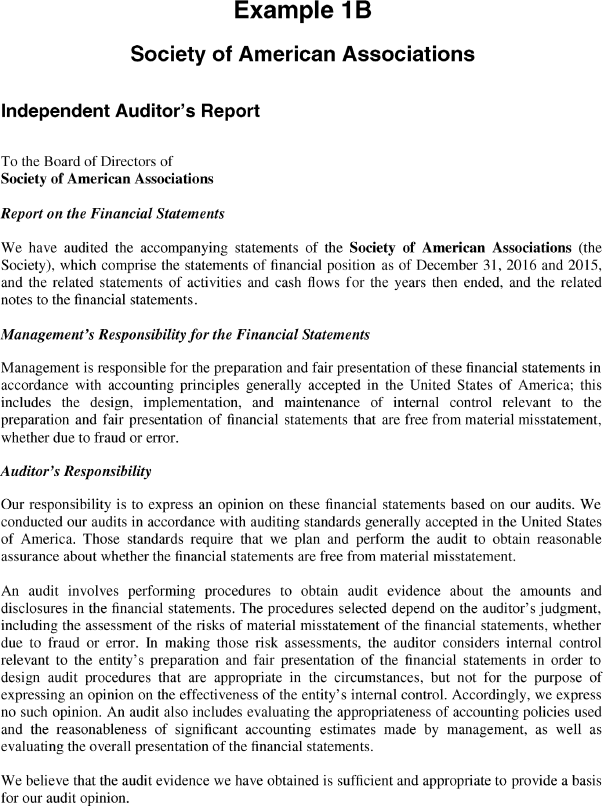
Unmodified opinion on comparative financial statements.
The years ended December 31, 2016 and 2015.
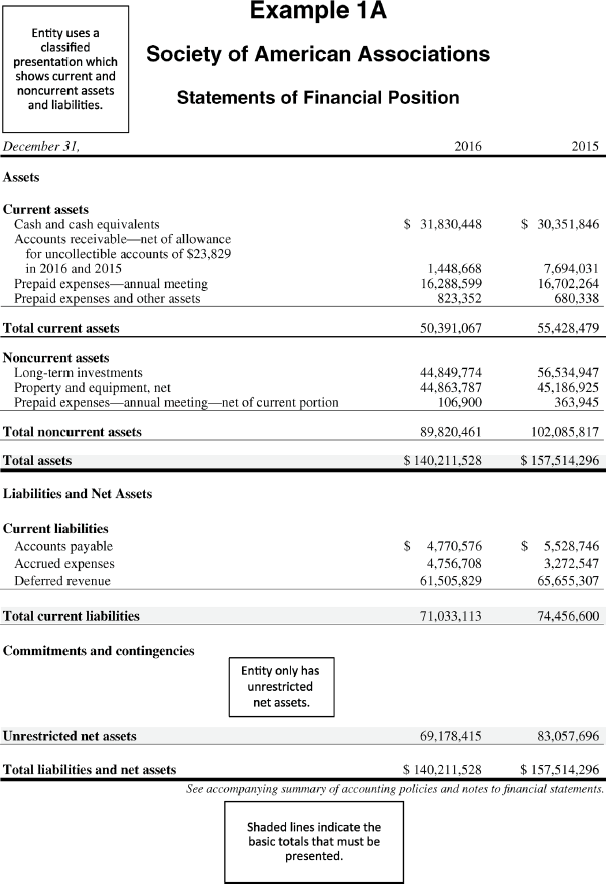
$50,391,067.
$89,820,461.
$71,033,113.
$69,178,415.
$(13,879,281).
It declined from .74 for FY 2015 to .71 for FY 2016. The current ratio is calculated by dividing the current assets by the current liabilities.
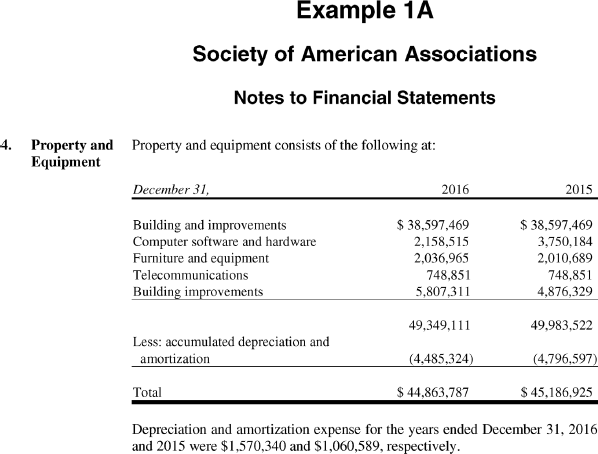
$44,849,774.
$16,395,499 (current portion of $16,288,599 plus noncurrent portion of $106,900).
$23,829.
Deferred revenue.
The change in unrestricted net assets from operations has declined from an increase of $13,435,432 in FY 2015 to a decrease of $(516,379) in FY 2016. Revenues decreased 12 percent while expenses increased 4 percent.
Annual meeting.
A decrease of $(516,379).
The organization experienced negative net investment return in the amount of ($13,362,902) for FY 2016 compared to a positive net investment return in the amount of $2,884,198 in FY 2015. This information appears in the statements of activities and in Note 3 in our example.
Change in net assets for FY 2016 was a negative ($13,879,281) compared to a positive change in net assets for FY 2015 in the amount of $16,319,630.
Indirect method.
The cash provided by operating activities was $6,454,226.
Cash flows from investing activities. The organization spent less cash on purchases of property and equipment in FY 2016 than FY 2015. The organization used cash of $1,301,002 in FY 2016 and $6,194,088 in FY 2015.
Cash flows from investing activities. The organization spent more on purchases of investments in FY 2016. The organization used cash of $74,168,305 in FY 2016 and $30,839,230 in FY 2015.
The cash position is better in 2016. It increased by $1,478,602.
In the summary of accounting policies at the beginning of the footnotes.
In the recent accounting pronouncements adopted in the summary of accounting policies and AnsNote 2.
$4,743,114 of realized losses per Note 3.
$10,670,481 of unrealized losses per Note 3.
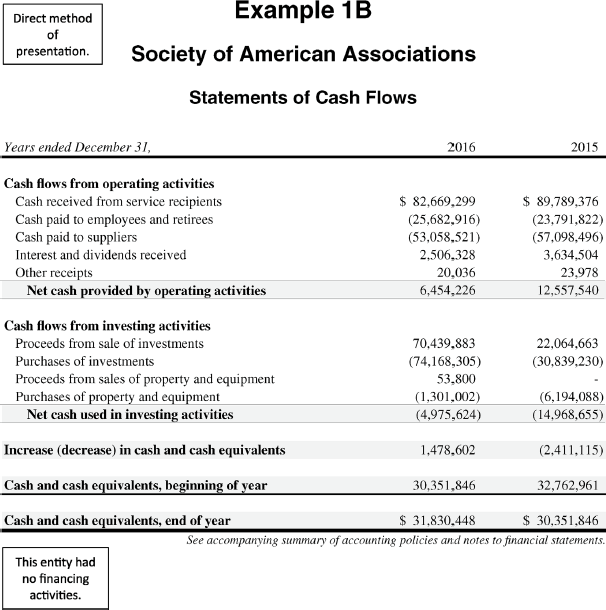
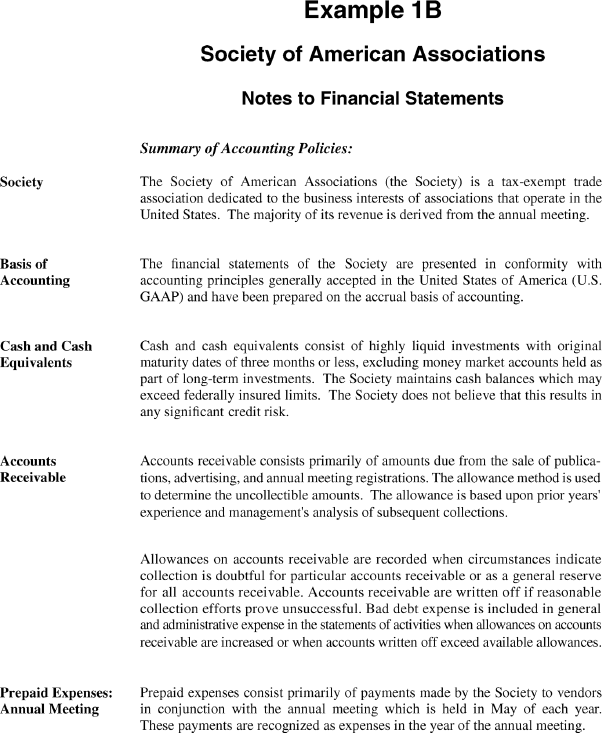
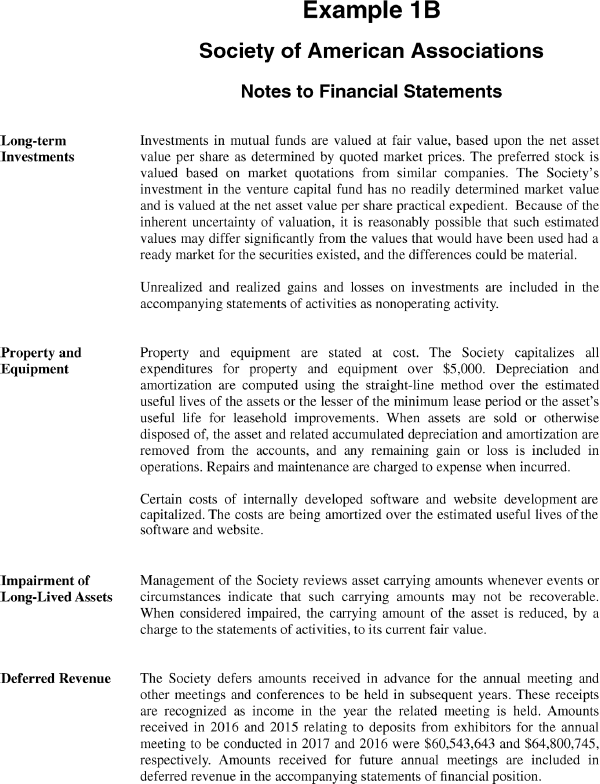
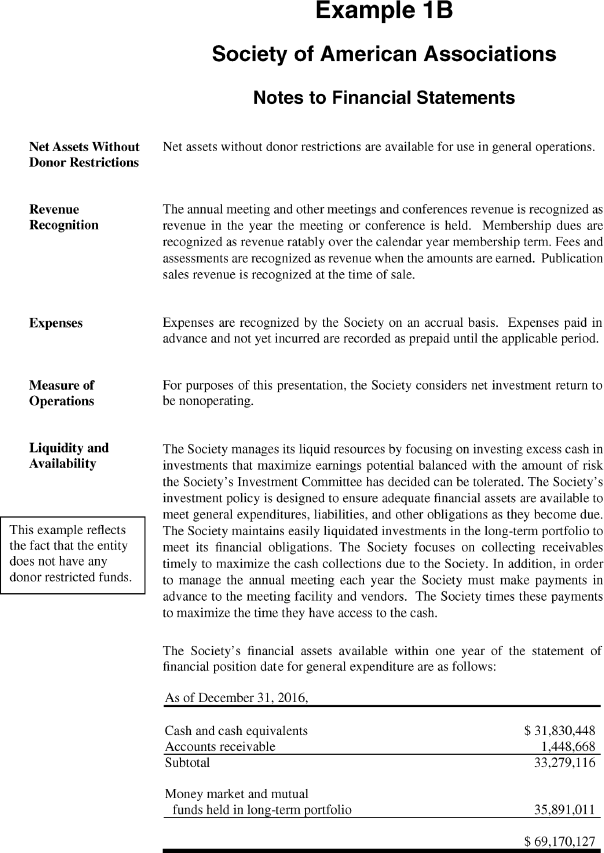
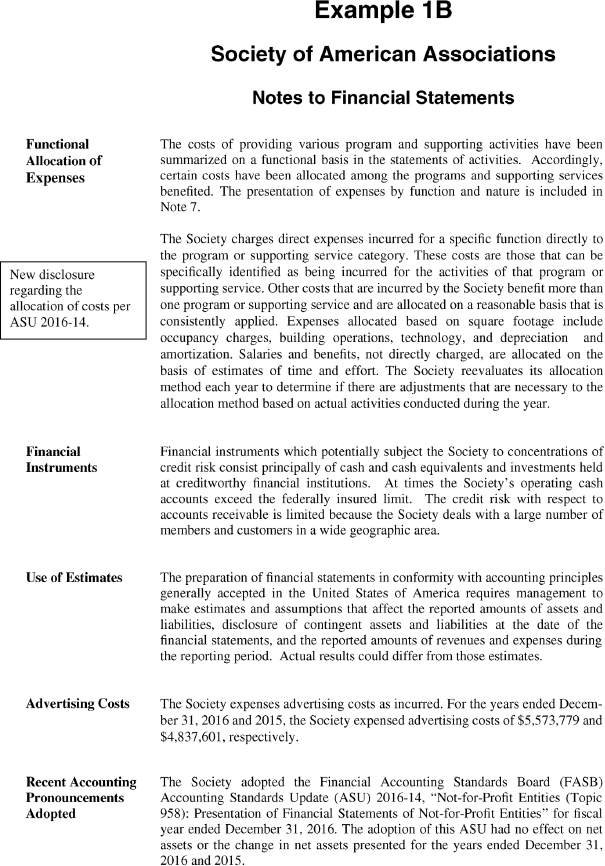
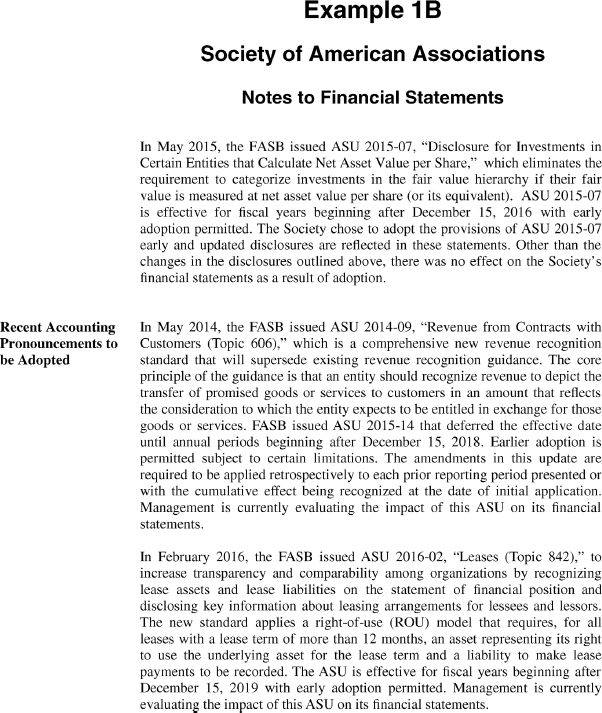
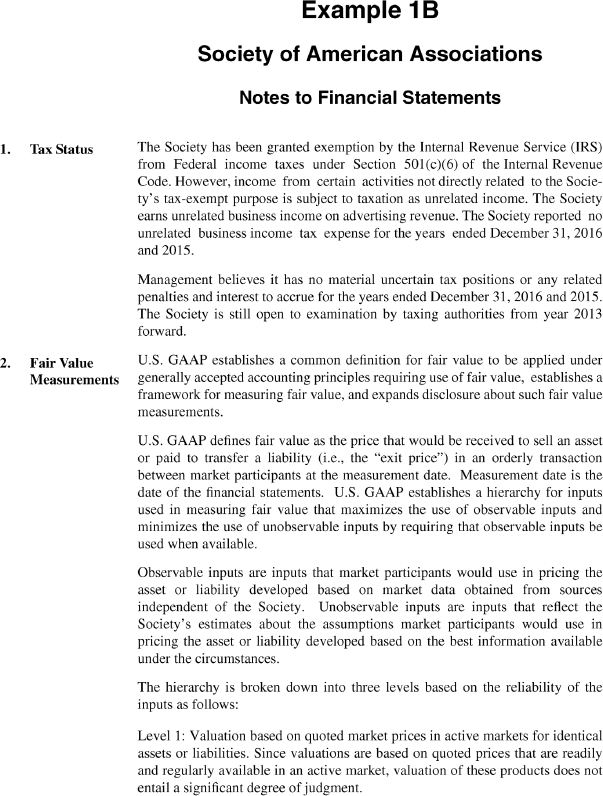

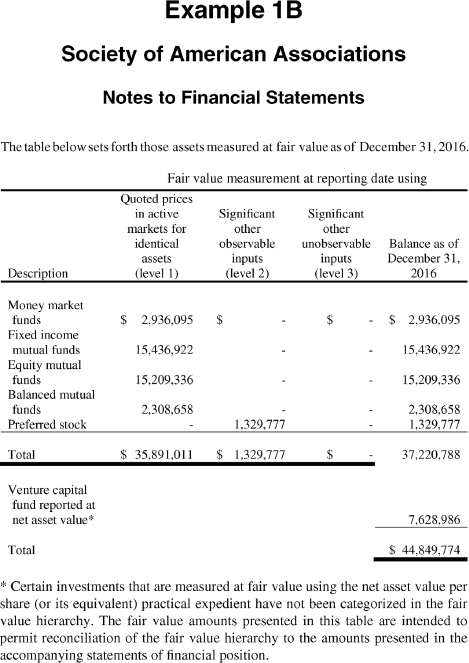
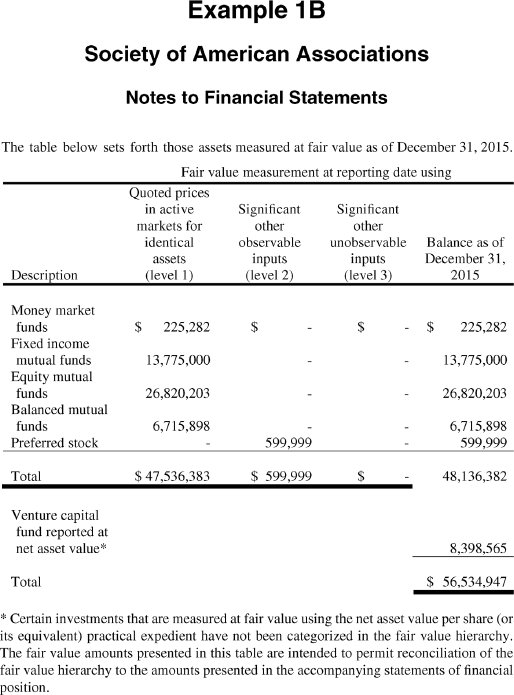
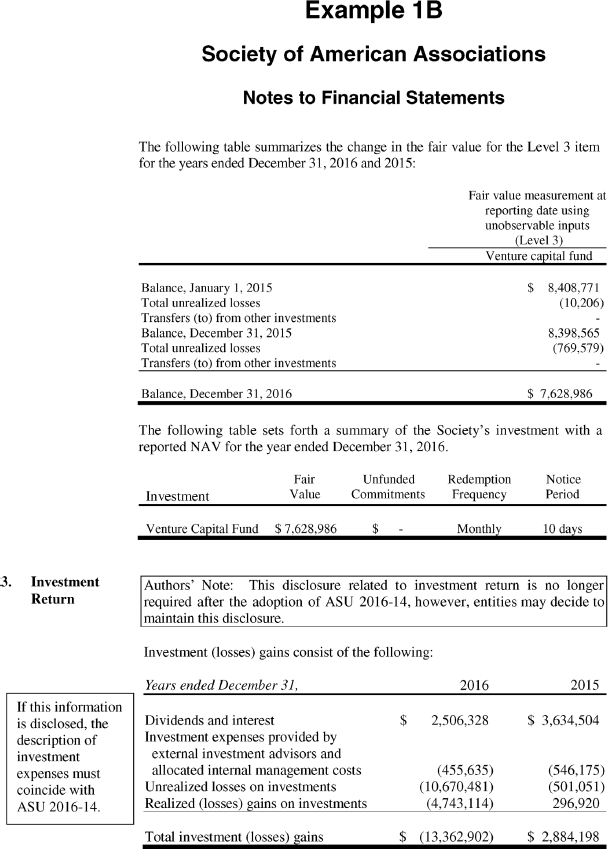
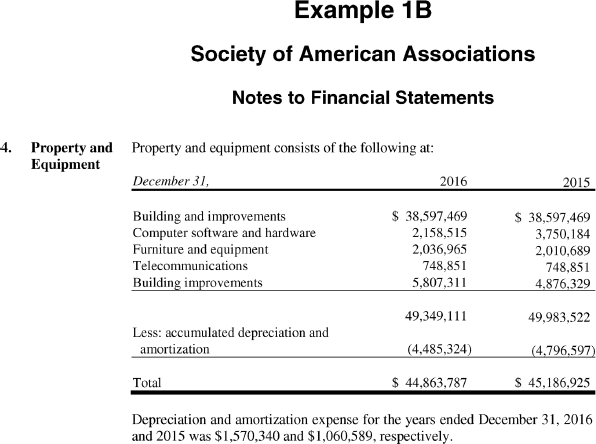
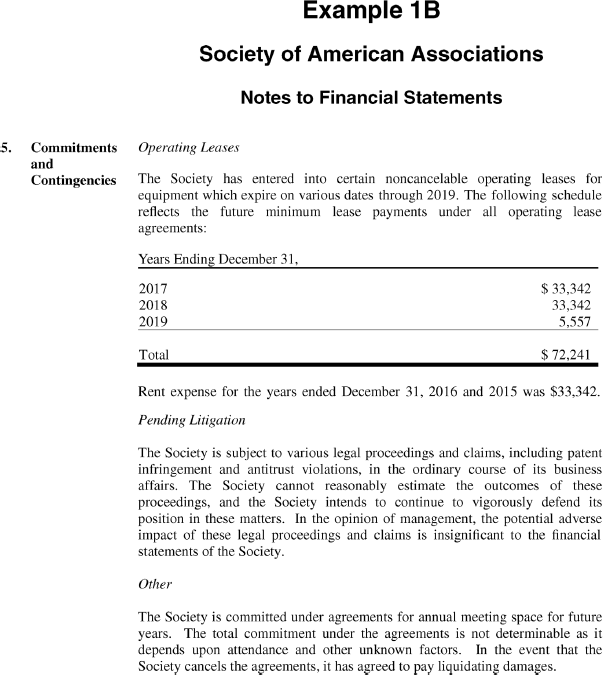
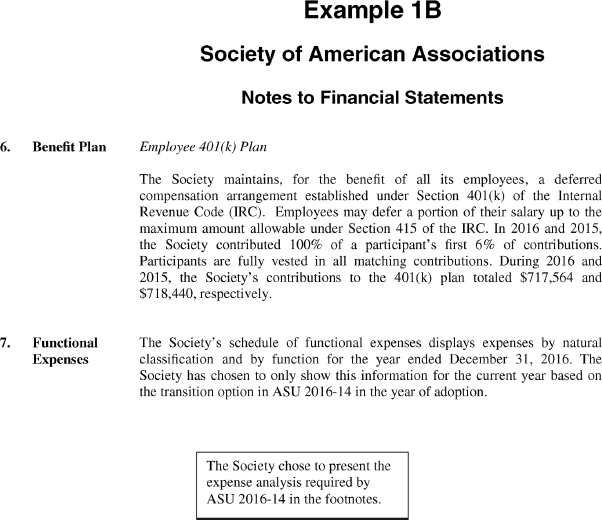
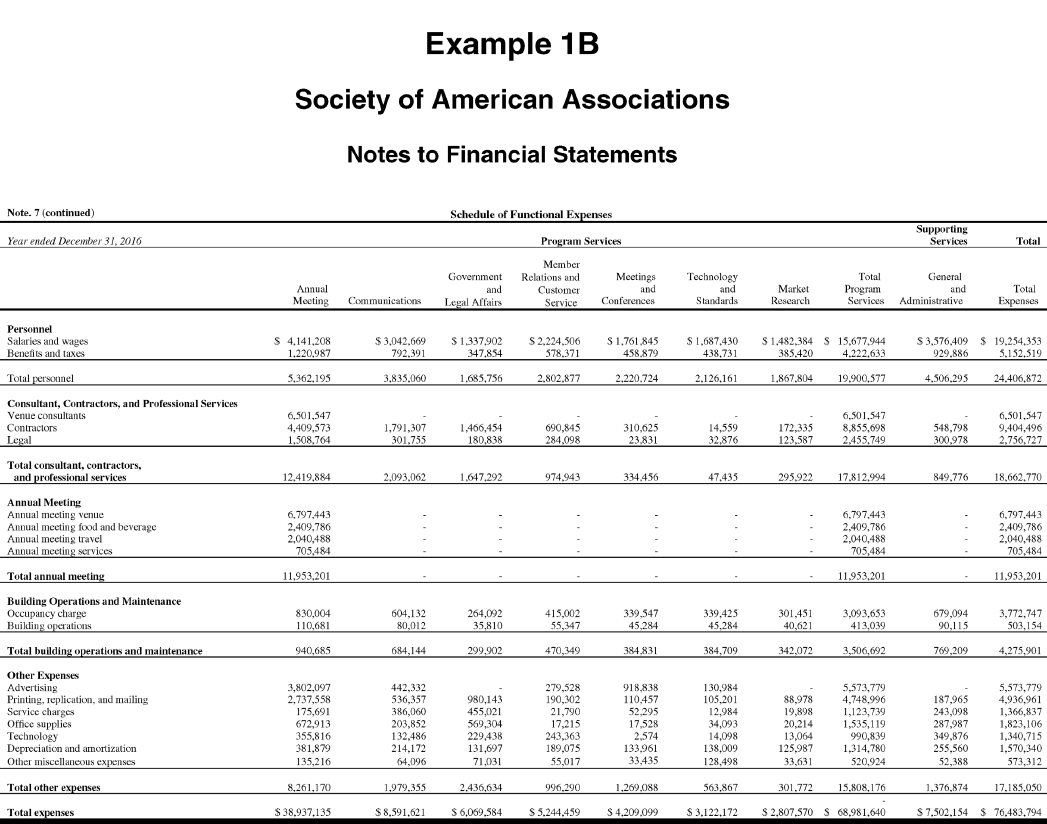

Use the financial statements in Example 1B for the Society of American Associations to familiarize yourself with a basic nonprofit financial statement that presents full comparative information for two years. In this example, the organization has adopted the provisions of ASU 2016-14.
_______________________________________
_______________________________________
_______________________________________
_______________________________________
_______________________________________
_______________________________________
_______________________________________
_______________________________________
_______________________________________
_______________________________________
_______________________________________
_______________________________________
_______________________________________
_________________________________________
_______________________________________
_______________________________________
_______________________________________
_______________________________________
_______________________________________
_______________________________________
_______________________________________
_______________________________________
_______________________________________
_______________________________________
___________________________________________
___________________________________________
___________________________________________
_______________________________________
___________________________________________
_______________________________________
_______________________________________
________________________________________
_______________________________________
_______________________________________
_______________________________________
_______________________________________
_______________________________________
_______________________________________
_______________________________________
_______________________________________
_______________________________________
_______________________________________
_______________________________________
_______________________________________
_______________________________________
_______________________________________
_______________________________________
_______________________________________
_______________________________________
_______________________________________
_______________________________________
_______________________________________
_______________________________________
_______________________________________
_______________________________________
_______________________________________
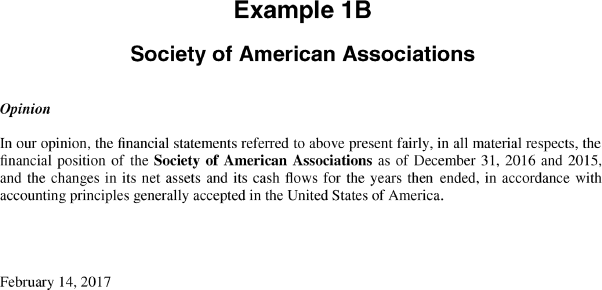
Unmodified opinion on comparative financial statements.
The years ended December 31, 2016 and 2015.
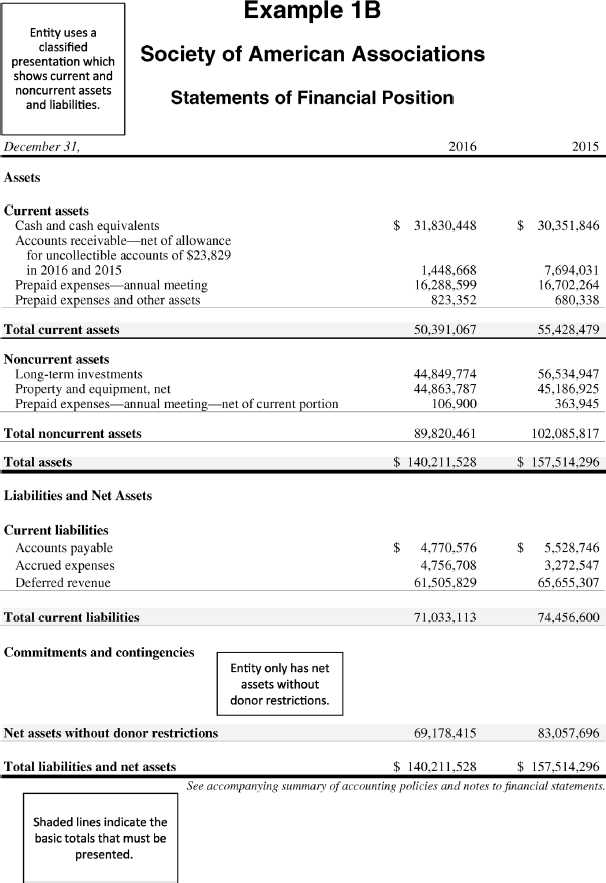
$50,391,067.
$89,820,461.
$71,033,113.
$69,178,415.
$(13,879,281).
It declined from .74 for FY 2015 to .71 for FY 2016. The current ratio is calculated by dividing the current assets by the current liabilities.
$44,849,774.
$16,395,499 (current portion of $16,288,599 plus noncurrent portion of $106,900).
$23,829.
Deferred revenue.
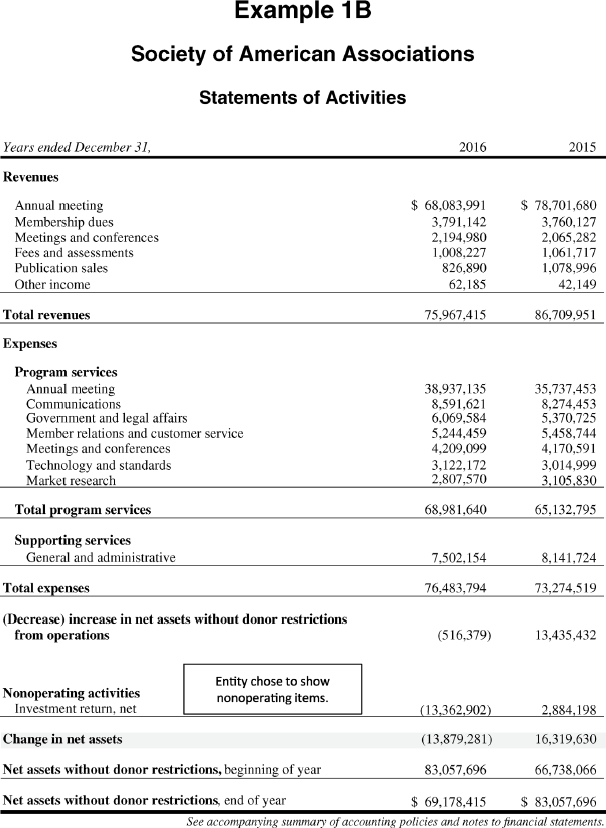
The change in net assets without donor restrictions from operations has declined from an increase of $13,435,432 in FY 2015 to a decrease of $(516,379) in FY 2016. Revenues decreased 12 percent while expenses increased 4 percent.
Annual meeting.
A decrease of $(516,379).
The organization experienced negative net investment return in the amount of ($13,362,902) for FY 2016 compared to a positive net investment return in the amount of $2,884,198 in FY 2015. This information appears in the statements of activities and in Note 3 in our example.
Change in net assets without donor restrictions for FY 2016 was a negative ($13,879,281) compared to a positive change in net assets without donor restrictions for FY 2015 in the amount of $16,319,630.
Direct method.
The cash provided by operating activities was $6,454,226.
Cash flows from investing activities. The organization spent less cash on purchases of property and equipment in FY 2016 than FY 2015. The organization used cash of $1,301,002 in FY 2016 and $6,194,088 in FY 2015.
Cash flows from investing activities. The organization spent more on purchases of investments in FY 2016. The organization used cash of $74,168,305 in FY 2016 and $30,839,230 in FY 2015.
The cash position is better in 2016. It increased by $1,478,602.
In the summary of accounting policies at the beginning of the footnotes.
In the recent accounting pronouncements in the summary of accounting policies and Note 2.
$4,743,114 of realized losses per Note 3.
$10,670,481 of unrealized losses per Note 3.
In the summary of accounting policies note under the heading liquidity and availability.
$69,170,127.