16
Introduction to the Collection of Example Problems
16.1 Introduction
In order to enable the reader to gain practical experiences with the different topics discussed in this textbook, a number of examples is available free for download via the Internet. These include many of the examples found in the book and a collection of additional problems, which we plan to further update. While the location of the files may change in the future, the material itself or a link to the material will always be available on www.ddbst.com.
16.2 Mathcad Examples
To construct a part of the example calculations, the well‐known and widely available mathematical software Mathcad is used. Major reasons for selecting this software are its simplicity and intuitiveness. In addition, the Mathcad format very closely resembles the way that equations and calculations are usually presented in textbooks. This makes the examples easy to read and understand. An additional advantage is that values in Mathcad usually carry their correct units and unit conversions are handled automatically. In some of the examples, symbolic manipulations using the integrated MAPLE software are demonstrated, which allow, for example, rearranging, simplifying, and solving mathematical expressions as well as symbolic differentiation and integration. A typical Mathcad document is shown in Figure 16.1.
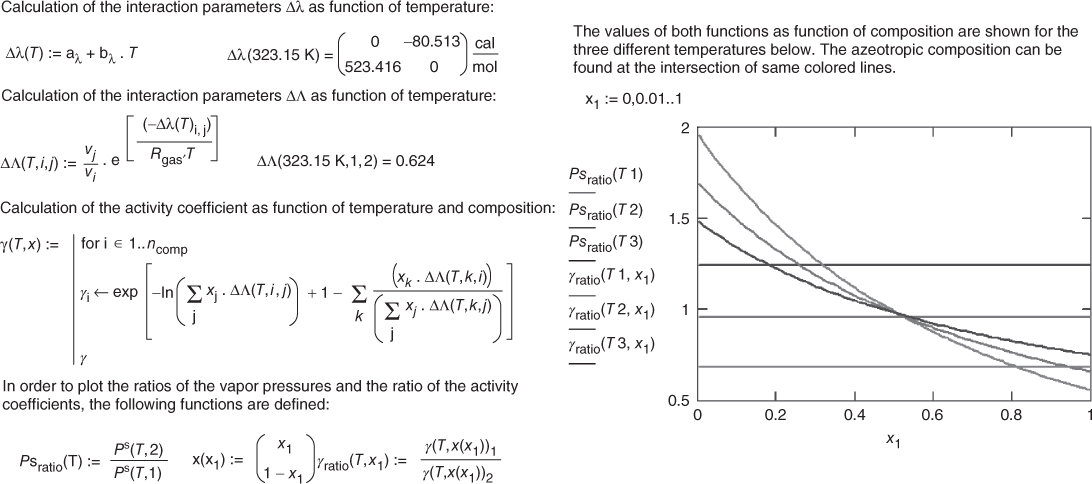
Figure 16.1 Excerpt from a typical Mathcad document from the example collection. 05.12 Azeotropic Points of the System Acetone – Methanol.mcd.
For a broader comparison and user experiences with Mathcad and other mathematical software like Matlab, Mathematica, and so on, as well as introductions to use Mathcad, consult the Internet. A free 30‐day trial of Mathcad is available from www.ptc.com. For readers who do not have access to Mathcad, the files will also be made available in other formats (XPS, MathML, etc.).
Besides the examples prepared for this textbook, a multitude of further calculations from different other authors using Mathcad can be found online, either in the form of single files or complete books written in Mathcad.
In addition, PTC, the provider of Mathcad, maintains a massive library of example calculations within their Mathcad Resource Center.
As a first introduction to the software, consult the texts under Help – Resource Center – Overview and Tutorials in Mathcad. Besides this, a multitude of further introductory texts is available on the Internet.
Examples in this collection use both the file formats for Mathcad version 2001 and more up‐to‐date versions. Any version of Mathcad higher than version 2001 is sufficient to solve the problems.
The complexity of the examples ranges from simple calculations to very extended and complex documents. Usually, the files also contain more or less trivial intermediate calculation steps in order to assist the mathematically less‐trained reader. The authors hope that these examples not only help the reader to better follow the details of the calculations but also serve as a convenient starting point for own modifications and extensions.
16.3 Examples Using the Dortmund Data Bank (DDB) and the Integrated Software Package DDBSP
In addition to the Mathcad files, numerous further problems are included that require the Dortmund Data Bank (DDB) and the integrated software package DDBSP. In order to enable anybody to follow these examples, DDB Software and Separation Technology (DDBST) GmbH has provided a free Explorer Version of their products that can be downloaded from www.ddbst.com. The free version, although restricted in functionality, is sufficient for most of the problems given on the website. It contains basic constants and model parameters as well as several thousand sets of experimental data for 30 common components and their mixtures. The components have been selected in order to provide a sufficient amount of reliable experimental data and at the same time cover a large range of the phenomena discussed in the textbook.
Using the integrated software package DDBSP, physical properties from the data bank can be searched, plotted, and regressed via a variety of thermodynamic models (pure component property correlations as well as gE models and equations of state for the real mixture behavior). Simultaneous regression and analysis of phase equilibrium data and excess properties of subcritical nonelectrolyte mixtures can be performed using the software Recpar. In order to estimate a large variety of pure component properties from molecular structure, the program package ARTIST is included. The functionality of DDBSP has been restricted in the free Explorer Version; only a subset of the regression and prediction models is included, and they may only be used for a certain range of components. Process synthesis tools were to a large part excluded, especially where they require a larger number of components and experimental data like in the case of entrainer selection. The Explorer Version also does not allow us to build up private data banks and thus excludes the various data bank editor programs. For an extended functionality in a university or a nonprofit research institution, special low‐cost single user and classroom educational versions are available (see www.ddbst.com). The Professional Educational Version includes basic data for nearly 57000 DDB components and allows us to build up in‐house data banks to store and process, for example, own measurements.
A typical graphical output of a vapor–liquid equilibrium data set together with the UNIFAC prediction as presented by DDBSP is shown in Figure 16.2.
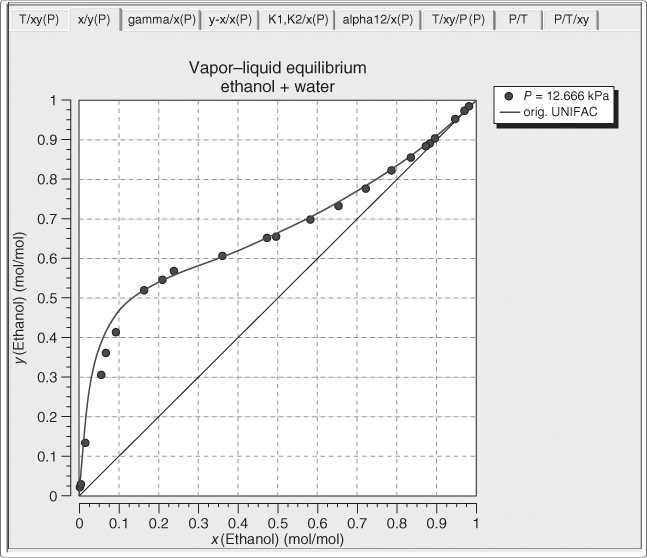
Figure 16.2 Experimental VLE data set and curve calculated using UNIFAC as presented by DDBSP.
16.4 Examples Using Microsoft Excel and Microsoft Office VBA
Microsoft Excel and Visual Basic for Application (VBA) are also frequently used for scientific calculations. They are convenient to use and generally available but suffer from the fact that the calculations performed in Basic code or the Excel sheet are not easy to read and understand by users other than the developer. Several examples employ Excel and/or VBA and demonstrate applications where they offer great advantages due to their flexibility and the ability to easily interface to COM components of other software products. For the less‐trained or infrequent programmer, VBA is definitely considered the language of choice, and its similarity to the science and engineering language FORTRAN is a clear advantage. From VBA, calculations implemented in Mathcad documents or many functionalities in DDBSP can be easily called as COM functions. VBA is familiar to many engineers as it is also able to programmatically employ most functionality including the thermodynamic engines of all major process simulators.