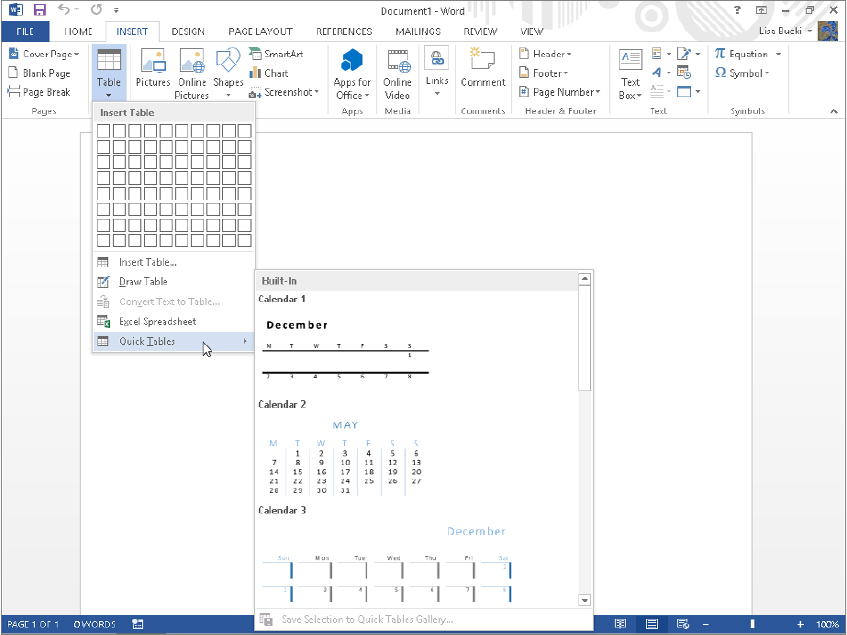
FIGURE 9.1 The Quick Tables Gallery offers a number of preformatted tables.
IN THIS CHAPTER
Creating tables
Using table styles and applying other table formatting and design settings
Handling tables, rows, columns, and cells
Adding shapes
Including and formatting pictures in your document
Creating WordArt
Adding and formatting SmartArt
Arranging graphics
Using the Selection Pane to work with object visibility
Tables and SmartArt enable you to illustrate data and processes in documents. They’re extremely flexible and easy to create and manipulate. You can further illustrate a document with shapes, WordArt, and pictures, including thousands of royalty-free images offered online at Office.com. Thanks to numerous galleries, it’s easy to create professional graphics of all sorts quickly and with minimal effort. Live Preview also comes into play when you work with table and graphic formatting. This chapter teaches you about these features in Word.
The quickest way to create a table in Word is to use one that already exists. It might not be exactly what you want, but it often will be closer to what you want and save you a lot of formatting and setup versus creating a table from scratch. It helps if you can see a picture, of course, and Word 2013 includes a Quick Tables gallery from which you can select a predefined table to insert in the current document. After you click to position the insertion point at the location where you want to insert the table, click the Insert tab. Click the Table button in the Tables group of the Insert tab, and then point to Quick Tables. The gallery shown in Figure 9.1 appears.
FIGURE 9.1 The Quick Tables Gallery offers a number of preformatted tables.
Scroll through the gallery to see if there’s a table design you like — something that compares favorably with the table you envision. If there is, click on it. If it has too many rows, you can delete the ones you don’t need. If it has too few columns, you can add a few more. If the proportions and other attributes aren’t quite right, you can use Word’s table tools to make them right. The point is that you hit the ground running.
One way to think about a table is as a container for information. The container consists of horizontal rows and vertical columns. If someone speaks of a five-by-four (5 × 4) table, by convention and agreement this refers to a table that’s five columns high and four rows wide.
If the terminology is foreign to you, think of rows as you would the windows across each floor of a skyscraper. Think of columns as the vertical columns of windows on the same skyscraper building. Rows go across, and columns go up and down.
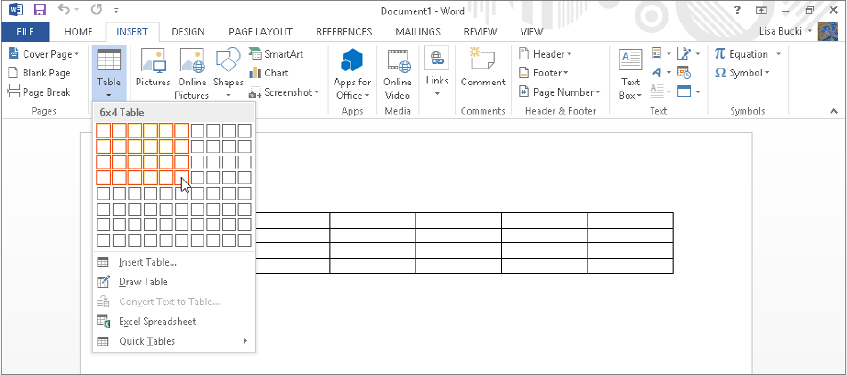
There are three basic methods for creating a table from scratch. One is to use the Table tool to select the numbers of rows and columns you want. In the Insert tab click Table in the Tables group. Drag the mouse pointer down through the Insert Table grid. As you move the mouse, the selected table dimensions change, and Word shows a Live Preview in the document window, as shown in Figure 9.2. Click the mouse when the table has the number of rows and columns you want.
FIGURE 9.2 When a 6 × 4 table is selected in the Insert Table grid, a 6 × 4 Live Preview appears in the document window.
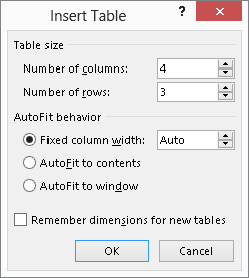
A second method for creating a table from scratch is by using the Insert Table dialog box, as follows:
FIGURE 9.3 The Insert Table dialog box enables you to choose the number of columns and rows and specify additional settings when creating a table.
The third method for inserting a table from scratch is to draw it using the Draw Table tool. To begin, choose Insert ⇒ Tables ⇒ Table ⇒ Draw Table. Drag a rectangle to establish the outer boundary of the table, and then use the Draw Table tool (which will be active at that point by default) to draw out the desired cells. Use the tools in the Table Tools ⇒ Design tab’s Borders group to set line style, weight, and color for the table borders. Use the Eraser tool in the Table Tools ⇒ Layout tab to remove unwanted table parts. See the “Using the table eraser” section later in this chapter for additional information.
When nonprinting formatting marks are displayed (Ctrl+Shift+8 [Ctrl+∗] or Home ⇒ Paragraph ⇒ Show/Hide), cell markers display in each cell, showing where the cells are, as indicated in Figure 9.4. You might wonder why cell markers are needed if the table borders show the location of cells. That’s because not every table has borders. If a borderless table’s gridlines aren’t displayed, you might not even know a table is there. Toggling the nonprinting cell markers provide visibility for the table cells. Cell markers, incidentally, display whenever paragraph marks do.
FIGURE 9.4 Show hidden characters to display cell markers.
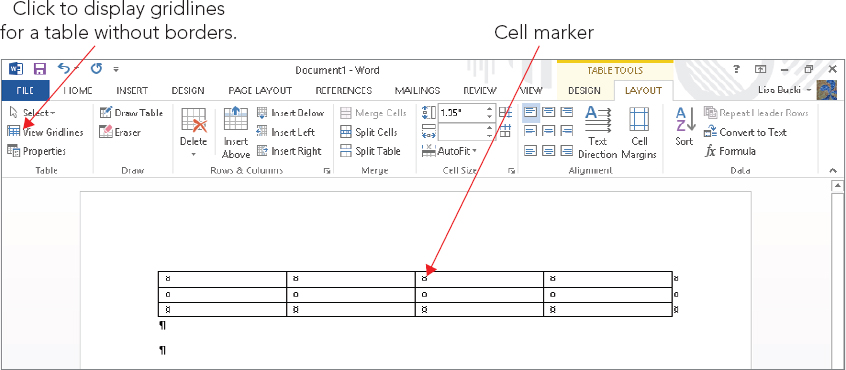
When a table has no borders, it’s a good idea to display table gridlines. These are nonprinting marks that show the cell’s dimensions. To display gridlines, click the View Gridlines choice in the Table group at the left end of the Table Tools ⇒ Layout tab. See Figure 9.4.
Notice the AutoFit behavior options shown in the Insert Table dialog box in Figure 9.3. These same AutoFit options are also available when you move the mouse pointer over the table, right-click the table move handle that appears at the upper left, and then point to AutoFit, as shown in Figure 9.5. The AutoFit settings enable you to size the table and its columns automatically.
FIGURE 9.5 Right-click the table move handle to display a shortcut menu with table options, including AutoFit.
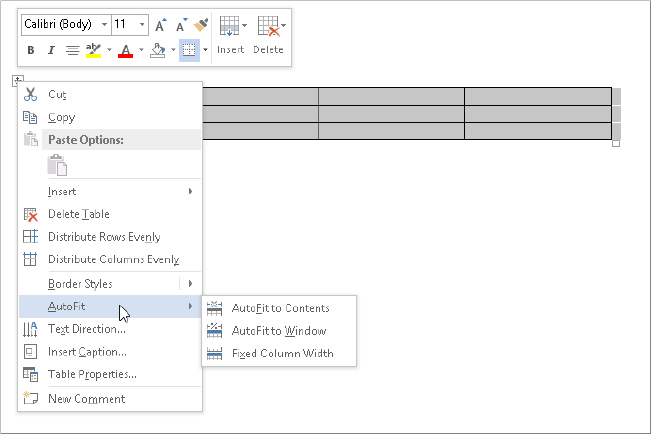
When you choose the Fixed Column Width option, the column widths remain fixed unless you explicitly change them by dragging or by using the Table Properties dialog box. Note that fixed is not the same as equal. The column widths might be equal also, but that’s a different concept.
The AutoFit to Contents command causes a table to automatically resize as you add or remove material. It’s not a temporary setting, so table columns widths continue to change when you add or remove text in existing cells.
Think of the AutoFit to Window command as “AutoFit to left and right margins.” This option means that the table will remain as wide as the document text itself. If you add text disproportionately to any given column, that column will automatically resize, making the other columns correspondingly narrower. But the table itself will maintain the width of the document text.
There is a correspondence between the word tab and the word table. Although the proportion of the word processing population that was raised on typewriters is rapidly dwindling, those who took typing classes learned how to fashion tables using the tab stops and the Tab key. Tab stops are metal hardware on a typewriter that literally stop the carriage when you press the tab key. Because you can use tab stops to create a table-like arrangement, Word can readily convert your tab-delineated tables into real tables, and it even can convert information delimited with other characters such as commas. If for some reason you want to convert a table back to text, Word can perform that transformation, too.
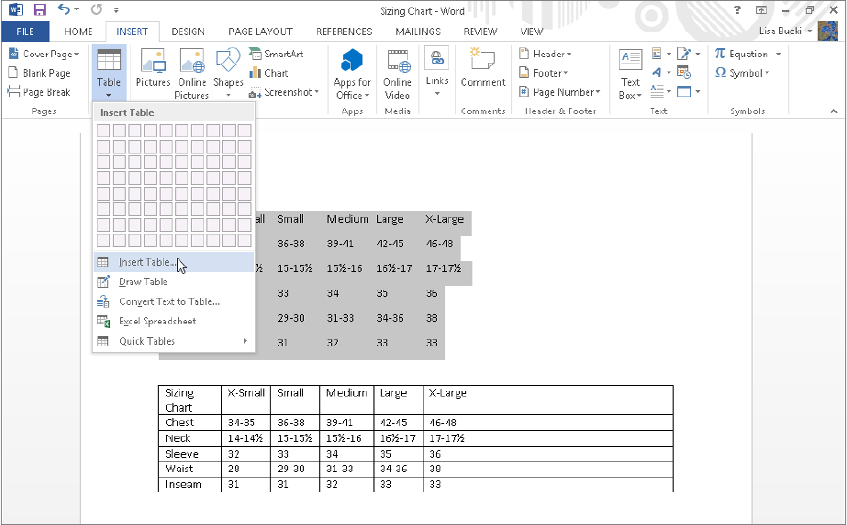
If the text is set up with tabs between the “columns,” you can use the Insert Table command to convert to a table immediately. Select the text, and then in the Tables group of the Insert tab click Table ⇒ Insert Table. Word instantly determines how many rows and columns there are and presents your data in a table. Figure 9.6 shows some selected tabbed text, and a copy of that text below converted to a table with the Insert Table command. Word automatically AutoFits the new table to the width of the document, so you might need to resize columns.
FIGURE 9.6 Word easily converts a tabbed “table” into an actual Word table.
If you want control over the number of rows or columns or have text that’s delimited by something other than tabs, you can use the Convert Text to Table dialog box to perform the conversion. For example, you might have a document exported from a spreadsheet or database program as a .csv (comma-separated values) or .txt (plain text) file using delimiters. Or someone may have manually delimited a list with another character, such as an asterisk. Here’s how to make sure Word cleanly converts this type of content to a table:
FIGURE 9.7 The Convert Text to Table dialog box guesses how many rows and columns you want to create.

The Convert Text to Table dialog box can be a useful diagnostic tool when the simple text to table method presented earlier (Insert ⇒ Tables ⇒ Table ⇒ Insert Table) yields unexpected results, such as more or fewer columns than you expected. When you get the wrong table dimensions, press Ctrl+Z, investigate the data, make any corrections, and try again.
You can get the wrong number of columns if there are too many tabs (sometimes obscured as a result of formatting issues) or if some rows use spaces instead of tabs to achieve the table “look.” Display nonprinting formatting characters by clicking Show/Hide in the Paragraph group of the Home tab. You might for example find instances where multiple tabs were typed between columns. This confuses Word, which assumes there are more columns than needed. When this happens dismiss the dialog box, find and remove the extra tabs, and try again. Don’t worry about setting a properly aligned tab, because you’re converting the tabbed data into a table anyway; the table will handle the alignment for you.
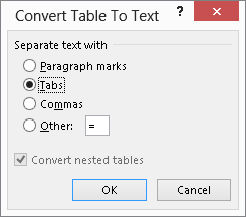
Sometimes it’s necessary or useful to convert an existing table to text. You might want to do this if the data needs to be provided to someone else in a different form. Some statistical programs will accept .csv data, but not Word tables. Or you might simply find it easier to manipulate the data in text form, and then transform it back into a table. Whatever the reason, it’s easy:
FIGURE 9.8 The Convert Table to Text dialog box prompts you to specify a delimiter for text.
As with plain text in Word, when working with a table you need to be able to make selections so that you can format or manipulate the contents. With a table, it’s common to need to select entire columns or rows so that you can apply uniform formatting to them. You also might want to move or copy information in the table, which requires a few special techniques.
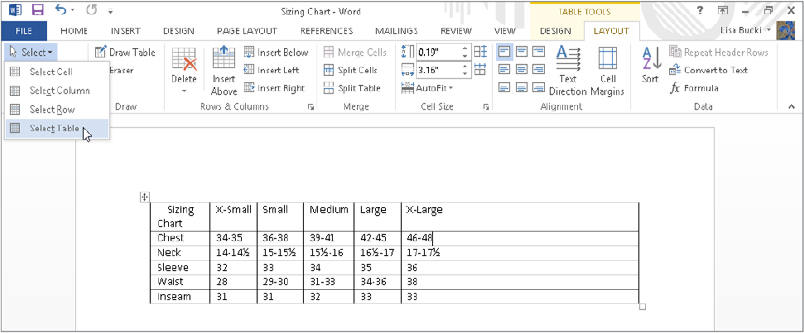
Word offers multiple techniques for making selections in tables. For example, when you want to select an entire table, you can use one of these quick methods:
FIGURE 9.9 Use the Layout contextual tab to access a number of table selection and manipulation tools.
There is also a keyboard method for selecting tables, but it’s tough to remember and to use. With the insertion point anywhere in the table, and Num Lock engaged, press Alt+Shift+5 on the numeric keypad. If Num Lock isn’t engaged, press Shift+5 on the number pad instead. You also can click in the table and use KeyTips: Press Alt, and then press JLKT, one key at a time. Another method is to use the arrow keys to move the insertion point to the upper-left cell. Press and hold Shift, and use the Down Arrow and Right Arrow keys to extend the selection highlight over all table cells.
Another table selection method involves dragging from outside the table after clicking in the table. Dragging from a location diagonally above and to the left of the table move handle down over the lower-right cell selects the entire table. Or, you can drag from outside the lower-right corner to the upper-left cell until all cells are highlighted.
To select a row without using the Ribbon, move the mouse pointer into the margin to the left of the row until it changes to a right-tilting arrow as shown in Figure 9.10, and click. Drag to expand the selection to include contiguous rows, or Ctrl+click using the Select Row pointer to select additional noncontiguous rows.
FIGURE 9.10 Word’s mouse pointer changes shape to indicate what action a click will perform.
To select a column without using the Ribbon, move the mouse pointer just above the column so that it turns into a down-pointing black arrow, and click. Again, drag to expand the selection to include additional contiguous columns, or Ctrl+click to select additional discrete/noncontiguous columns.
You also can use the Select drop-down list in the Table Group of the Table Tools ⇒ Layout contextual tab. As shown in Figure 9.9, the menu includes Select Column and Select Row commands that you can choose to select the table column or row that currently holds the insertion point.
You use the same copy and paste choices to copy a table selection as you would use for regular text. Use Copy and Paste in the Clipboard group of the Home tab, or use the Ctrl+C and Ctrl+V shortcuts.
When copying all or part of a table from one table to another, you need to consider the dimensions of the source and the target. Sometimes when you paste into the new table, the whole table is pasted into a single cell rather than individual rows or columns.
As a general rule, when you’re pasting table matter, the receiving table dimensions should match the source dimensions. If you’re trying to paste a 4 × 5 set of cells into a table whose dimensions are 6 × 8, copy the 4 × 5 source to the Clipboard, select the desired 4 × 5 location in the receiving table, and then paste. Pasting without first selecting sometimes works, but sometimes it doesn’t. The situation can get even weirder when you’re pasting between Word and Excel, so have that Ctrl+Z (Undo) command standing by.
To control what happens with respect to formatting, see the File ⇒ Options ⇒ Advanced ⇒ Cut, copy, and paste section. Use the top four pasting options to specify what happens when you paste under a variety of circumstances. If necessary, temporarily enable the desired behavior, perform the paste, and then go back to reset the defaults.
To move one or more adjacent columns within a table, select them and then drag to the desired column. Release the mouse button anywhere in the destination column. The selected column(s) will move to the position of the destination column, which will scoot to the right. To move one or more selected columns to the right of the rightmost column, drop the selection at what appears to be outside the right edge of the table. As shown in Figure 9.11, when you have nonprinting characters displayed, cell markers also appear to the right of the table’s right boundary. When moving columns to the right side of the table, drop them on those exterior markers.
FIGURE 9.11 Drag to the right of the cell markers outside the table to move a column there.
To copy one or more columns, hold the Ctrl key as you drop. The selection will be inserted at the drop point, using the same location rules that apply when you’re moving columns.
When moving a column between tables, it’s probably easier to use the Cut and Paste commands in the Clipboard group of the Home tab (or use Ctrl+X and Ctrl+V).
You can move and copy rows in the same way as columns, except with respect to the last row. The last row does not have exterior cell markers. If you drop a selection of one or more rows onto the last row of a table, the selection will be placed above the last row. If you drop it after the last row, the selection will be appended to the table, but the formatting will often change.
Instead, when you want to move rows after the last current row, drop them on the last row. Then put the insertion point anywhere in the last row and press Alt+Shift+Up Arrow to move the stubborn last row up to where you want it.
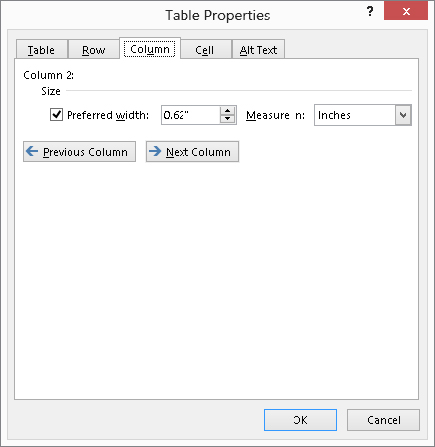
If you need to set precise table settings, click Properties in the Table group of the Table Tools ⇒ Layout contextual tab, or right-click a table and choose Table Properties to display the dialog box shown in Figure 9.12. Use the Table tab to control overall layout and behavior; use the other tabs or the mouse to control row, column, and cell characteristics.
FIGURE 9.12 Use Table Properties to control overall alignment, indentation, and positioning of tables.
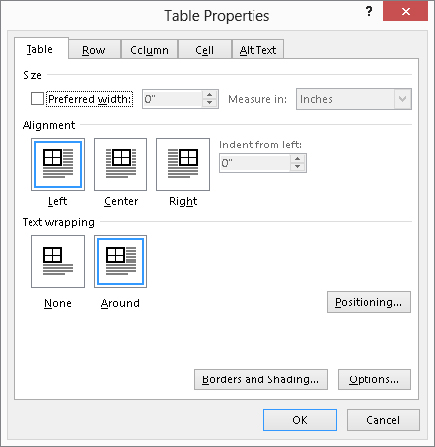
Check Preferred width and enter a measurement in the accompanying text box to set a target width for the table. The preferred width can’t be absolute, however, because tables contain text and data, and are further constrained by paper and margin settings. Note that AutoFit settings override the Preferred width.
Table alignment affects the entire table with respect to the current left and right margins. If the table extends from the left margin to the right margin, which is the default for tables inserted in Word, then the alignment controls seemingly will have no effect. This makes it easy not to notice if they’re changed. If you later narrow the table, its placement on the page might suddenly seem askew. You can be sure you’re centering a table by choosing Center under Alignment on the Table tab of the Table Properties dialog box.
The Indent from left setting on the tab controls how far the table is from the left margin. There is no Ribbon control for this setting, and it cannot be set with the ruler line.
Note that Indent from left is available only when Text wrapping is set to None and Alignment is set to Left. When Around text wrapping is enabled, use Positioning to set the distance from the left, as shown in the section that follows.
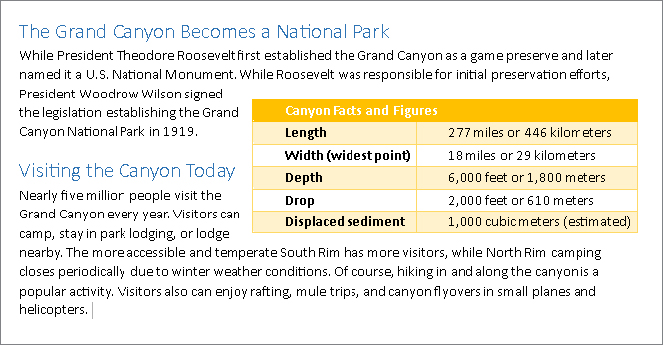
You can insert a table in line with other text, or if it is smaller than the full document width, you can move or drag it into position so that text outside the table wraps around it, as shown in Figure 9.13. To have this flexibility, change the Text wrapping setting in the Table tab of the Table Properties dialog box to Around. Dragging a table into a new position using the table move handle automatically changes the Text wrapping setting from None to Around.
FIGURE 9.13 Wrap text around tables for a more integrated appearance.
Clicking the Positioning button opens a Table Positioning dialog box. You can choose Horizontal and Vertical Position settings, and set the Distance from surrounding text for each side of the table. The Move with Text option controls whether the table’s vertical position is governed by the paragraph to which it is anchored. If Move with Text is enabled, the vertical position can be relative to only paragraph. Use this setting if the paragraph’s content and the table’s content are interrelated so that the table would not make sense except when near that paragraph. This often is the setting you want for research reports.
Turn off Move with Text if the location of the table is not logically tied to a particular paragraph. This setting might be more in keeping with the design of a brochure or a newsletter in which the table’s contents are relevant to the entire document and should appear in a particular location for aesthetic reasons.
Word tables feature several kinds of handles and mouse pointers that enable you to manipulate and select cells, rows, columns, and entire tables, for example:
In other instances, you might need to be more precise about row and column sizes. For example, if you have a document such as an annual report or a product quality testing report, it’s desirable to make column widths fairly consistent to make the report look more orderly. When that’s the case, you can use the Row and Column tabs in the Table Properties dialog box to change the size for the selected row or column:
FIGURE 9.14 Enter precise row and column heights on the Row and Column tabs.
Word 2013’s Table Tools ⇒ Design and Layout contextual tabs provide you with most of what you need to create tables that are both aesthetically appealing and functional. The Design tab tools enable you to improve the table’s appearance. The tools on the Layout tab help you ensure that the table presents information in a logical way that is meaningful to the reader.
So far we’ve looked at a number of basic tools that help you achieve the right structure for your tables. In this section we’re going to look at how to mold tables into shape and then polish them for your audience.
We all know that situations, ideas, and data change. Let’s look at how to cope with changes that impact the structure of data in a table.
All references to the Layout tab in this section refer to the Table Tools ⇒ Layout contextual tab to keep the descriptions brief. None of the Layout tab tools provide Live Preview, so carefully review the impact of any layout change and use Ctrl+Z to undo a change immediately if it doesn’t have the desired impact.
Sometimes you need to trim your tables by deleting rows or columns. Sometimes you have to delete the entire table, which is one of Word’s less intuitive processes. If you select a table and press the Delete key, the data inside the table is deleted, but the table rows and columns remain. The same thing sometimes happens when you try to delete a cell, a row, or a column.
Rather than say this a half dozen times, let’s just say it once. If you want to remove the contents of a cell, row, column, or table, select what you want to remove and press the Delete key. In the sections that follow we’ll be looking at table structure, not contents.
You can use any of the following methods to delete an entire table:
FIGURE 9.15 Delete the current cell, column, row, or table using the Layout tab’s Delete menu.
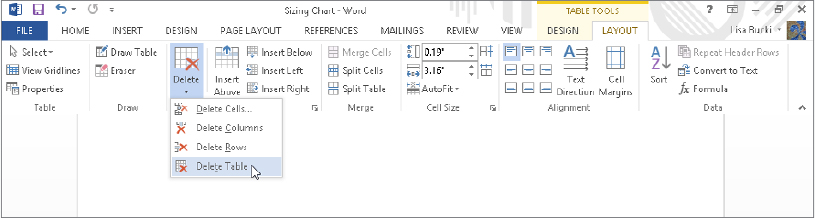
To delete the current row or column, use techniques similar to deleting the table. Select the row(s), column(s), or cell(s) and press Backspace, or choose Layout ⇒ Delete ⇒ Delete Rows, Layout ⇒ Delete ⇒ Columns, or Layout ⇒ Delete ⇒ Cells.
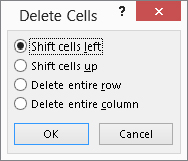
When deleting cells, Word needs a little more information. The Delete Cells dialog box shown in Figure 9.16 prompts you to specify how to shift remaining cells or whether you in fact really mean to delete the row or column. Make your selection and click OK.
FIGURE 9.16 Word prompts to find out how to handle the rest of the column or row when you delete a single cell.
To insert a row or column into a table, click in the row or column adjacent to where you want to insert, and then click Insert Above, Insert Below, Insert Left, or Insert Right in the Rows & Columns group of the Layout tab (refer to Figure 9.15), depending on where you want the new row or column to appear.
To insert multiple rows or columns you have a couple of options. Select the number of rows or columns you want to insert, and then click the appropriate insert tool. Word will insert as many rows or columns as you have selected.
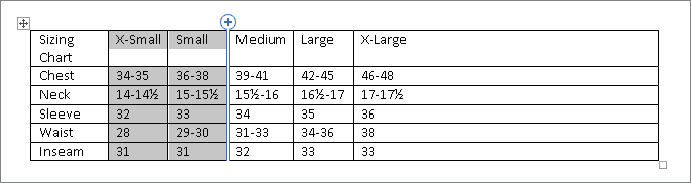
Word 2013 also includes a new method for inserting one or more rows or columns — Insert Controls. Just select the number of rows or columns to insert with the mouse, and then move the mouse pointer to the side of the selection where you want to insert the new rows or columns. (Move the pointer to the left of the selected row or above and to the right of the selected column.) As shown in Figure 9.17, the Insert Control (which looks like a divider with a plus button) appears. Click the plus to insert the specified number of rows or columns at the divider. In the example in Figure 9.17, because two columns are selected and the divider is to the right of the selection, clicking the plus would insert two new columns to the right of the selection.
FIGURE 9.17 Click the plus button that appears to insert new rows or columns in the specified position.
To insert cells, select the cell(s) adjacent to where you want the new one(s) to appear, and click the dialog box launcher in the bottom-right corner of the Rows & Columns group in the Layout tab. You’ll see a dialog box containing the identical options shown in Figure 9.16. Choose your desired action and click OK.
Sometimes you don’t particularly care how tables break across pages, but sometimes you do. When you need to keep certain rows together on a page:
To force a table to break at a particular point, move the insertion point to anywhere in the row where you want the break to occur, and then press Ctrl+Enter. Note that this doesn’t simply force the table to break at that point; it actually breaks the table into two tables. If the Repeat as header row at the top of each page setting on the Row tab of the Table Properties dialog box is enabled for the first row(s) of the original table, it won’t be inherited by the “new” table. You’ll have to copy the heading row to the new table and reinstate the setting, if needed.
Sometimes you need to merge columns, rows, or cells. For example, it’s common to merge the cells in the top row of a table to create one larger cell to hold a title for the table. Merging cells is easy. Select the cells you want to merge and click Merge Cells in the Merge group of the Layout tab (refer to Figure 9.15).
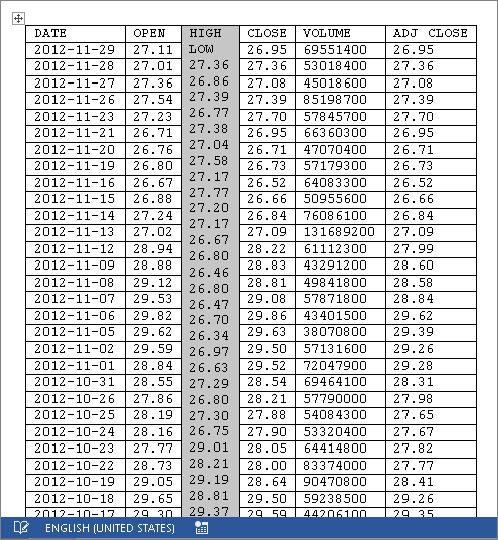
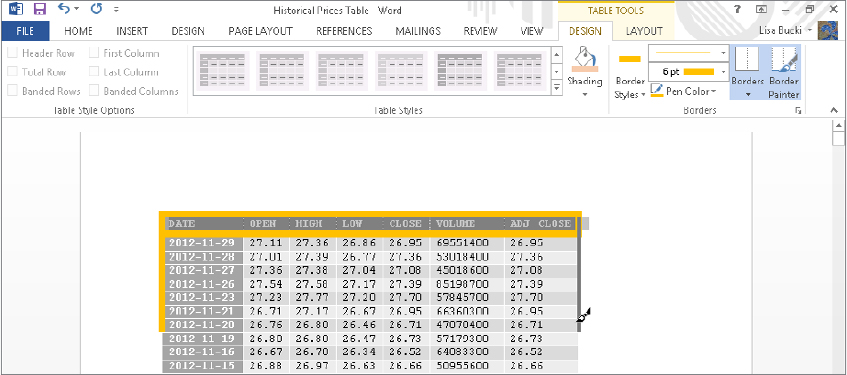
Word can’t really merge rows or columns. Suppose you need to merge the cells from two columns into a single column on each row. What you want to end up with is the same number of rows with one less column. If you select both columns and click Merge Cells, however, Word treats that as a request to merge all the cells in the selection, and you end up with one big cell with the entries jumbled together. This is illustrated in Figure 9.18. The HIGH and LOW columns were merged, resulting in one big cell of useless data. There is no way around this. To get the desired result, you would have to select the HIGH and LOW column entries on each row and merge them individually.
FIGURE 9.18 Word cannot merge into multiple cells.
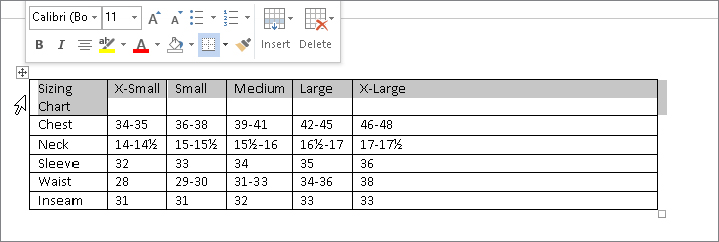
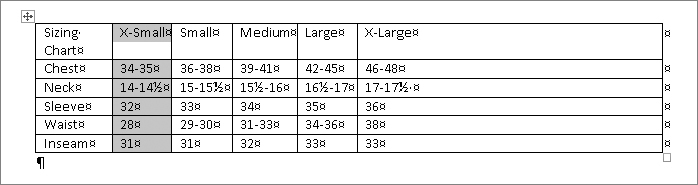
At first it seemed that one cell, row, or column was fine, but later you decide that the logic of the table layout calls for two (or more) cells where there once was one. If you split a cell that holds text, the text will remain in the left or upper-left cell in the split group. In Figure 9.19, the cell with X-Large in it was split into three cells, as illustrated by the settings in the Split Cells dialog box.
FIGURE 9.19 When you split cells, specify how many rows and columns you want to create.
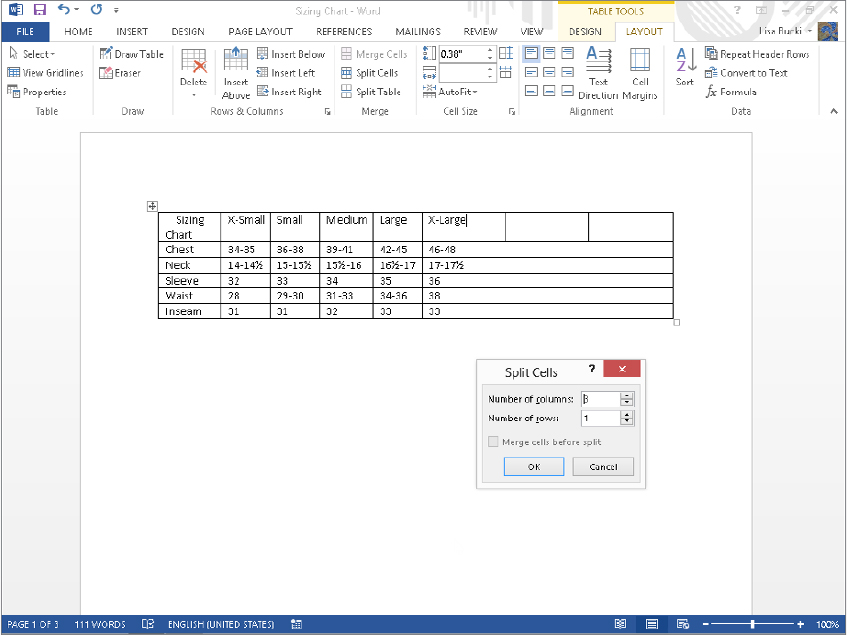
To perform a split, select the cell(s) to split, click Split cells in the Merge group of the Layout tab, make Number of columns and Number of rows entries as needed in the Split Cells dialog box, and click OK.
Horizontal splits or splits where you start by selecting multiple rows or columns are often harder to control. The trick is to make sure that items are horizontally displayed and separated either by at least two spaces or by a tab (press Ctrl+Tab to insert a tab inside a table). It can still be tedious, but it’s a bit more direct than using the dialog box, and you have more control and precision.
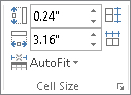
When you’re using a table to lay out a fill-in form, cell measurements sometimes have to be precise, especially when you’re trying to align a Word document with preprinted forms. When cell height and width need to be controlled precisely, click the Table Row Height or Table Column Width boxes in the Cell Size group on the Layout tab, shown in Figure 9.20. Note that cell height cannot vary for any cell within any given row.
FIGURE 9.20 Use the Cell Size group on the Layout tab to specify the precise height and width of rows and columns.
When you need rows to have a uniform height, click the Distribute Rows button to the right of the Table Row Height text box. If rows are of different heights — as sometimes happens when you’re converting part of an Excel spreadsheet into a Word table — this command determines the optimal height and equalizes the height of all selected rows or of all rows in the table if no rows are selected.
Similarly, click Distribute Columns (found to the right of the Table Column Width text box) to set selected or all columns to the same width. If different rows have different widths, this command will not equalize the whole table. It works only when all the rows have the same width. If any differ (for example, if row two is 4 inches and all the other rows are 3.5 inches, giving the table a ragged left and/or right edge), it won’t equalize them all. To remedy this, drag the right border(s) of shorter or longer rows so that they all align on the left and right.
The Alignment group of the Layout tab offers nine cell alignment options, as shown at the left in Figure 9.21. To change how the contents align horizontally or vertically within any cell, click in or select the cells you want to change, and then click the desired tool. As noted elsewhere, many users confuse cell alignment with table alignment. With the whole table selected, this tool will at most set the individual alignment of each cell and won’t have any effect on table alignment. Instead, select the whole table and use the Paragraph group alignment tools in the Home tab, or use the Alignment setting in the Table Properties dialog box.
FIGURE 9.21 Word offers nine options for cell alignment, as well as the ability to change text direction and cell margins.
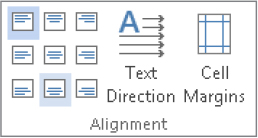
To control text direction in selected table cells, click the Text Direction tool in the Alignment group of the Layout tab. This command toggles the text between the normal horizontal layout, to text vertically aligned at the right side of the cell, to text vertically aligned at the left side of the cell. For example, you may prefer to change to one of the vertical alignments when the titles in the top row of the table are wider than the rest of the entries in the column, and you’re having trouble fitting the table horizontally on the page. Formatting the titles vertically would enable you to make the columns narrower to better fit the table on the page.
Word provides several kinds of controls for cell margins. Cell margin is the distance between cell contents and cell walls. Proper margins can keep cells from becoming too crowded and unreadable. Additional spacing can also prevent data from printing over the borders when you’re using a table to format data for printing on preprinted forms. To set cell margins and cell spacing, click Cell Margins in the Alignment group of the Layout tab, shown in Figure 9.21. This displays the Table Options dialog box shown in Figure 9.22.
FIGURE 9.22 If your table is too crowded, increase the default cell margins.
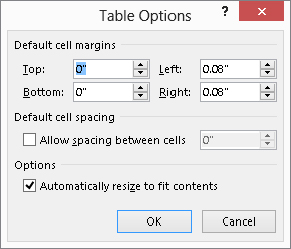
Despite the name of the Default cell margins section of the dialog box, it does not set the default cell margins or spacing for tables. It sets the cell margins only for the currently selected table, and the settings you enter apply to all cells in the table.
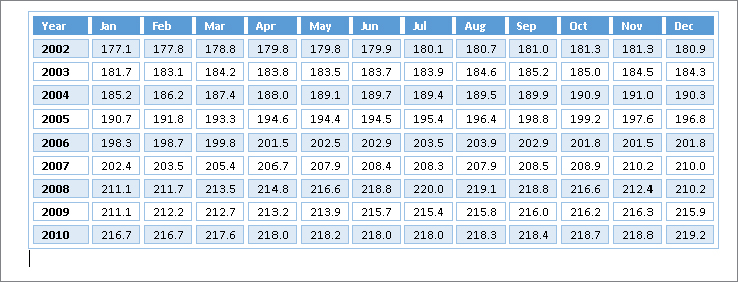
The Allow spacing between cells setting under Default cell spacing in the Table Options dialog box can be used to create the effect shown in Figure 9.23. This gives the table the appearance of having a distinct box inside each table cell.
FIGURE 9.23 Cell spacing can give tables a dramatic appearance.
When a table spans multiple pages, Word can automatically repeat one or more heading rows to make the table more manageable. When the need arises, select the target table’s heading rows (you can have multiple heading rows), and click Repeat Heading Rows in the Data group of the Layout tab. The selected heading rows are then repeated where necessary. The setting can be toggled on or off for each individual table. Because the number of heading rows can vary, this setting cannot be made the default for all tables, nor incorporated into a style definition.
Word provides a flexible and fast way to sort data in tables. To sort a table, select the first column (field) to sort by, and click the Sort button in the Data group of the Layout tab. Word displays the Sort dialog box, shown in Figure 9.24. If the table has headings in the first row at the top of each column, selecting the Header Row option under My list has does two things. First, it provides labels in the Sort by and Then by drop-down lists. Second, it excludes the header row from the sort.
FIGURE 9.24 The Sort command lets you sort by up to three fields.
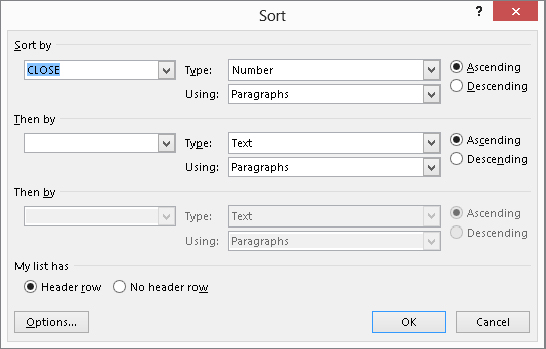
If you did not select a column before opening the Sort dialog box, select the first sort field from the Sort by drop-down list. Open the Type drop-down list and click Text, Number, or Date to match up with the type of data stored in the sort column. Choose Ascending or Descending depending on whether you want to sort from A to Z, or lowest to highest, or most recent to least recent — or vice versa for any of those. To sort by additional fields, open the two Then by drop-down lists and click a field name to include up to two of them, and set the additional type and sort order settings. Click Options to determine additional settings, including how fields are delimited (for non-table sorts), whether to make the sort case-sensitive, and the sorting language. Click OK to close Sort Options, and then click OK to apply the sort.
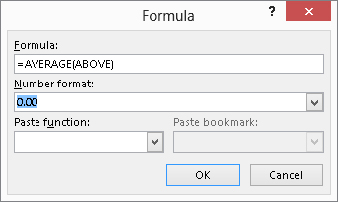
Word can perform some calculations using the Formula button in the Data group of the Layout tab (refer to Figure 9.19). To use it, first create a cell or row where you want to include formulas, and then select the first cell in which to enter a formula. Note that you only can select multiple cells when the formula will be the same in each one, such as summing all the cells above the selection. Click Formula in the Data group of the Layout tab. Edit the contents of the Formula text box. Or you can click to the right of the equals sign (=) in the Formula text box and use the Paste function drop-down list to paste in one of the predefined functions and indicate what cells to calculate between the parentheses. If needed, choose a format from the Number format drop-down list; the selection shown in Figure 9.25 formats the number with two decimal places. Click OK to insert the formula in the cell.
FIGURE 9.25 These Formula settings calculate an average and set it to display with two decimal places.
As with Excel, you also can use “cell addresses” to specify which cells to calculate on in a table; the column is column A, and the first row is row 1. Let’s say you work as a freelance personal assistant and want to create an invoice that calculates your billing based on various rates you charge for various tasks. You create a table with four columns and enter Task, Hours, Rate, and Item Total in the top row. In the second row you enter Filing, 3.25, and 10 in the first three cells. You then click in the fourth cell of the second row and display the Formula dialog box (Layout contextual tab, click Formula in the Data group). Edit the Formula text box entry to read =B2∗C2, because you want to multiply the values in the second and third columns (Hours times Rate) to get the Item Total for the row. Choose a format with the dollar sign and two decimals from the Number format drop-down list, and click OK. The correct total of $32.50 displays for that row. In the next row, you could enter the next Task, Hours, and Rate values, and then use the Formula dialog box to create a formula in the fourth column that calculates =B3∗C3, incrementing the row number in the formula for each new row. Then, to create an overall total in the final row, you can enter Total in the third column, and in the fourth column use the Formula dialog box to enter an =SUM(ABOVE) formula, formatted as currency like the formulas above it.
Unfortunately, you cannot copy or fill formulas across a row or down a column and have the addresses increment (as relative cell addresses in Excel do); you have to insert a new formula in each individual table cell, or copy a formula with Excel-style cell addressing and then edit the field and change the cell addresses. If you use Word for math, double-check all calculations using a calculator or Excel. But if you have Excel and you need complex math in tables, then use Excel. You can then link the results to Word.
As you might imagine if you’ve done any work with Excel, you can create more complicated formulas in Word by using parentheses to group multiple functions and calculations. To redisplay the Formula dialog box to edit a calculation, click in the calculation so you see gray shading behind it. And use Layout ⇒ Data ⇒ Formula to redisplay it.
Word 2013 provides a number of powerful tools to help you quickly enhance the look and feel of your tables. One of these tools, Table Styles, features Live Preview. In this section we’ll look only at the features contained in the Table Tools ⇒ Design contextual tab, shown in Figure 9.26.
FIGURE 9.26 The Design contextual tab provides access to six Table Style Options and a gallery of Table Styles.
Word 2013’s refreshed and updated preset table styles enable you to change the look of any table with just a few clicks. Table styles provide a wide variety of formatting that you can preview live in your table. You can use styles to ensure a consistent, professional look when you include multiple tables within a single document. You can also modify a table style and save the modified versions for later use.
To apply a table style, click anywhere in the table to format, and then click the Table Tools ⇒ Design contextual tab (from here referred to as the Design tab for simplicity). In Table Styles, hover the mouse over various styles and observe the changes to your table. As you move the mouse, tooltips display the name of the selected table style (such as Plain Table 1), as shown in Figure 9.27.
FIGURE 9.27 As you move the mouse over various table styles, the currently selected table displays a Live Preview of the formatting.

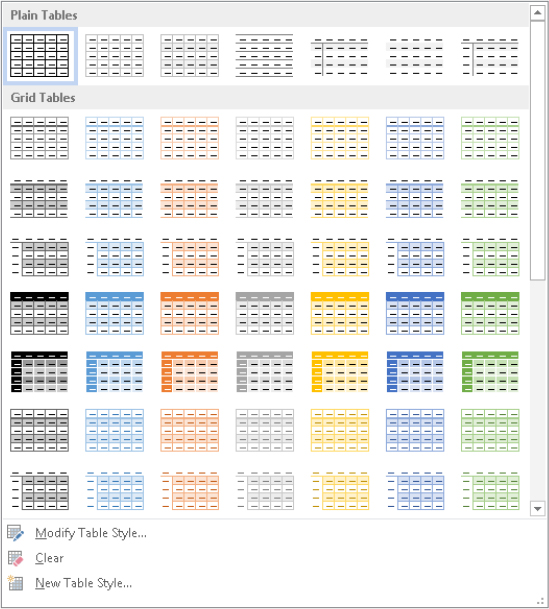
If you see a style you like, click it to apply it to your table. If it’s not perfect you can modify it. If you don’t see a style you like, click the More button to the right of the table styles. Word displays the full Table Style Gallery, showing Plain Tables, Grid Tables, and (if you scroll down) List Tables categories of table styles, as shown in Figure 9.28. Move the mouse pointer over additional styles to preview their look on your table, and then click the style to apply. Note that you can click Clear near the bottom of the gallery to remove a previously applied table style.
FIGURE 9.28 The Table Styles gallery enables you to test-drive dozens of built-in table styles.
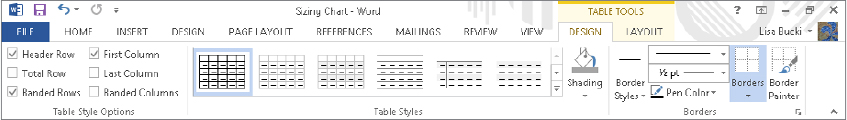
The Table Style Options group at the left end of the Design tab provides access to six options, shown in Figure 9.26, that you can apply to your table. For some of these to work, you have to apply a table style that includes shading rather than trying to use them with the plain Table Grid style that is the default for newly inserted tables. After you apply an overall table style, click to check to apply Table Style Options to your tables, or remove checks to turn the corresponding features off:
You can apply shading (a background fill color) to individual cells, rows, columns, or to a complete table. You can use shading sometimes to draw attention to one or more elements of a table. For example, if you added a row with calculated averages to the bottom of a table, you might want to call attention to that data with special shading. It’s also common to use shading to set off a title row or column.
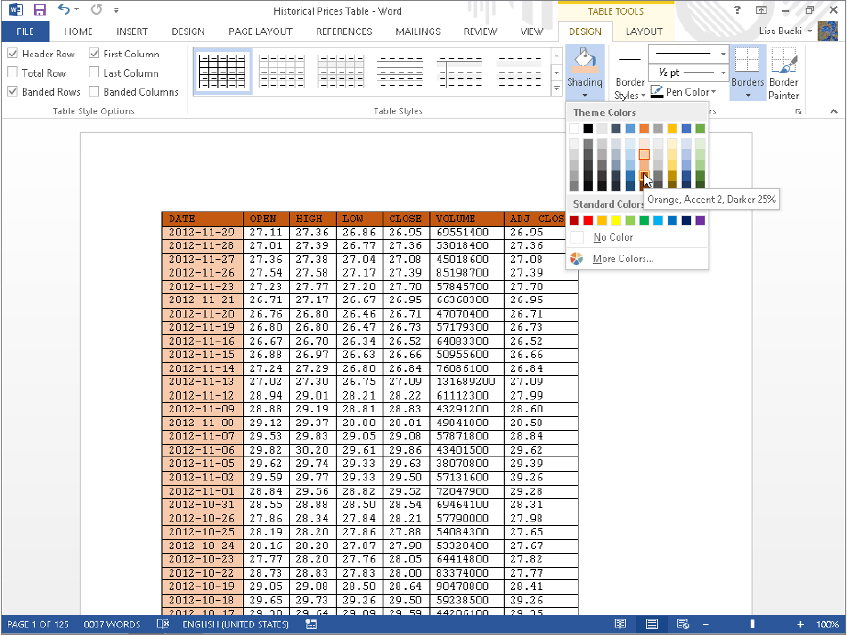
Select the cells, rows, or columns to shade, and then click Shading in the Table Styles group of the Design tab. Live Preview works with the Shading gallery, as shown in Figure 9.29. Move the mouse pointer over a color to preview it on the selection, and then click when you’re ready to apply a color. Figure 9.29 shows light shading applied to the left column of a table, with darker shading being previewed in the top row. Note that when you apply Theme Colors as your shading choices, those colors automatically update whenever you apply a new theme to the document. Use the More Colors command to apply colors that won’t change when you change the theme.
FIGURE 9.29 Live Preview works with the Shading choices.
To modify the table style applied to the selected table:
FIGURE 9.30 Use the Modify Style dialog box to make changes to a table style.
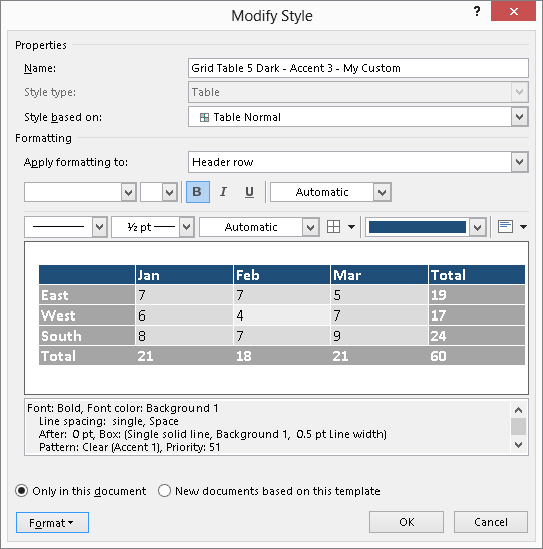
If you want to create a new style rather than modify one of the existing ones — which is a good choice when you want to keep all the original table styles intact — click the New Table Style choice at the bottom of the Table Styles gallery. The Create New Style from Formatting dialog box that appears has the same settings as those in the Modify Style dialog box shown in Figure 9.30. Enter a table Name, and then open the Style based on the drop-down list to choose an existing table style to serve as the model or base for your new style. Make formatting adjustments as described in Steps 3 and 4 here, choose where to store the file, and then click OK to finish creating your new style. The new style will appear in a category named Custom at the top of the Table Styles gallery.
Border lines separate a table into cells, rows, and columns. You’ve seen in other chapters that borders are not unique to tables, and can be applied to characters and paragraphs as well. They also can be applied to other Word document elements, such as text boxes, frames, and graphics. Any of the border tools can be used to control borders in tables. None of the border tools offer Live Preview, although the Borders and Shading dialog box does provide a generic preview.
You have two strategies for working with borders. You can launch the Borders and Shading dialog box. For a detailed description of how to apply borders using the Borders and Shading dialog box, see the “Borders and boxes” section in Chapter 6, “Paragraph Formatting.”
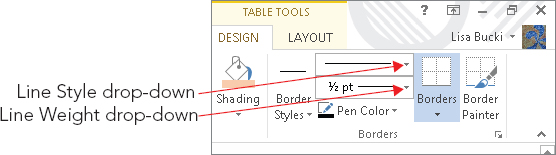
The second strategy uses an ad hoc approach, by using the Border Styles, Line Style, Line Weight, Pen Color, and Borders tools in the Design tab, shown in Figure 9.31. Use the border formatting tools together to change borders:
FIGURE 9.31 Use the Borders Styles tool and its friends to make ad hoc changes to table borders.
Once you’ve applied a border style you like to selected cells, you can use Word 2013’s new Border Painter tool to copy it to other selections, as shown in Figure 9.32. Click Border Painter, and then drag the painter mouse pointer to apply the specified border to cell, row, and column boundaries. Press Esc to turn the Border Painter off when finished.
FIGURE 9.32 When the Border Painter is active, drag to copy border settings to other table locations.
The table eraser removes parts of tables. It doesn’t merely remove border lines; it deletes the cell boundaries in a table where you specify. You can use the table eraser to turn interior cells into a larger interior cell. Be careful, though. If you try to delete a table’s upper-left cell, you might instead delete the whole top row of the table.
To use the table eraser, click in a table and then click Eraser in the Draw group of the Table Tools ⇒ Layout tab. Click on cell boundaries to remove as needed. (Remember to press Ctrl+Z immediately if you inadvertently click the wrong border.) To dismiss the eraser, either click the Eraser tool again to toggle it off, or press Esc. The eraser also deactivates if you click outside a table (in regular text).
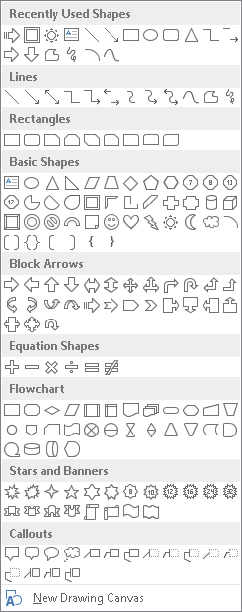
In addition to adding a table and inserting other types of graphics such as pictures (which you’ll learn about next) into a document, you can insert a predefined shape. To add a shape to the current page of the document:
FIGURE 9.33 Insert a shape from the Shapes gallery.
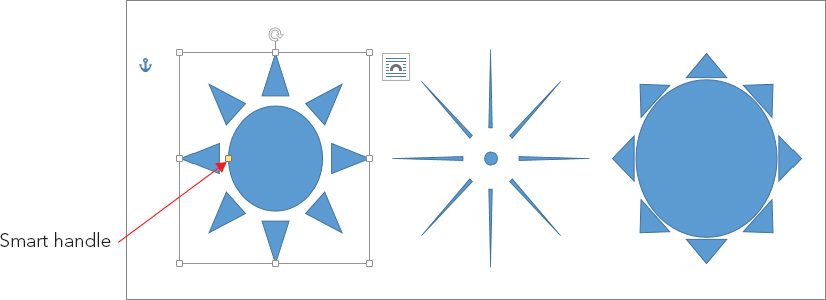
Formatting a shape resembles formatting a picture and other types of graphics, which you’ll learn more about later in the chapter. The key difference is that the commands for formatting a shape are found on the Drawing Tools ⇒ Format contextual tab rather than the Picture Tools ⇒ Format tab. One big difference in formatting options has to do with the overall composition of the shape. In most cases, when you insert a shape and select it by clicking it, one or more yellow handles appear along with the regular selection handles. You can drag these handles to redefine the proportions of individual aspects of the shape within the overall shape boundary. For example, Figure 9.34 shows three copies of the same shape. The left one shows how the shape appeared when originally inserted. It is selected, and the yellow smart handle appears at the left side of the circular center. In the middle copy I dragged the smart handle as far toward the center as possible. In the right copy, I dragged the smart handle as far away from the center as possible.
FIGURE 9.34 Use any yellow smart handles that appear to redefine the internal proportions of the shape.
You can insert pictures in Word in several ways, using pictures from a variety of graphics formats. If you have pictures on removable media — such as SD (secure digital), CF (compact flash), CD, DVD, or USB drive — it’s usually best to copy those pictures to your hard drive before you proceed. Although you can insert directly from such sources, or from a network location or over the Internet, you have more options available to you if the files are on your own computer in a location that is always accessible.
You might also have pictures available from a webcam, another camera, or a scanner connected to your computer. To use pictures from these types of devices, save the images to your hard drive first.
Though it’s not necessary, you often can save time when pictures, sounds, and other files are where Word and other programs expect them to be. In the case of pictures, the expected location is your Pictures Library (or the My Pictures folder, which the Pictures library in Windows 7 or 8 integrates by default).
To insert a picture at the current insertion location in a document:
FIGURE 9.35 When you insert a picture, the Pictures Library contents appear first.
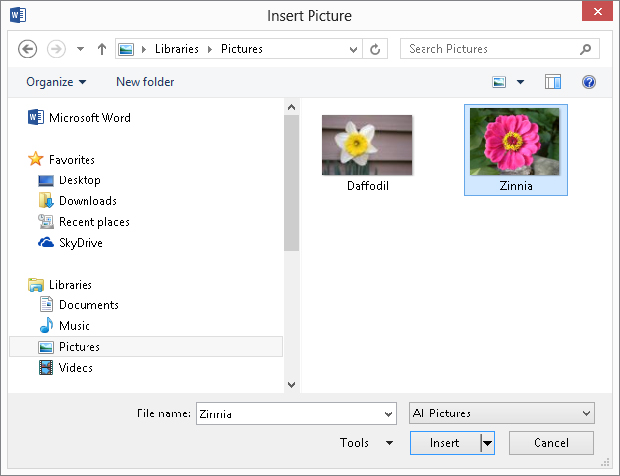
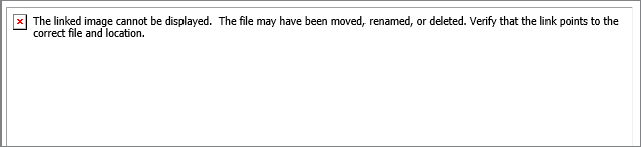
FIGURE 9.36 If you rename, move, or delete a linked picture file, Word will not be able to display it.
If the picture you want doesn’t appear in Word’s Insert Picture dialog box but you know it should be in the current folder, click the All Pictures button in the lower-right corner, and in the list of choices shown in Figure 9.37 click the desired picture (graphic) file format to narrow the list of displayed pictures to ones that match the selected type.
FIGURE 9.37 Word supports a number of popular graphics file formats.
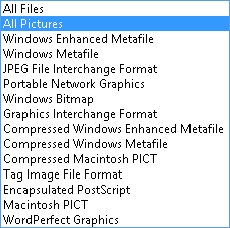
The most popular picture format, used by most digital cameras, is JPEG, which stands for Joint Photographic Experts Group (so if you didn’t know before, you do now). Word 2013 comes with a converter that supports JPEG files, which can have a .jpg or .jpeg file name extension. Other Word 2013–supported popular formats include Graphics Interchange Format (.gif), which is heavily used on the Internet due to its support for transparent backgrounds, which makes such images better suited for web page design; Portable Network Graphics (.png), also heavily used on the web due to its support for transparency; Tagged Image File Format (.tif or .tiff); Windows Metafile (.wmf); Enhanced Metafile (.emf); and Windows Bitmap (.bmp).
If your file format isn’t supported natively by Word 2013, your best bet might be to open it in the program originally used to create it, if available, and use Save As to convert it to a graphic file format that Word supports, such as JPEG. This is especially true if you created the image in a relatively esoteric type of design/drafting software or something like that. You could also search the web for a freeware or low-cost graphics editing program that can convert the desired file format; check the program’s capabilities carefully before buying. The freeware program Gimp (www.gimp.org) can open and save to a number of different graphics file formats, as can IrfanView (download.cnet.com/IrfanView/), another freeware graphic program.
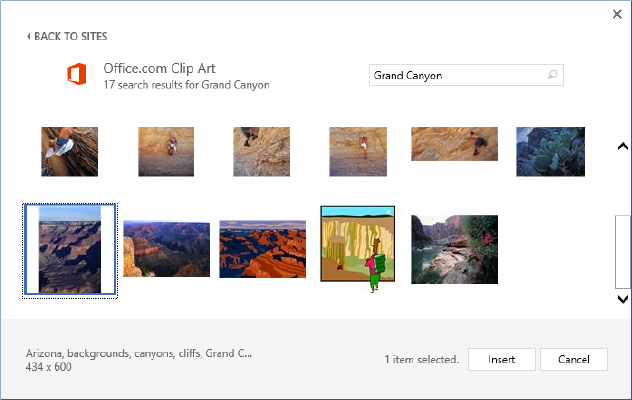
Prior versions of Word included a locally stored collection of clip art images that you could insert through a Clip Art pane or gallery. Word 2013 does away with that functionality, replacing it with a streamlined Online Pictures tool that enables you to find and insert pictures and clipart from Office.com, Bing Image Search, your SkyDrive, or Flickr. (It wouldn’t be surprising to see other social media/sharing services added in future updates.)
This section shows you how to search for and select an image from Office.com. The benefit of choosing Office.com over Bing Image Search is that Office.com offers royalty-free images for use in your projects free of charge. (According to 8.1 in the Microsoft Services Agreement, http://windows.microsoft.com/en-US/windows-live/microsoft-services-agreement, you simply can’t resell the pictures or any project that relies primarily on them. For example, you might get into trouble if you downloaded an image from Office.com, made 8 × 10 color printouts of it, and then tried to frame them and sell them as art.) Images on Bing Image Search are released under the Creative Commons licensing scheme. This means that the owner of each image or illustration determines the particular licensing. For example, a Creative Commons Attribution-Share-Alike 3.0 License requires that you give credit (attribution) as specified by the creator anywhere you use the image or illustration, and that you share any derivatives or alterations of the work under the same license. When you select a picture or illustration after using Bing Image Search, the information should include a link that you can click to find out about the Creative Commons licensing for the selected item. The Flickr choice enables you to connect with images you’ve stored in your flickr.com account.
Here’s how to find and insert an image from Office.com in a document:
FIGURE 9.38 Use the new Insert Pictures feature to find and download images from Office.com and more.
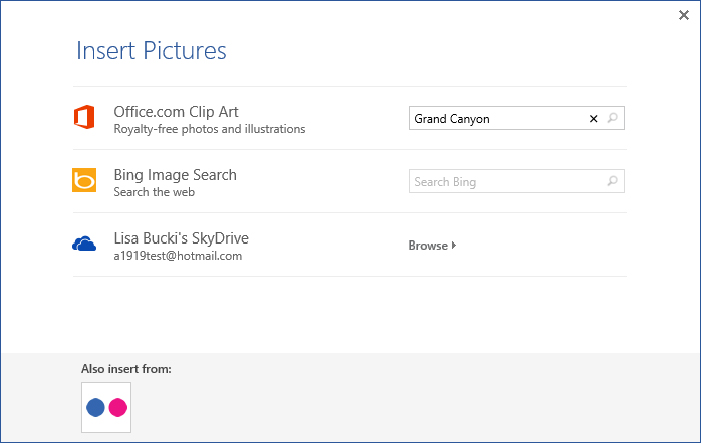
FIGURE 9.39 Select the image or illustration you want to insert, and then click Insert.
The process for finding a picture with Bing Image Search is similar to the above, except in Step 3 you would type the search term in the text box to the right of Bing Image Search, instead. Then run the search. To insert a picture from your SkyDrive from the Insert Pictures window, make sure you are signed in to Word using your Microsoft account. Open Insert Pictures, and click Browse to the right of your SkyDrive. The window displays the folders in your SkyDrive, including the Pictures folder. Click a folder to display its items, click an image to insert, and then click the Insert button.
It may not always be the case that the source image is one stored on your hard disk. You may want to grab an image out of a document you’ve received from another user and reuse it yourself, or you may have downloaded a PDF file with an image you’d like to reuse. Or you may want to take a picture of what you’re doing in another Office program to include in the current document. Let’s see how that works.
You can also insert pictures from the Clipboard and from your Internet browser (usually, but not always). To use the Clipboard, display the picture in any Windows program that supports graphics, and use that program’s controls to select and copy the picture to the Clipboard. If all else fails, try selecting the picture, right-clicking it, and choosing Copy or Copy Picture. Then, in Word, move to where you want to insert the picture, and press Ctrl+V (or click Paste in the Clipboard group of the Home tab). After you paste an image, a Paste Options button appears; if the picture includes any added formatting, you can use the Paste Options to determine whether to keep the original formatting or merge formatting.
Sometimes the copy-and-paste method works from Internet Explorer, Firefox, Google Chrome, and other popular browsers — other times not. When the Clipboard method fails, or when you want a copy of the file itself (not simply the embedded version in a Word document), you can try several things.
In Firefox, right-click the picture and choose Save Image As. In Save Image, navigate to where you want to store the file, accept the name shown or type a new one (no need to type an extension — Firefox automatically supplies it), and click Save. In the Windows 7 or Windows 8 Desktop version of Internet Explorer, right-click the picture and choose Save picture as. Again, navigate to the desired location, specify a file name, and click Save. In the new Windows 8 Internet Explorer app (launched from the Start screen), start the process by right-clicking the picture and clicking Save to picture library.
There are a number of ways to find pictures on the Internet, from surfing to explicitly searching. Google itself has an Image Search feature. From Google’s home page, click Images. In the Image Search page, type the search text (enclose in quotes to search for a whole name), and click Search Images. Another common technique is to include the word “gallery” in the search, although these days you’d probably find a lot of Office 2013 gallery hits! In addition to enabling you to store your own pictures, Flickr enables users to share pictures and make them available for download. It even has a special section of images released under the Creative Commons licensing scheme at http://www.flickr.com/creativecommons/.
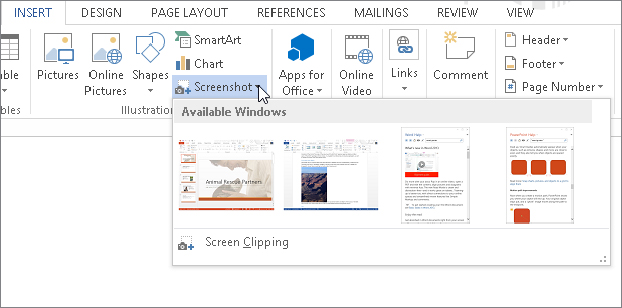
Windows itself has long offered the built-in ability to copy a picture of what’s on-screen to the Clipboard via the Print Screen or Shift+prnt scr shortcut keys. Word 2013 (and some of the Office applications) builds on this feature by enabling you to insert a screen shot of other open Office file windows — including Help windows — directly into Word. You might want to take advantage of this feature if you are writing how-to instructions about a task for a colleague, or if you want to show data from an Excel workbook and don’t feel that you need to be fussy about copying and pasting specific cells. To snap a screen shot in Word:
FIGURE 9.40 Insert a picture of another open Office window in the current document.
After you insert a picture or other graphic into the document, you can use a plethora of tools in Word 2013 to position, style, and otherwise work with the image to integrate it into your document in the most attractive way possible. For example, this section covers the various text wrapping options and their implications.
Wrapping is the term used to classify the various ways in which pictures (as well as other graphics) appear relative to the text in a Word document. It helps to understand that a Word document has several different layers. Where you normally compose text is called the text layer. There are also drawing layers that are both in front of and behind the text layer. A graphic inserted in front of the text layer will cover text up, unless the graphic is semitransparent, in which case it will modify the view of the text. Graphics inserted behind the text layer act as a backdrop, or background, for the text.
Additionally, there is the header and footer layer. This is where headers and footers reside. This area is behind the text area. If you place a graphic into a header or footer, the graphic will appear behind the text. Dim graphics placed in the header and footer layer often serve as watermarks. Sometimes the word CONFIDENTIAL will be used in the header and footer layer, branding each page of the document as a caution to readers.
The Wrap Text setting determines how graphics interact with each other and with text. Table 9.1 describes the available Wrap Text settings. Knowing how you plan to position a picture should determine the wrapping setting. Wrapping effects and typical uses are shown in Table 9.1. Wrapping comes in two basic flavors: In Line with Text (in the text layer) and floating (in the graphics layer, which includes the other six wrapping formats listed in Table 9.1). Floating means that the picture can be dragged anywhere in the document and isn’t constrained in the way that pictures in the text layer of the document are.
TABLE 9.1 Wrap Text Setting
| Wrapping setting | Effect/application |
| In line with text | Inserted into text layer. Graphic can be dragged, but only from one paragraph marker to another. Typically used in simple presentations and formal reports. |
| Square | Creates a square “container” in the text where the graphic is. Text wraps around the graphic, leaving a gap between the text and the graphic. The graphic can be dragged anywhere in the document. Typically used in newsletters and flyers with a fair amount of white space. |
| Tight | Effectively creates a “container” in the text where the graphic is, of the same shape as the overall outline of the graphic, so that text flows around the graphic. Wrapping points can be changed to reshape the “hole” that the text flows around. The graphic can be dragged anywhere in the document. Typically used in denser publications in which paper space is at a premium, and where irregular shapes are acceptable and even desirable. |
| Behind text | Inserted into the bottom or back drawing layer of a document. The graphic can be dragged anywhere in the document. Typically used for watermarks and page background pictures. Text flows in front of the graphic. Also used in the assembling of pictures from different vector elements. |
| In front of text | Inserted into the top drawing layer of a document. The graphic can be dragged anywhere in the document. Text flows behind the graphic. Typically used only on top of other pictures or in the assembling of vector drawings, or when you deliberately need to cover or veil text in some way to create a special effect. |
| Through | Text flows around the graphic’s wrapping points, which can be adjusted. Text is supposed to flow into any open areas of the graphic, but evidence that this actually works is in short supply. For all practical purposes, this appears to have the same effects and behavior as Tight wrapping. |
| Top and bottom | Effectively creates a rectangular “container” the same width as the margin. Text flows above and below, but not beside, the graphic. The picture can be dragged anywhere in the document. Typically used when the graphic is the focal point of the text. |
To set the wrapping behavior of a graphic, click it and then click the Wrap Text button in the Arrange group of the Picture Tools ⇒ Format tab. Choose the desired wrapping from the list menu, as shown in Figure 9.41. The Square wrap setting was previously applied to the selected picture in Figure 9.41.
FIGURE 9.41 Wrapping behavior determines where you can position a picture or graphic in Word.
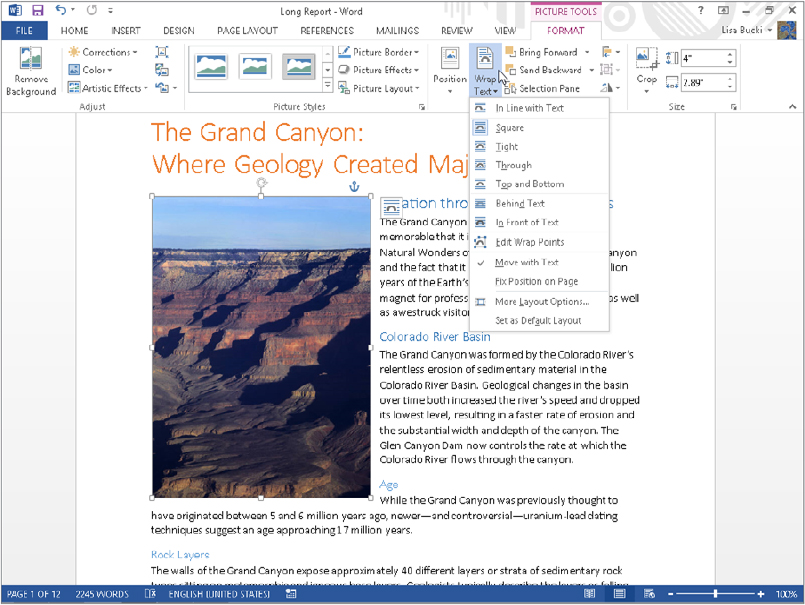
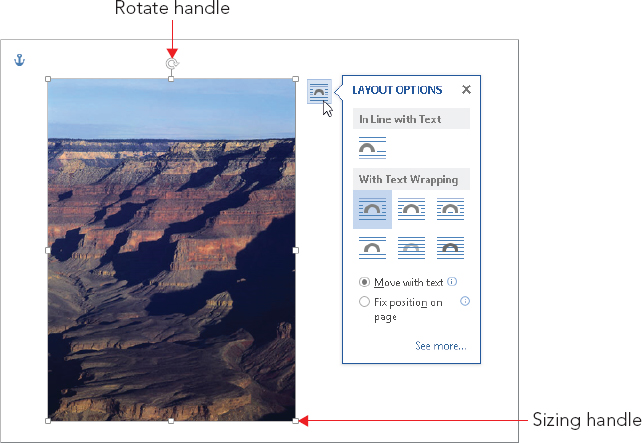
In Word 2013, you also can click the Layout Options button that appears to the right of a selected picture or graphic to access Text Wrapping settings in a flyout, as shown in Figure 9.42. You can click one of the wrap settings under In Line with Text or With Text Wrapping to change the wrapping. Clicking See more opens the Layout dialog box; you can use the settings on the Position tab to set a precise Horizontal and Vertical location on the page for the selected graphic, or the Text Wrapping tab to set more general wrapping options. For example, you can use the Distance from text settings to control the white space between the wrapped graphic and surrounding text.
FIGURE 9.42 The Layout Options button also enables you to work with text wrapping.
You can also change the default Wrap Text setting. In most cases, having a graphic appear in line wastes space and can interrupt the flow of the text, especially if you weren’t precise about positioning when you inserted a graphic. To set the default wrapping style for most graphic objects you insert, paste, or create, choose File ⇒ Options ⇒ Advanced. In the Cut, copy, and paste section, click the Insert/paste pictures as drop-down list arrow, and click the desired default Wrap Text setting. Then click OK.
You should note that when you insert shapes, Word applies the In Front of Text Wrap Text setting by default. If you copy a picture from one part of a document and paste it elsewhere, the copy inherits the wrapping style of the original picture, and won’t use your default.
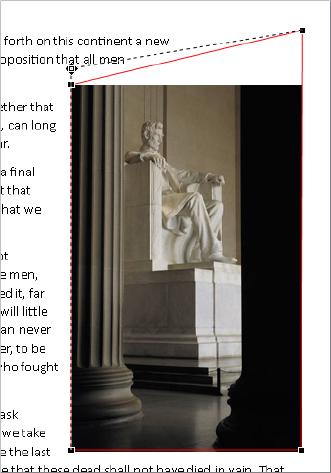
When you’ve applied some of the Wrap Text settings to a picture or an object, you can change the wrap points. The wrap points are special handles that enable you to alter the wrapping boundaries for a graphic. Moving the wrap points further away from the graphic puts more space between the graphic and the text. For example, you might move the top corner wrap points for a photo up to add white space above the photo. To edit the wrap points for a graphic:
FIGURE 9.43 Move wrap points to change the way text flows around a picture.
The Position gallery in the Arrange group of the Picture Tools ⇒ Format tab (or the Drawing Tools ⇒ Format tab) enables you to skip moving a picture or graphic and setting wrapping on your own and just have Word handle it for you. Select the object to move into position, and then click Position in the Arrange group. A gallery of choices appears. Click one of the choices under With Text Wrapping to move the picture to the specified location on the current page.
You can move any graphic by dragging it, and some graphics can be dropped anywhere in the document. Graphics with Wrap Text (from the Arrange group in the Format contextual tab) set to In Line with Text, however, can be dropped only at a paragraph mark. All other graphics (in other words, those with wrapping settings that enable them to “float”) can be dragged and dropped anywhere. To drag a graphic, click to select it, and then drag it where you want it to go.
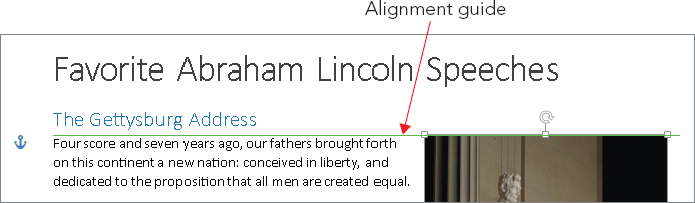
Word 2013 now provides a more real time preview of how your document will look as you move and resize objects. The live layout feature causes text to reflow around a wrapped graphic as you move it around. For example, this can be important if you have automatic hyphenation turned on and want to choose a position for the graphic that causes the least hyphenation. Live layout works hand in hand with the new alignment guides feature. One or more alignment guides appear when you drag a graphic and it reaches a position where it lines up with text, such as the top of a paragraph as shown in Figure 9.44, or the left margin, right margin, or center point of the page. If you release the mouse button when an alignment guide appears, chances are the graphic will land in a more pleasing position than you might achieve if purely aligning by eyeball. This method is also faster than using the Layout dialog box to align to the left or right margin.
FIGURE 9.44 Alignment guides appear as you drag a graphic to enable you to align it precisely with text or other graphics.
You can also nudge a selected floating graphic. Select it, and then use the arrow keys on the keyboard to move it a small distance in any of the four directions. Nudging works well for precise alignments, but alignment guides do not appear when you use this feature, so you will have to go by eye.
To drag in discrete steps using Word’s built-in alignment gridlines, hold the Alt key as you drag, and drag slowly. You will see the graphic jump in small increments as it snaps to the grid. If you display the gridlines by checking Gridlines in the Show group of the View tab, however, Alt-dragging works in reverse, making Word ignore the grid. With the grid displayed, arrow key nudging also changes. Now the arrow keys move the picture in grid increments. Press the Ctrl key to nudge in smaller gradations.
The vertical and horizontal gridlines are an eighth of an inch apart, so nudging in any direction with the gridline displayed moves the graphic 1/8 inch at a time. Note that when gridlines are displayed, they will display in all open documents.
Resizing changes the physical dimensions of the picture or other graphic as it is displayed in your document. Resizing in Word will not make the associated file (or the image stored in the .docx file) any larger or smaller. If you make it smaller and then later make it larger, you still retain the original file resolution.
Cropping refers to blocking out certain portions of a picture by changing its exterior borders. You can crop out distracting or unnecessary details. Again, cropping in Word does not affect the actual picture itself, only the way it is displayed in Word. The fact that Word doesn’t change the actual image is a big plus, because you can undo the cropping if you later change your mind.
You can resize a picture by typing the measurements or by dragging. To resize by dragging, click on the picture and then move the mouse pointer so that it’s over one of the eight sizing handles (refer to Figure 9.42). The mouse pointer changes into a double arrow. Drag until the picture is the desired size and then release the mouse button. Note that dragging the corner handles maintains the aspect ratio of the picture, whereas dragging the side handles can be used to stretch or compress the picture.
Hold down the Ctrl and/or Alt keys while dragging to modify the way resizing occurs:
You can combine these options. For example, holding down the Alt and Ctrl keys at the same time while dragging a sizing handle slowly forces Word to resize in discrete steps while resizing from the center.
To specify an exact picture or graphic size, select the entry in the Shape Height and/or Shape Width text boxes in the Size group at the right end of the Picture Tools ⇒ Format tab (or Drawing Tools ⇒ Format tab) of the Ribbon. Type a new value, and press Enter. By default, these settings maintain the aspect ratio automatically, so if you enter a new Height and press Enter, the Width adjusts accordingly. To be able to change the picture proportions via the Size group settings, click the dialog box launcher in the Size group. Remove the check next to Lock aspect ratio on the Size tab of the Layout dialog box, and then click OK. (Note that for shape graphics, Lock aspect ratio is turned off by default, so the default setting differs depending on the selected object.)
Use the rotate handle with the circular arrow icon above the top center resizing handle (refer to Figure 9.42) to rotate a picture. Select the picture and drag the handle in the direction in which you want to rotate the picture. You also can rotate a selected picture using arrow key shortcuts. Pressing Alt+left or right arrow rotates the picture. If you add Ctrl key and press Ctrl+Alt+left arrow or Ctrl+Alt+right arrow, the rotation happens in smaller increments.
If you click the Position tab of the Layout dialog box, additional options of interest include the following:
To crop a picture, click the Crop button in the Size group in the Picture Tools ⇒ Format tab. Cropping handles appear on the selected picture. Move the pointer over any of the eight cropping handles, and when it changes shape to match the handle, drag to remove the part of the picture you want to hide. Click outside the picture to finish applying the crop. Note that pressing the Alt key while dragging slowly crops in discrete steps.
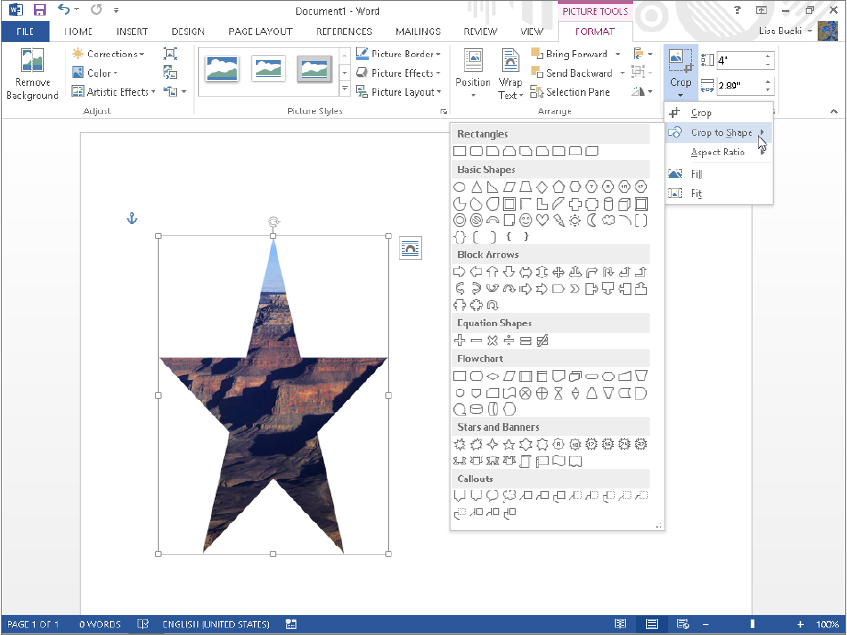
Clicking the down arrow on the bottom of the Crop button reveals other options for customized cropping. You can click Crop to Shape and then click one of the shapes in the gallery that appears to crop the picture to fit within the specified shape, as in the star example in Figure 9.45. Use the Aspect Ratio option to crop the image to standard proportions, such as 1:1 to square the image or 3:5 for a portrait (tall) image. Cropping all the images in a document to the same aspect ratio can lend a more consistent appearance. You can also use the Fill and Fit commands to resize the image within the current picture area. Fill generally snaps the picture back to its original aspect ratio, which may undo the crop depending on how it was applied, and Fit shrinks the picture so previously cropped areas redisplay at a smaller size within the picture area.
FIGURE 9.45 Crop to hide part of a picture or to change its overall shape.
You don’t have to settle for a picture’s original appearance when you insert it into a document. Word offers a variety of tools for making formatting adjustments. Applying uniform styles and effects to the pictures and other graphics in a document creates a unified look. This is the kind of approach that graphic designers use to create the brand identity for a magazine, for example. Here you learn how to find the settings you need to update the appearance of pictures and other graphics in your documents. Word offers dozens of changes that you can apply, so much so that every feature cannot be covered in detail here. Taking the time to explore the settings introduced here can help you make a document’s graphics even more interesting.
Double-clicking one of the items in the Picture Styles of the Format tab enables you to apply any of a number of preset styles to the selected picture. The styles include various combinations of frames or borders, cropping, glows, shadows, and more. After selecting the picture, click the More button to display all of the gallery’s choices. You can move the mouse over each style to see a Live Preview of it on the selected picture (or pictures). Note that the speed of Live Preview may be heavily affected by the size of the graphic file. If the picture is 2 MB, Live Preview is going to be a lot slower than if the file were only 50 KB. When you find the style that you prefer, click it to apply it to the picture.
You can apply a basic color border to a selected picture using the Picture Border button in the Picture Styles group of the Picture Tools ⇒ Format tab. (For a shape, you would use the Shape Outline tool in the Shape Styles group of the Drawing Tools ⇒ Format tab.) You have the option of using the drop-down that appears to change three settings for the border:
Click the No Outline choice in the Picture Border drop-down to remove any previously applied outline.
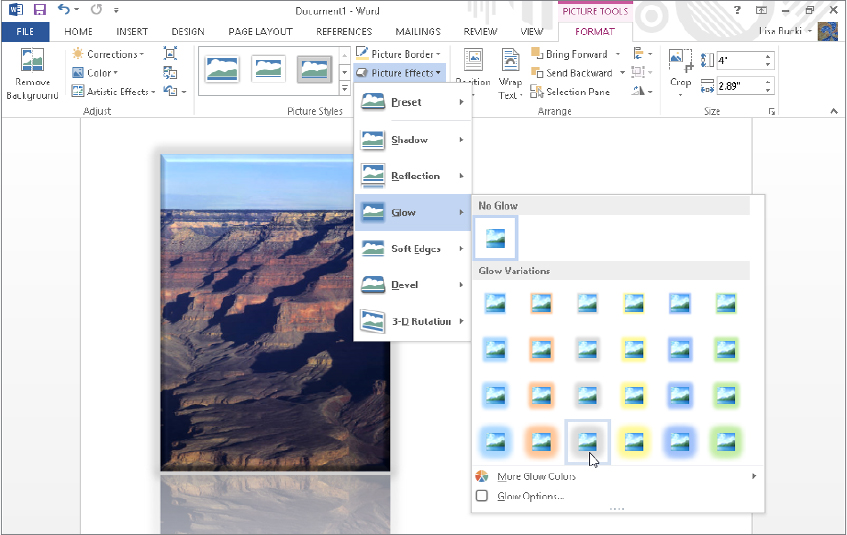
You can apply and refine additional effects with the Picture Effects tool, also located in the Picture Styles group. You can choose one of the Preset choices that combines effects, or apply any combination of individual effects that you prefer. In Figure 9.46, the picture already has a Reflection choice and a Bevel choice applied, and the Live Preview shows a potential Glow effect.
FIGURE 9.46 Apply any combination of Picture Effects to achieve the look you want.
Word also features seven tools for adjusting picture attributes in the Adjust group of the Picture Tools ⇒ Format tab shown in Figure 9.46. Use the tools to accomplish a number of common tasks:
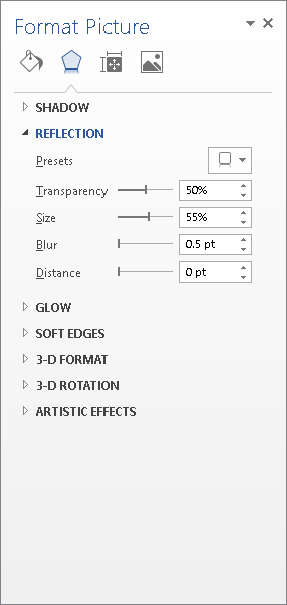
If you click the dialog box launcher in the Picture Styles group of the Picture Tools ⇒ Format tab, the Format Picture pane shown in Figure 9.47 appears at the right. You also can display this pane by right-clicking a selected picture and clicking Format Picture. The Format Picture pane in Word 2013 replaces the Format Picture dialog box found in previous Word versions and offers settings for you to fine-tune presets and other format changes made to a selected picture. Click one of the icons at top to choose an overall category of settings, click an arrow to expand particular settings, and then change the detailed settings. For example, Figure 9.47 shows the detailed settings for working with the Reflection preset applied to the selected image. The category icons at the top of the pane include:
FIGURE 9.47 Find more detailed settings in the Format Picture pane.
If there’s something creative you need to do to text, and Word’s normal text tools don’t even come close to what you need, then WordArt probably has what you’re looking for. WordArt enables you to get creative if you need to accomplish unique tasks like these:
The WordArt tool makes it surprisingly simple to create decorative text. Here’s how to insert a new WordArt object into your document:
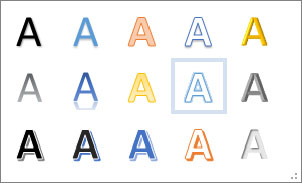
FIGURE 9.48 Click a style in the WordArt gallery.
The wrap setting applied to a new WordArt object varies depending on whether the document already has text or not. If you insert WordArt in a blank document or one with only other objects, the new WordArt graphic appears in the upper-left corner of the document (although not in the header), formatted with wrapping set to In Front of Text. You can change the wrapping as desired using the Wrap Text choices in the Arrange group of the Drawing Tools ⇒ Format tab, and drag the WordArt text box where you want it.
If you positioned the insertion point in some text or have selected some text before adding the WordArt, it is inserted at the beginning of the current paragraph, also formatted with the In Front of Text wrapping style. You can change the wrapping style to create a decorative effect at the beginning of the paragraph, as shown in Figure 9.49.
FIGURE 9.49 Use WordArt to draw attention to the beginning of the paragraph or create wrapped titles.

If you’ve already entered all the text for a document or have received a document to format from another person, the text that you want to format as WordArt may already be included in the document. If that’s the case, select the text, and then select the WordArt type as described in Steps 2 and 3 in the previous section. The selected text appears in the WordArt object. Unlike in Word 2007 and earlier, the 10-word/200-character limit for WordArt text no longer exists, so it’s possible to format entire paragraphs as WordArt. You might want to do this to create a flyer or a pull quote.
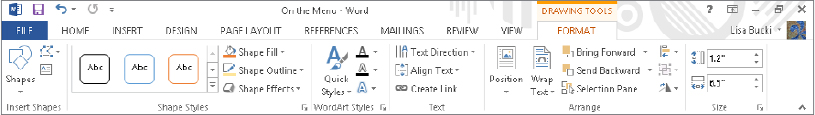
Because WordArt is integrated into Word’s main graphics engine, Word displays the Drawing Tools ⇒ Format contextual tab when you select a WordArt object by clicking it and then clicking its border. As shown in Figure 9.50, the tab offers the same text-formatting tools that are available for text boxes and the same shape-formatting tools that are available for all Word shapes. You will also notice that there is also a lot of overlap of applicable tools when you’re working with pictures.
FIGURE 9.50 Word displays the Drawing Tools ⇒ Format tab for formatting WordArt.
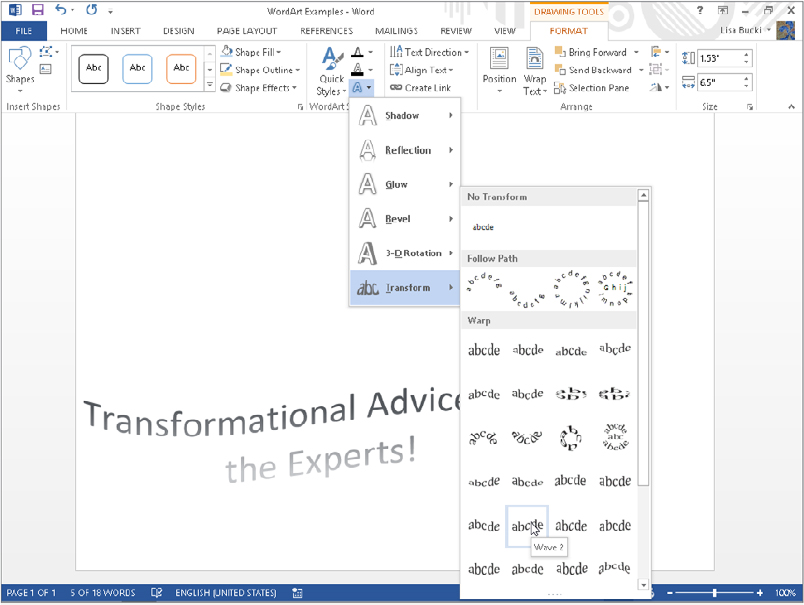
Use the tools in the WordArt Styles and Text groups to format text. Any of these formatting tools can be applied letter by letter if that is what is required. In addition, you can use the normal settings in the Font and Paragraph groups of the Home tab to make changes to the selected WordArt text. Here are ways that you can format WordArt:
FIGURE 9.51 Use Transform to warp WordArt text.
SmartArt provides you with a much wider selection of diagrams to illustrate processes, relationships, organizational hierarchies, and more. SmartArt also features 3-D formatting that’s so dimensional it looks like it took hours for a graphic artist to create it.
Here are the basic steps for inserting SmartArt. I’ll elaborate on some of the details after the steps:
FIGURE 9.52 Enter text to appear in the various shapes in a SmartArt graphic.
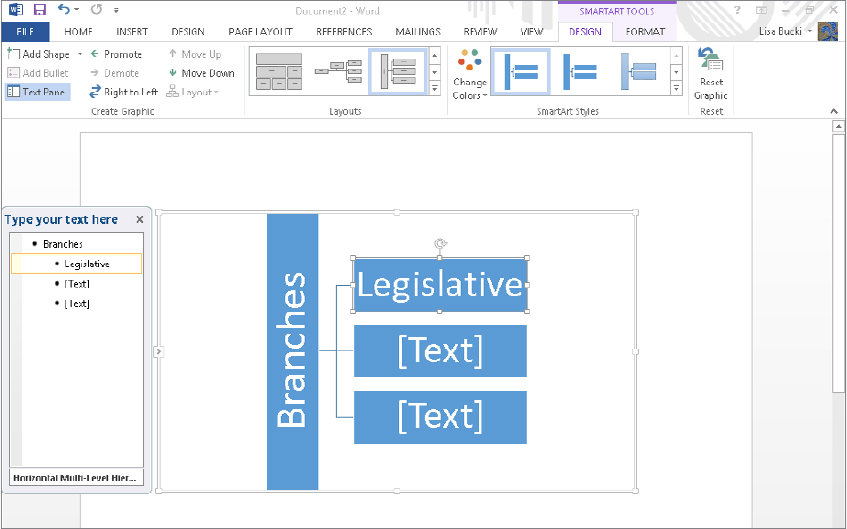
There are a variety of ways to enter and format text in the text pane. The following list, though not exhaustive, offers a number of methods that work. Note that some actions can also be performed via the Create Graphic group in the SmartArt Tools ⇒ Design tab.
Note that basic paragraph and character formatting can be applied to SmartArt shapes. Indents, bullets, and numbering cannot be applied, nor can styles. You can assign a style to the overall diagram; however, effects are limited unless the SmartArt item is In line with text. To change the font used in all the text in a SmartArt object, display the text pane, click in it, press Ctrl+A to select the contents of the text area, and then right-click and set the desired font.
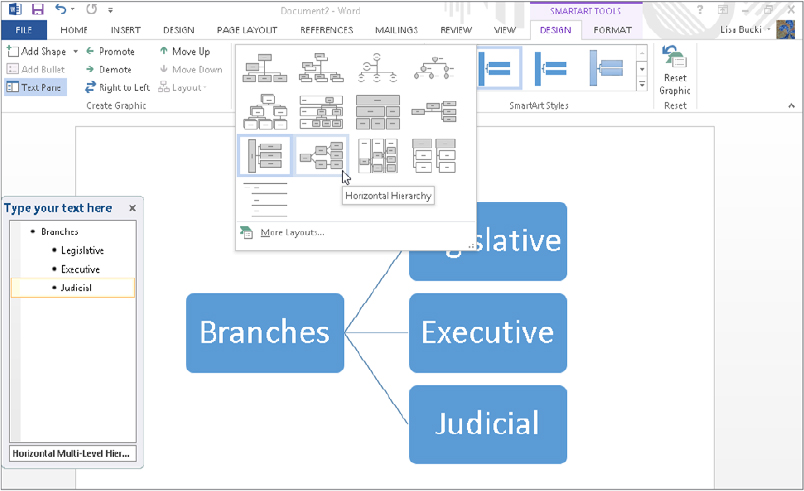
You can change a SmartArt diagram’s overall layout, colors, and style at any time using the tools in the Layouts and SmartArt Styles groups of the SmartArt Tools ⇒ Design contextual tab. Select the SmartArt graphic by clicking it, and use the Layouts Gallery, shown in Figure 9.53, to choose a different layout. Note that the gallery works with Live Preview. You aren’t limited to applying the same class (List, Hierarchy, Process, Cycle,) of layout, either. SmartArt will adapt the different designs using the relationship levels currently applied.
FIGURE 9.53 You can apply any layout to any SmartArt list.
SmartArt Styles enable you to apply a variety of preset formatting to the selected SmartArt diagram. Click the More button to open the gallery and point to any choice — again, Live Preview helps you to make a selection. The styles offer both 2-D and 3-D options, as well as a variety of sophisticated surface treatments.
Open the Change Colors gallery beside the SmartArt styles to preview and select from a variety of color schemes you can apply to the selected SmartArt graphic.
You have to add and remove shapes in a SmartArt graphic to control the content that appears. You can do so in the text pane as noted earlier. Or you can click the SmartArt diagram to select it, click a shape within the diagram to which the new shape will relate, and then click the Add Shape drop-down list arrow in the Create Graphic group of the Design tab. The choices that appear are Add Shape After, Add Shape Before, Add Shape Above, and Add Shape Below. (Depending on the nature and position of the shape you initially selected, not all of these choices may be active.) Click the desired shape location, and then type the text for the new shape. You also can right-click a shape and use the Add Shape submenu of the shortcut menu to insert a shape.
SmartArt provides a number of additional tools for formatting individual shapes within a selected SmartArt object. After clicking the SmartArt diagram, click a shape to select it, and then use the applicable tools in the SmartArt Tools ⇒ Format tab, shown in Figure 9.54.
FIGURE 9.54 Formatting tools are found in the Shapes, Shape Styles, and WordArt Styles groups of the Format tab.
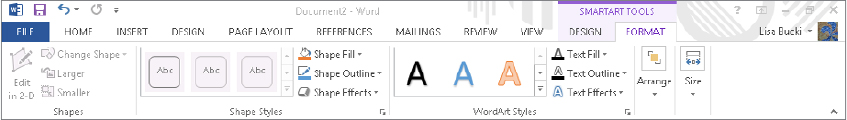
Use the Shapes group tools as follows:
The Shape Styles group includes these choices for formatting a selected shape:
The settings in the WordArt Styles group change the appearance of the text in the selected shape.
In addition to the Position and Wrap Text tools described earlier in the chapter, the Arrange group of the Picture Tools ⇒ and Drawing Tools ⇒ Format tabs has tools for working with the layering, alignment, grouping, and rotation of various types of Word graphics. These additional tools are:
For example, you could layer a WordArt object over a picture. Apply Bring to Front to the WordArt and Send to Back for the Picture. Then select both objects and use Align Objects ⇒ Align Center and then Align Objects ⇒ Align Top to position them. Finally, group the objects. Techniques such as this enables you to compose more complex graphics within Word and other Office applications with similar graphics tools.
In Word 2013, you can format graphic objects as invisible, as long as they have a Wrap Text setting other than In Line with Text. To determine whether or not an object is set as invisible, open any .docx document that contains graphics with the right Wrap Text settings. In the Editing group of the Home tab, choose Select ⇒ Selection Pane.
Each object with an applicable Wrap Text setting appears in the selection tab with an eye icon to its right. Clicking the icon makes the associated object invisible. In Figure 9.55, the top Picture objet has been marked as invisible, and the bottom Text Box object remains visible, as indicated by the eye icon still being visible. Use the Show All and Hide All buttons in the pane to show and hide all graphics.
FIGURE 9.55 Use the Selection pane to control visibility for floating (not inline) graphic objects.
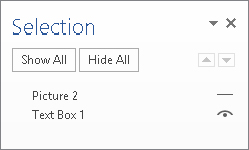
You can use this feature to hide shapes, text boxes, SmartArt, and charts. You cannot unbundle parts of a chart or SmartArt object — it’s all or nothing. Click the pane’s Close (X) button to close it.
In this chapter, you’ve learned the essentials you need to know about tables, shapes, pictures, WordArt, and SmartArt. You should now be able to do the following: