We will try to understand all of this by looking at the example of the Titanic. While the Titanic was sinking, a few of the categories had priority over others, in terms of being saved. We have the following dataset (it is a Kaggle dataset):
|
Person category |
Survival chance |
|
Woman |
Yes |
|
Kid |
Yes |
|
Kid |
Yes |
|
Man |
No |
|
Woman |
Yes |
|
Woman |
Yes |
|
Man |
No |
|
Man |
Yes |
|
Kid |
Yes |
|
Woman |
No |
|
Kid |
No |
|
Woman |
No |
|
Man |
Yes |
|
Man |
No |
|
Woman |
Yes |
Now, let's prepare a likelihood table for the preceding information:
|
|
|
Survival chance |
|
|
|
|
|
|
No |
Yes |
Grand Total |
|
|
|
|
Category |
Kid |
1 |
3 |
4 |
4/15= |
0.27 |
|
Man |
3 |
2 |
5 |
5/15= |
0.33 |
|
|
Woman |
2 |
4 |
6 |
6/15= |
0.40 |
|
|
|
Grand Total |
6 |
9 |
15 |
|
|
|
|
|
6/15 |
9/15 |
|
|
|
|
|
|
0.40 |
0.6 |
|
|
|
Let's find out which category of people had the maximum chance of survival:
Kid - P(Yes|Kid)= P(Kid|Yes) * P(Yes)/P(Kid)
P(Kid|Yes) = 3/9= 0.3
P(Yes) = 9/15 =0.6
P(Kid)= 4/15 =0.27
P(Yes|kid) = 0.33 *0.6/0.27=0.73
Woman - P(Yes|Woman)= P(Woman|Yes) * P(Yes)/P(Woman)
P(Woman|Yes) = 4/9= 0.44
P(Yes) = 9/15 =0.6
P(Woman)= 6/15 =0.4
P(Yes|Woman) = 0.44 *0.6/0.4=0.66
Man - P(Yes|Man)= P(Man|Yes) * P(Yes)/P(Man)
P(Man|Yes) = 2/9= 0.22
P(Yes) = 9/15 =0.6
P(Man)= 6/15 =0.33
P(Yes|Man) = 0.22 *0.6/0.33=0.4
So, we can see that a child had the maximum chance of survival and a man the least chance.
Let's perform the sentiment classification with the help of Naive Bayes, and see whether the result is better or worse:
from sklearn.naive_bayes import MultinomialNB
# splitting data into training and validation set
xtraintf, xtesttf, ytraintf, ytesttf = train_test_split(tfidfV, Newdata['label'], random_state=42, test_size=0.3)
NB= MultinomialNB()
NB.fit(xtraintf, ytraintf)
prediction = NB.predict_proba(xtesttf) # predicting on the test set
prediction_int = prediction[:,1] >= 0.3 # if prediction is greater than or equal to 0.3 than 1 else 0
prediction_int = prediction_int.astype(np.int)
print("F1 Score-",f1_score(ytest, prediction_int))
print("Accuracy-",accuracy_score(ytest,prediction_int))
The output is as follows:
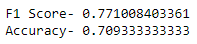
Here, we can see that our previous results were better than the Naive Bayes results.