Appendix A. Leftovers: The Top Ten Things (we didn’t cover)

You’ve come a long way.
But Excel is a complicated program, and there’s so much left to learn. In this appendix, we’ll go over 10 items that there wasn’t enough room to cover in this book, but should be high on your list of topics to learn about next.
#1: Data analysis
It’s one thing to be able to rock and roll inside Excel, but it’s another thing altogether to be a good data analyst. Data analysis is a broad (and hot) field that encompasses knowledge not only of Excel and other software but of higher level topics like statistics and psychology.
Crack data analysts are omnivorous and voracious thinkers when it comes to data, and if you’re interested in boning up on data analysis, might we suggest...
#2: The format painter
The format painter is one of those tools inside Excel that you’ll use all the time. The format painter provides a super-quick way to copy formatting attributes from one cell to another. Just select the cell that has the formatting you want to copy to another cell, click the Format Painter button, and then click on the cell or range where you want to apply that formatting.
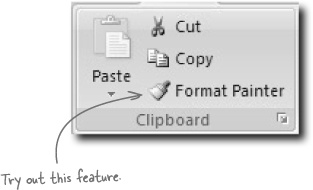
If you want to apply the formatting you’ve loaded into the format painter to a number of places in your spreadsheet (rather than just one), double-click the button when the cell whose formatting you want to copy is highlighted.
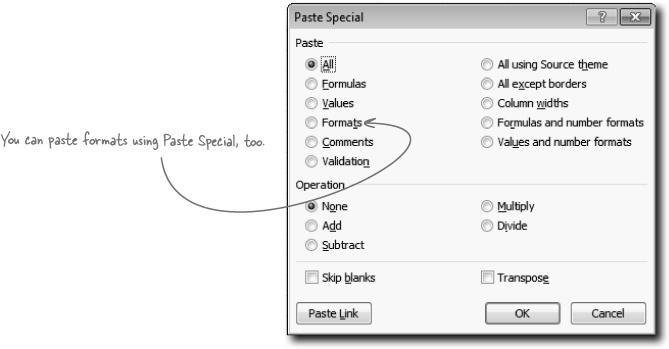
You can also achieve the same results using Paste Special > Formatting.
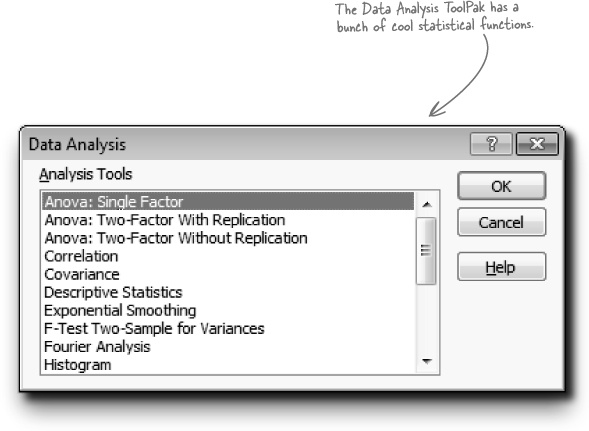
#3: The Data Analysis ToolPak
The Data Analysis ToolPak is a set of analysis tools that comes standard with Excel but isn’t activated by default. If you need to use Excel for serious statistical operations like hypothesis testing, you’ll want to take a look at this feature. Check out the Help files for information on how to activate it.
#4: Array formulas
Ever needed a formula to return more than one result? Does that question blow your mind? Array formulas are a conceptually difficult but programmatically powerful feature of Excel that push functions to the limits of their performance.
They’re worth looking into if you’re interested in taking your mastery of functions into a whole different dimension...literally!
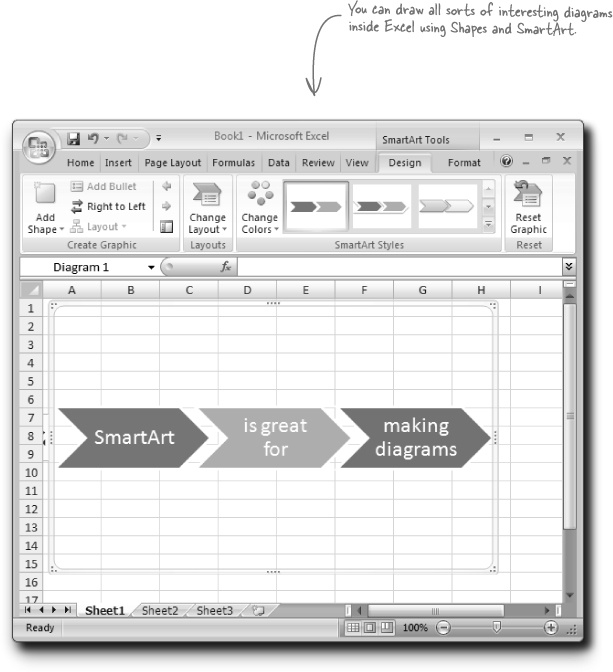
#5: Shapes and SmartArt
Excel 2007 introduced a bunch of visual formatting tools, and this book has only scratched the surface of those tools. If you enjoy thinking visually, try poking around the Shapes and SmartArt features. They are a treasure trove for quick and easy yet elegant formatting options for flow charts and other visualizations.
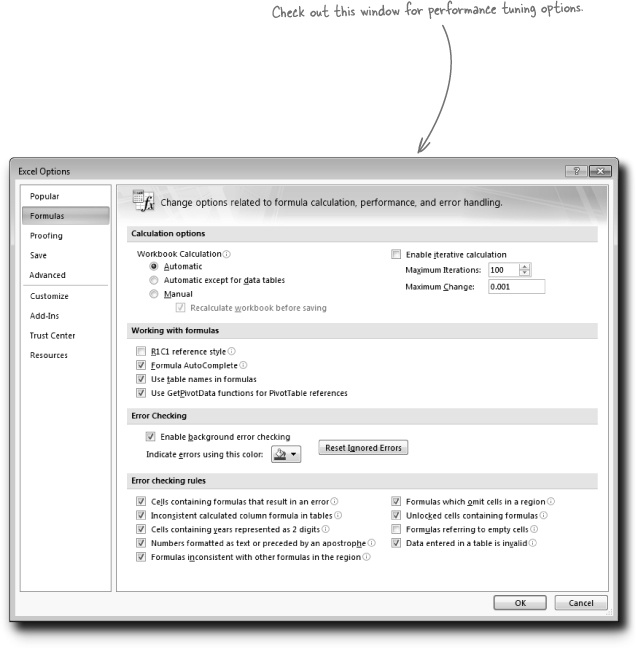
#6: Controlling recalculation and performance tuning
If your spreadsheet gets large and full of formulas, especially array formulas, you might experience slowdowns as all your formulas recalculate when you update data. If you suspect you’re experiencing something like this, head over to the Options menu and play around with the settings that control Excel’s recalculation and other performance behaviors.
#7: Connecting to the Web
All of us spend time surfing the Web, so why not make Excel and the Web work together? Excel has a number of facilities for bringing web data into your worksheets and exporting your spreadsheets for use on the Web.
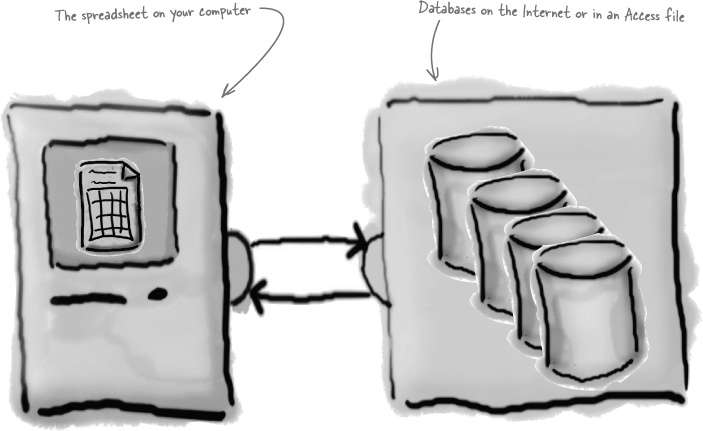
#8: Working with external data sources
You can pull data into Excel from relational databases like Microsoft Access and from a variety of other external sources besides the Internet. Interfacing databases with Excel pivot tables using OLAP (Online Analytical Processing) technology is a particularly powerful and cool way to analyze data.
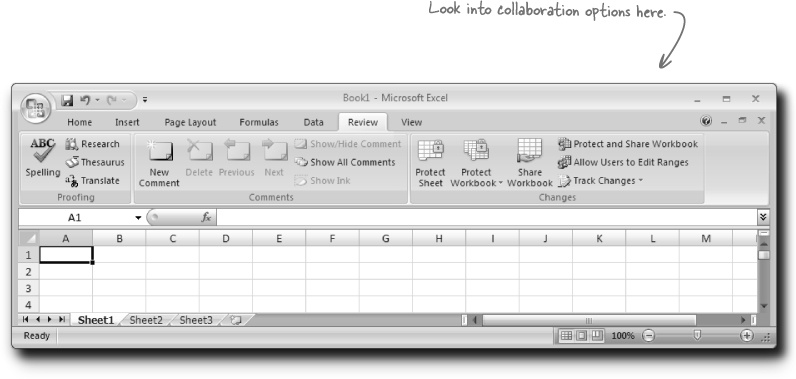
#9: Collaboration
Excel’s collaboration features like Track Changes make working with other people on the same spreadsheet a lot easier. To look at some of the collaboration features, head over to the Review tab.
#10: Visual Basic for Applications
Have you learned most of Excel’s features, even the super-technical stuff like array formulas, and find yourself demanding more? Visual Basic for Applications (VBA) is a full-blown programming language that you can use inside Excel to create your own functions and much, much more.