Chapter 9. Charts: Graph your data

Who wants to look at numbers all the time?
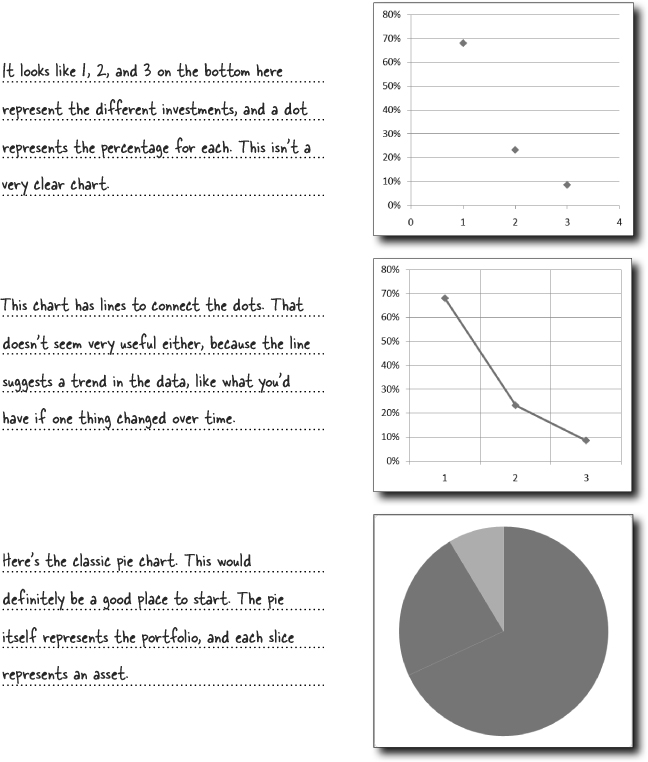
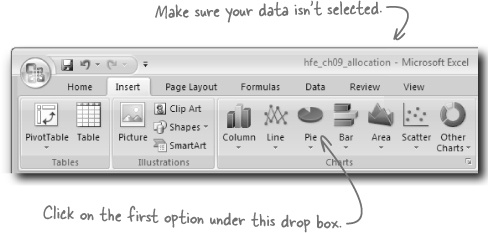
Very often a nice graphic is a more engaging way to present data. And sometimes you have so much data that you actually can’t see it all without a nice graphic. Excel has extensive charting facilities, and if you just know where to click, you’ll unlock the power to make charts and graphs to display your data with drama and lucidity.
Head First Investments needs charts for its investment report
There is a big presentation coming up for Head First Investment’s board of directors. They have all the data compiled to show their performance over the last year, but they need some charts to make the data easier to read and understand. It’s up to you to crank out some attractive charts.


Create charts using the Insert tab
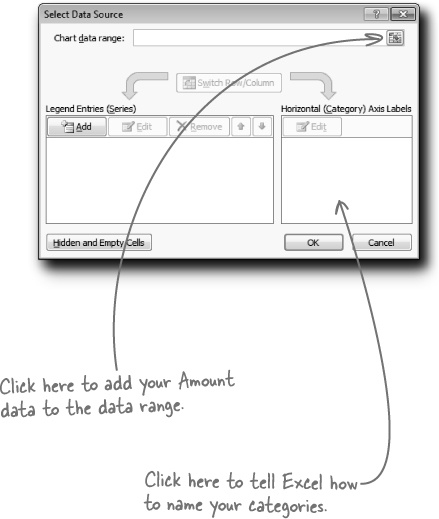
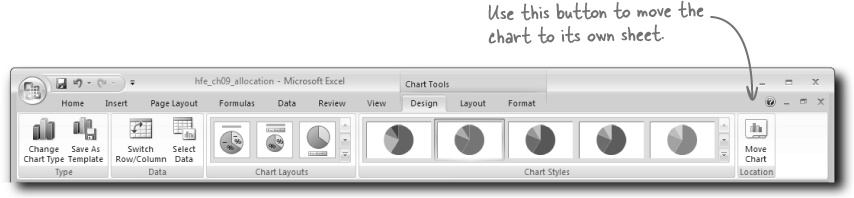
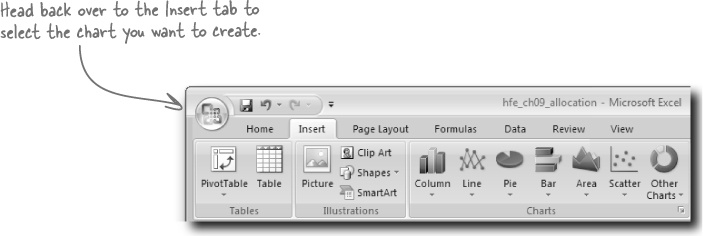
Let’s try creating one of those pie charts. Making charts in Excel is easy: just start by clicking on the Insert tab of the Ribbon. You’ll find everything you need to get started.

Use the Design and Layout tabs to rework your chart
Inserting a chart in Excel is only the beginning. Once your chart has been created, you’ll always head to the Design and Layout tabs under Chart Tools to change elements in your chart like the titles and formatting.
You just hit the Select Data button under the Design tab to select your data and labels.

Let’s polish up your chart using the Design and Layout tabs.
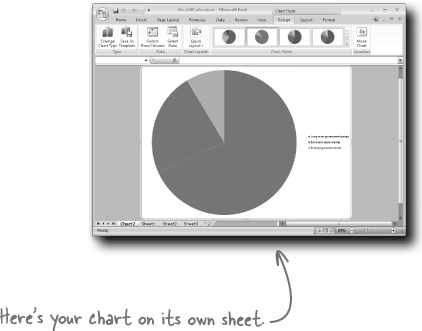
Using the far-right button on the Design tab, move the chart you created to its own sheet. This will clear up the sheet with your data.
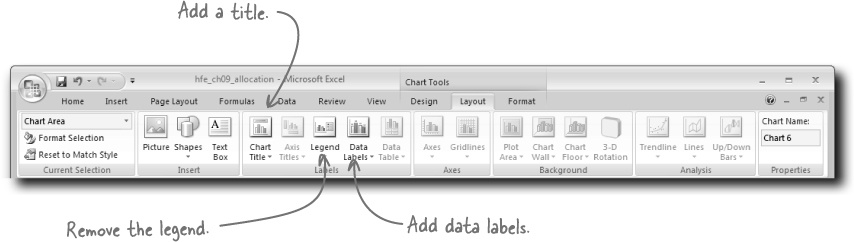
Now head over to the Layout tab. Click the Chart Title button to add a title.
It’d be nice if your labels were actually next to the pie slices rather than in the legend, so let’s get rid of the legend. Under the Layout tab, make the legend go away.
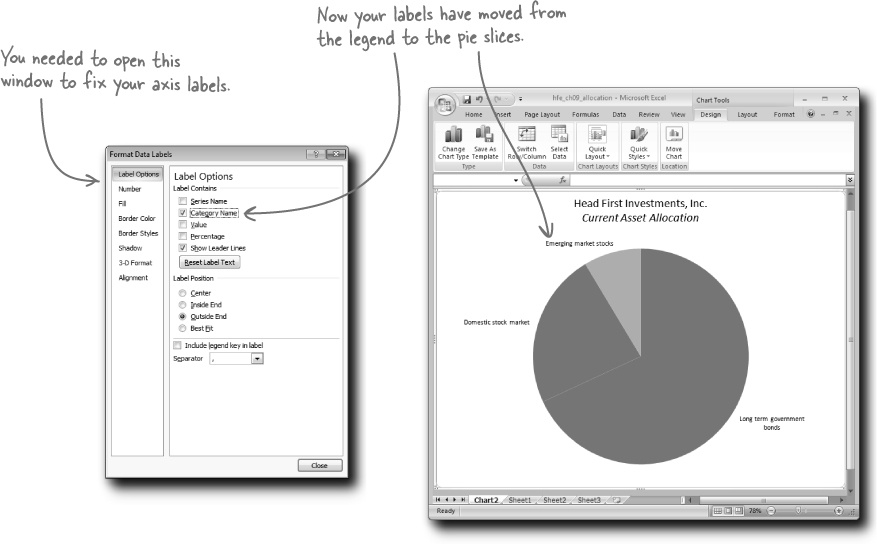
Add data labels next to the pie slices. Once you’ve added them, right-click and select Format Data Labels to make sure they refer to the Category Name rather than the Values.
Finally, increase the font size of all text elements in the chart to make them more readable. You can change the font size using the Home tab.
You just executed a variety of modifications to your pie chart’s layout using the Design and Layout tabs. How do your results look?
Move the chart you created to its own sheet.
Add a title.
Get rid of the legend.
Add data labels next to the pie slices, making sure they refer to the Category Name rather than the Values.
Increase the font size of all text elements in the chart.
Let’s see what the boss thinks....
Your pie chart isn’t going over well with the corporate graphic artist
Your pie chart has been passed around, and some guy you’ve never even dealt with is weighing in with a negative opinion.

The artist is correct. This is a common critique of pie charts among people who care a lot about data visualizations, so you should probably try a different chart. But no worries: changing the chart type is a snap.
Let’s take a look at some other chart types.
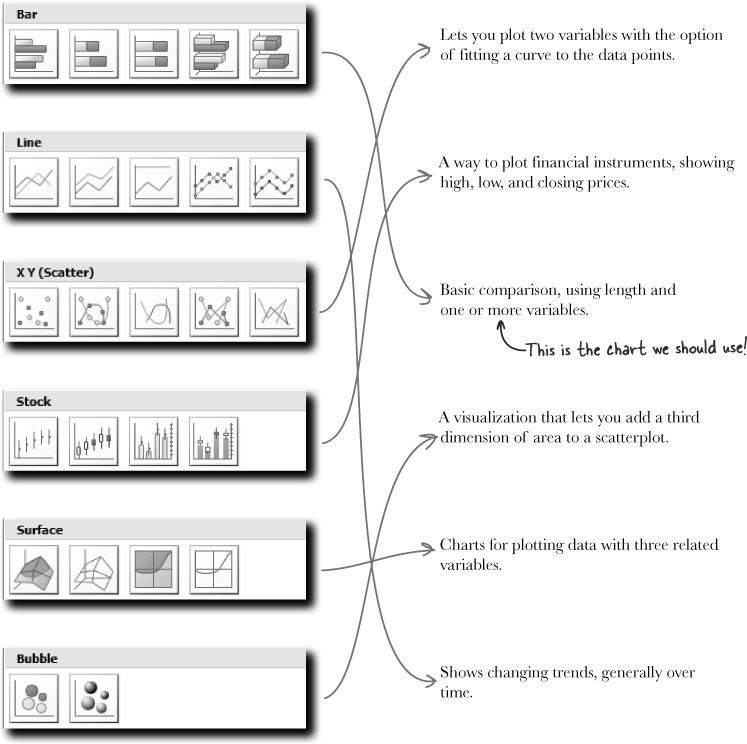
Match each Excel chart type to what it does. Which chart do you think would be an improvement over the pie chart?
Lets you plot two variables with the option of fitting a curve to the data points. | |
A way to plot financial instruments, showing high, low, and closing prices. | |
Basic comparison, using length and one or more variables. | |
A visualization that lets you add a third dimension of area to a scatterplot. | |
Charts for plotting data with three related variables. | |
Shows changing trends, generally over time. |


Match each Excel chart type to what it does. Which chart do you think would be an improvement over the pie chart?
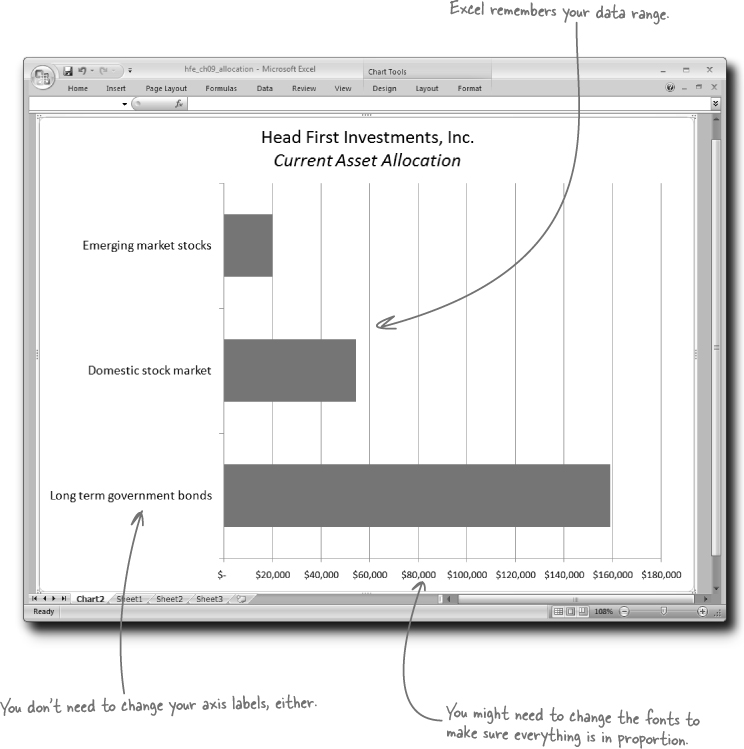
Now that you’ve decided to change your pie chart to a bar chart, go ahead and make that change.

Do the labels update correctly? You might need to adjust the fonts.
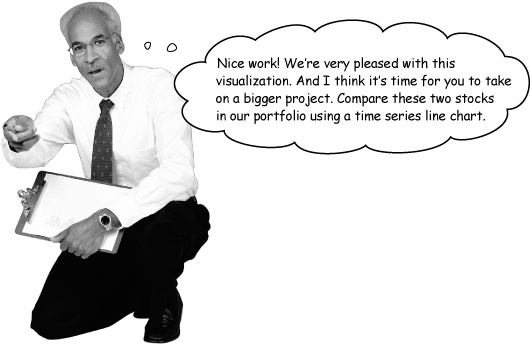
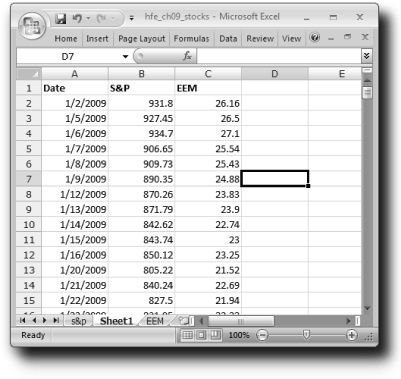
Create a line chart to compare stock 1 and stock 2. Put your cursor inside your data range, and Excel will try to figure out which columns represent your data.
Which stock did better this year?
_______________________________________________
_______________________________________________
_______________________________________________
_______________________________________________
You just created a time chart to compare two stocks. Did Excel create a strong visualization?
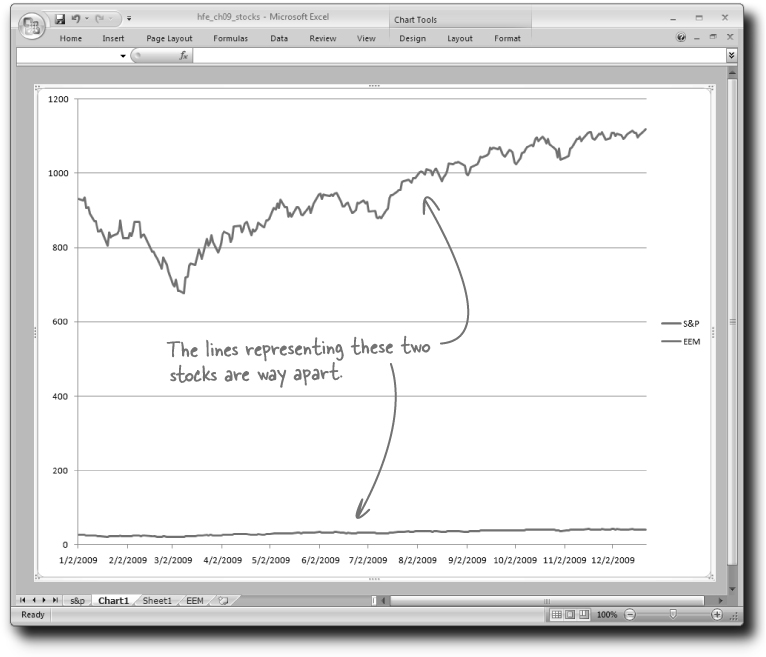
Which stock did better this year?
It appears that Excel created the visualization correctly, but there’s a problem. It’s hard to tell which stock performed better, because they have such different values. The starting and ending price of the S&P index stock is way higher than that of the EEM stock. The stocks started from different places, so we might need to do something to the data to get a good comparison.

Sometimes you need to transform the data in order to graph it effectively. Creating effective graphics isn’t just about using the graphical manipulation features of Excel effectively. It’s also about making sure that your data is prepped correctly for a good visualization.
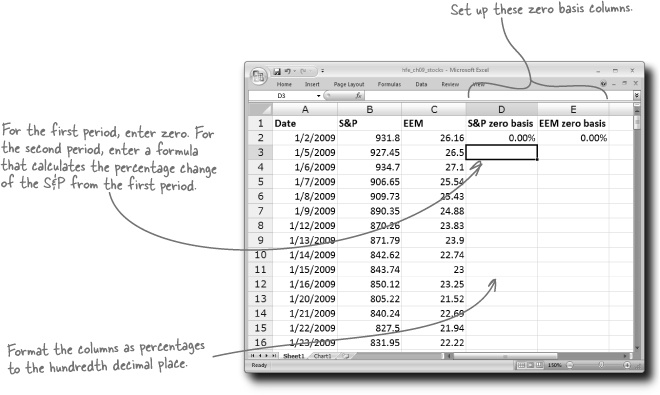
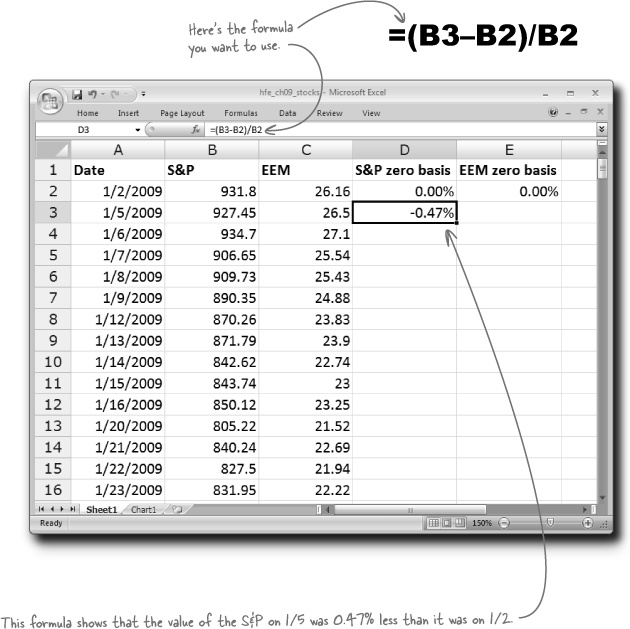
You just transformed your data to show a percentage change from a zero basis rather than the original value. What did you find?
Let’s copy the formulas and graph the data....
Now that you’ve written a formula to show the percentage change for one unit of time, copy and paste the formula for all dates. Then graph your new data.
Copy and paste the formula for both stocks. Make sure you add absolute references where necessary.
Create a new time series line chart.

Hint: You might have to go back into the menu that tells Excel which data to select. You want Excel to select only your new data, not all four columns.


You’re starting to get tight on time...

You just reformatted your new line chart. How did it turn out?
Make this the title: S&P versus EEM.
Put the legend, which is currently on the right, at the bottom of the chart.
The date labels on the y-axis are kind of verbose and also get in the way of the lines. See whether you can fix that issue as well.