Chapter 10. What if Analysis: Alternate realities

Things could go many different ways.
There are all sorts of quantitative factors that can affect how your business will work, how your finances will fare, how your schedule will manage, and so forth. Excel excels at helping you model and manage all your projections, evaluating how changes in those factors will affect the variables you care about most. In this chapter, you’ll learn about three key features—scenarios, Goal Seek, and Solver—that are designed to make assessing all your “what ifs” a breeze.
Should your friend Betty advertise?
Betty sells the best baguettes in Dataville. But in spite of her renown, she is interested in expanding her business through advertising.
She’d like to add more customers to her already stable customer base. But ads can be expensive. Would advertising be worthwhile? She’s enlisted you for help, and if your recommendations pay off, your baguettes will be on the house.

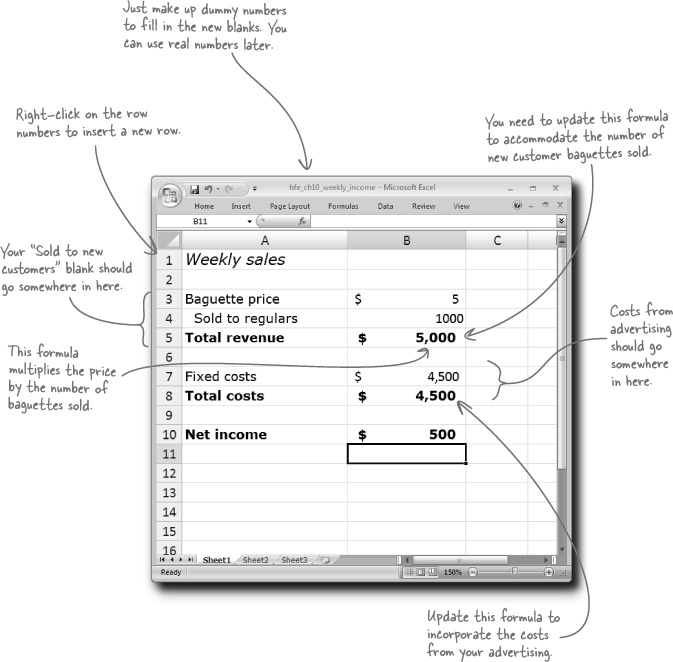
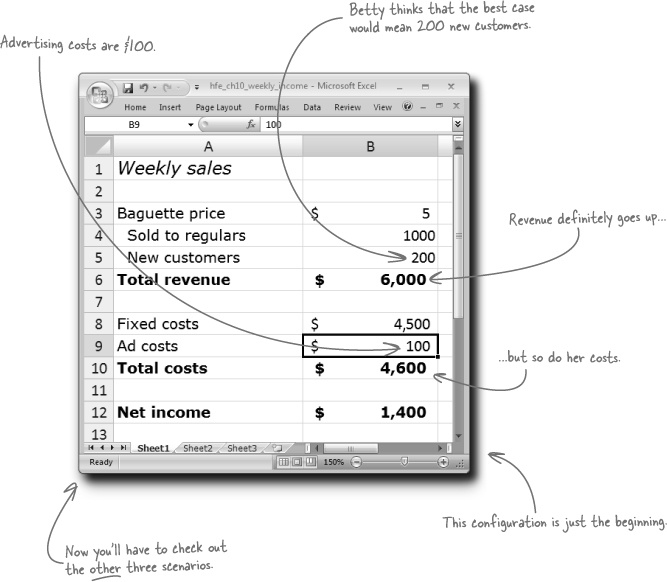
Here’s Betty’s weekly cash flow statement. You’re going to use this spreadsheet as the basis for your projections about advertising costs and revenue. Rework this spreadsheet to accommodate blanks for ad costs and revenue from baguettes sold to new customers. Where would you put the new information?
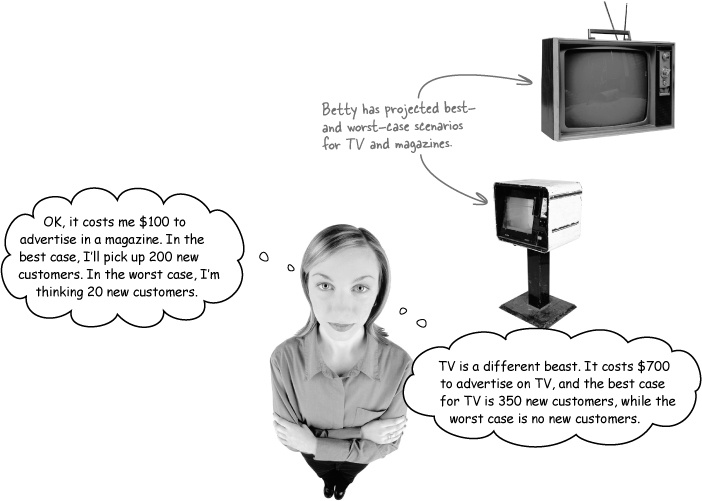
Betty has projections of best and worst cases for different ad configurations
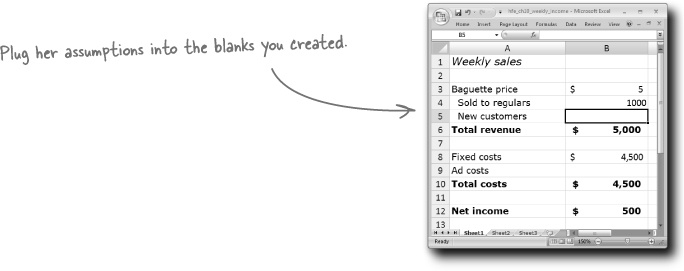
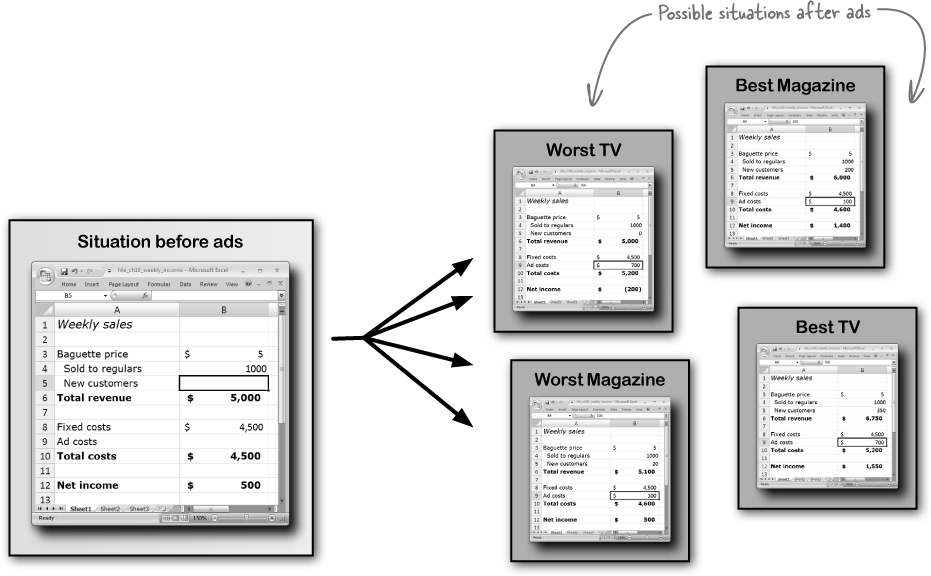
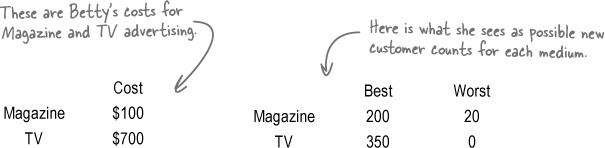
Betty has already done some thinking about the best- and worst-case scenarios for both TV and magazine advertising. Here are what she takes to be the parameters of her decision.
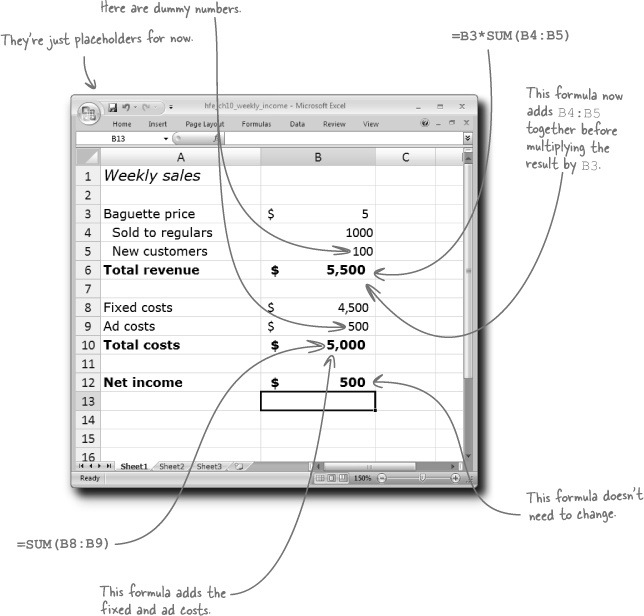
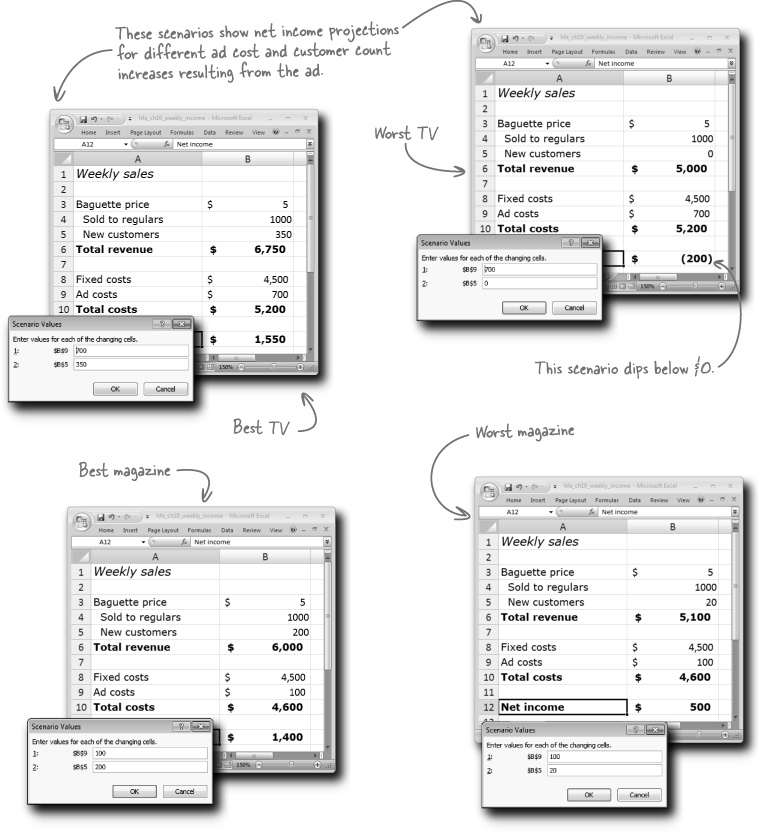
Let’s take one of those configurations and see how it affects net income. What does the spreadsheet say about the best case for magazine advertising?
You need to evaluate all her scenarios
The best-case scenario for magazine advertising looks good, but is it the best? And what about the worst-case scenarios? In order to make this assessment, you’re going to need to look at all of her projected possibilities.

Scenarios helps you keep track of different inputs to the same model
When you refined Betty’s cash flow model to accommodate an ad expense and the revenue that results from that advertising, you enhanced the model she was using to understand her business.
Having the model is one thing, and getting the inputs correct is another. You tried one set of inputs, but what about the other three? Scenarios is a feature in Excel that helps you keep track of all your different sets of model inputs.
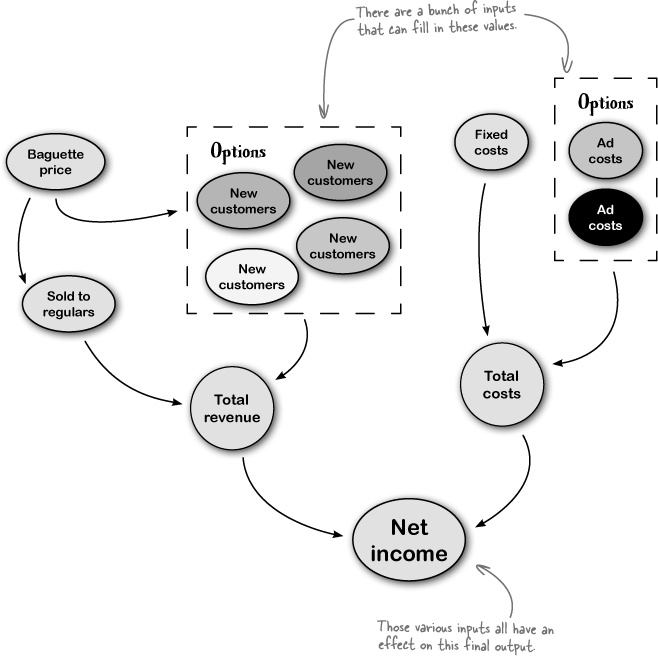
Her projections show certain input elements to change, depending on different outcomes.
Scenarios saves different configurations of the elements that change
To take the Scenarios feature for a spin, first you need to have your network of formulas (your model) set up. Next, head over to the What If Analysis button under the Data tab.
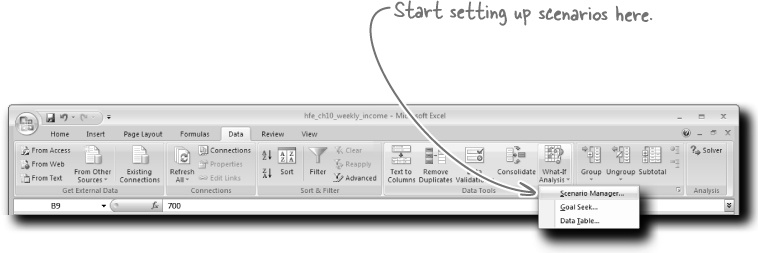
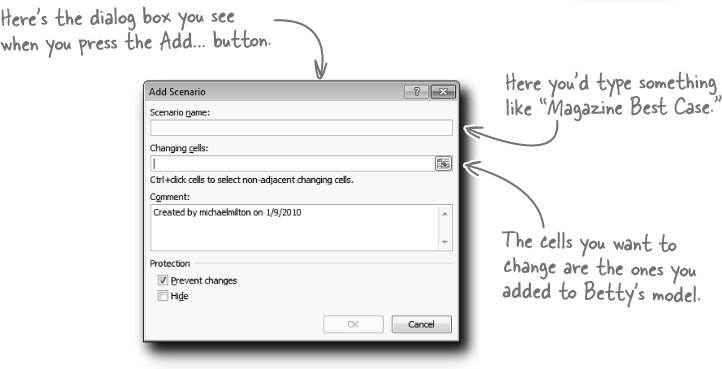
Click on Scenario Manager..., which takes you to this dialog box. Here you can name each of your scenarios and specify which cells change and what the values are for those cells in each scenario.
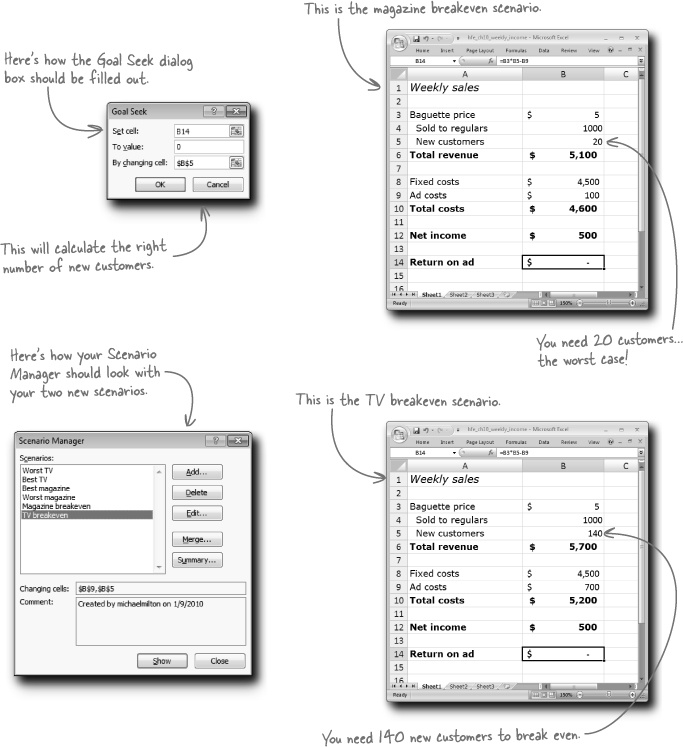
Betty wants to know her breakeven

You need to create some new scenarios.
But what are they? With the other four, she gave you the inputs. But now you need to do a calculation to find out how many new customers are needed to recoup her costs for TV and magazine ads.
Goal Seek optimizes a value by trying a bunch of different candidate values
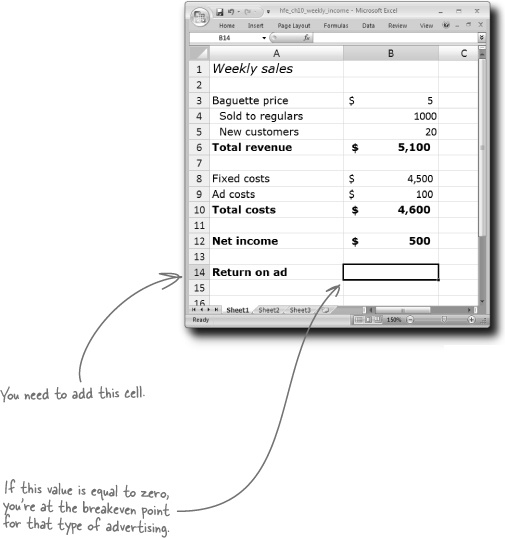
With your formula to calculate the amount of new money Betty brings in on top of the costs of her advertising, you’re in a position to try to figure out the key variable you don’t know: the number of new customers she needs to break even.
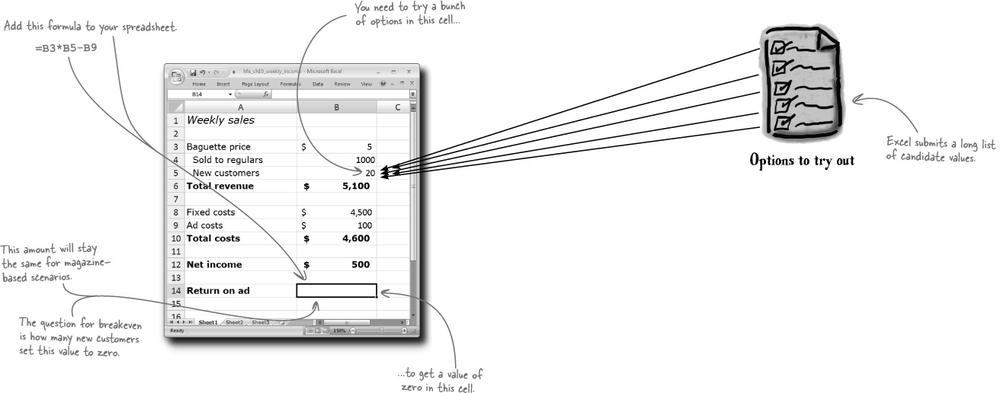
Goal Seek is the feature you need to set cell B5 (your new customer count) to the value that makes cell B14 (your return) equal to zero.
Goal Seek operates by trying a whole bunch of different values in one cell in order to get a formula in another cell to be equal to the value you want. In this case, you need Goal Seek to try a bunch of different values in your New Customers cell to figure out which one makes your return equal to zero.
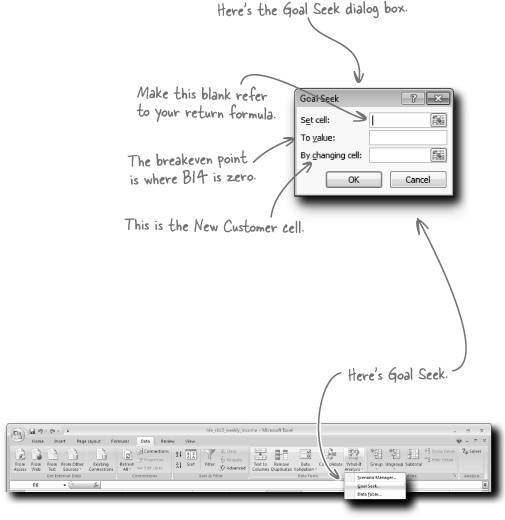
To take Goal Seek for a spin, just hit the menu item under your Scenario Manager on the Data tab.
Betty needs you to add complexity to the model
We’re still trying to maximize our net income by looking at the best- and worst-case scenarios for new customers. But modelling these scenarios has become harder, because...
She needs you to do two things Goal Seek cannot do
Goals Seek sets the output on one formula to one value by changing one cell. But you need to be able to do more, since her problem needs you to...
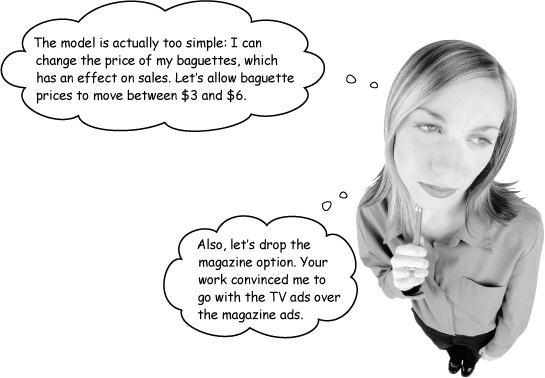
Change the values of more than one variable. Now you have both new customers and baguette prices to account for as you project net income.
One of the variables is subject to constraints. Baguette prices can’t be any old number: they have to be somewhere between $3 and $6.
You need a more powerful Goal Seek....
Solver can handle much more complex optimization problems
The gold standard for optimization inside Excel is the powerful add-on utility Solver. It comes as an optional installation in every copy of Excel for Windows.
Relax
Don’t see Solver in your menus?
Solver is there; it’s not just installed yet. Head over to Appendix B to see how to get Solver up and running.
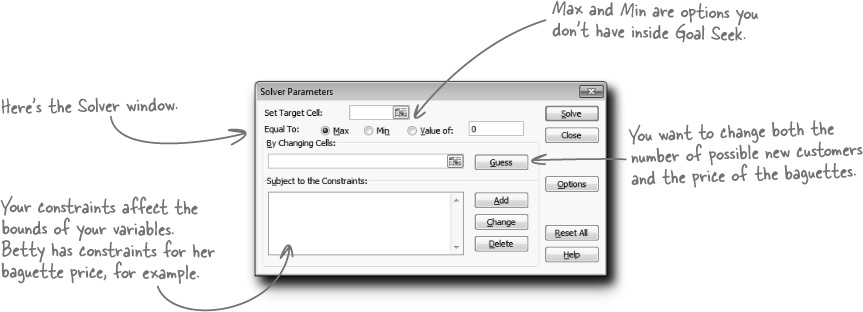
In an optimization problem, you have a target cell you want to maximize, minimize, or set to a value by changing other cells that may be subject to constraints.
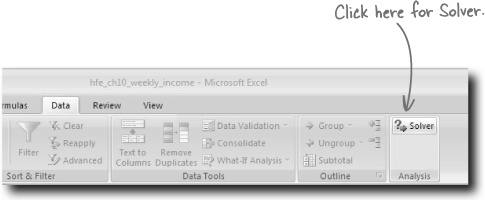
To get Solver started, head over to the far-right corner of the Data tab on the Ribbon.
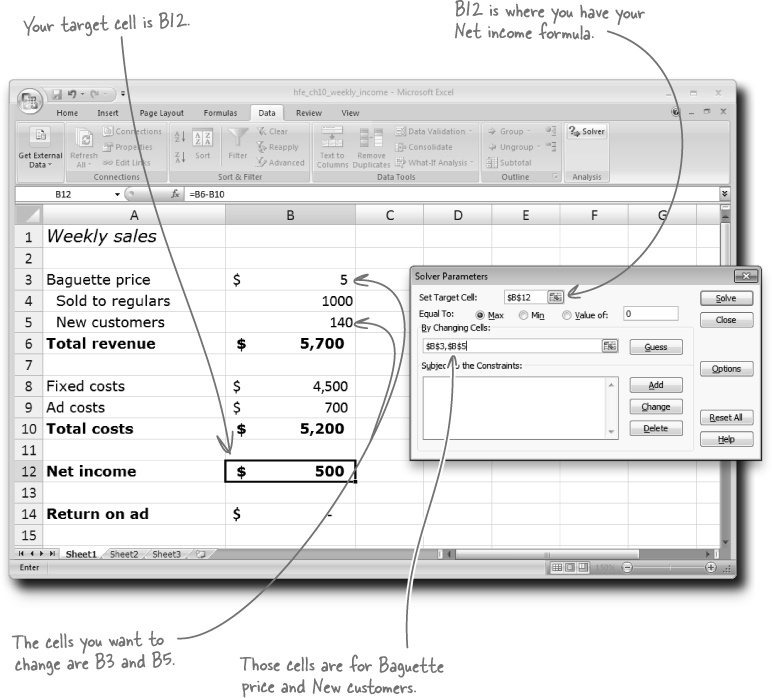
You just set up the first part of your Solver optimization. Did you enter the right parameters?
Open Solver and set your target cell. This is the cell that contains the value you want to maximize.
Set the cells you want to change. Solver will try a number of different values for these cells in order to maximize your target cell.
Let’s set up the rest of the Solver optimization....
Finish your Solver optimization. How much net income can Betty hope to get if she uses television advertising?
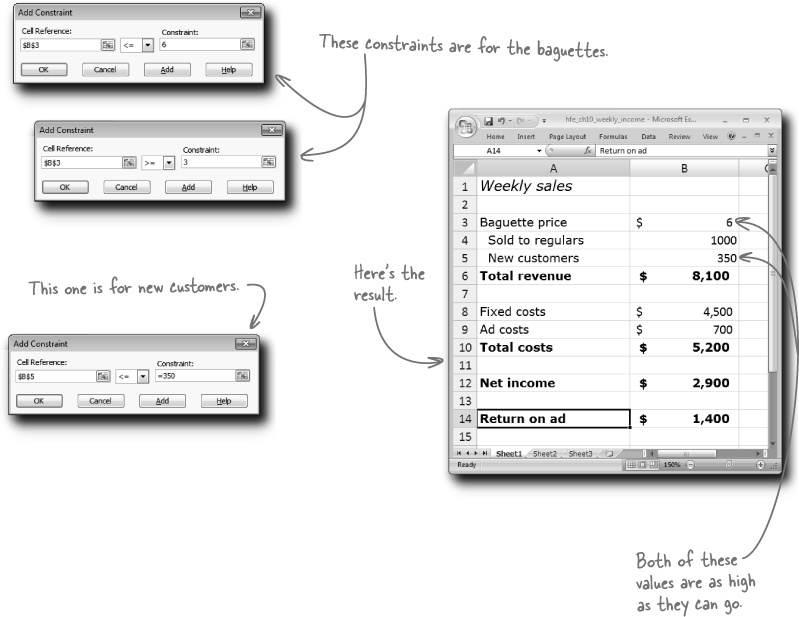
Finally, set up your constraints. Betty told you that her baguette price can shift between $3 and $6, so that’s one constraint. For the purposes of this scenario, set up this one as well: your maximum number of new customers equals 350.
Click Solve to run Solver. What does Solver say to you? Write your answer below.
You just entered your constraints and ran Solver. What happened?
Finally, set up your constraints. Betty told you that her baguette price can shift between $3 and $6, so that’s one constraint. For the purposes of this scenario, set up this one as well: your maximum number of new customers equals 350.
Click Solve to run Solver. What does Solver say to you? Write your answer below.
Solver takes both of the cells we said could change and sets them to their maximum values. Baguettes are at their highest possible price, and the most possible new customers are expected. The resulting net income figure is high: $2,900.

She’s right. In the real world, you can’t just raise your prices without anyone noticing. Your models somehow needs to recognize that other variables may be changed by a change in the price of baguettes.
Do a sanity check on your Solver model
Solver will give you optimal answers, provided that your model is correct. But it doesn’t know whether your model is based in reality.
You always need to check your formulas to make sure your model corresponds to reality correctly.
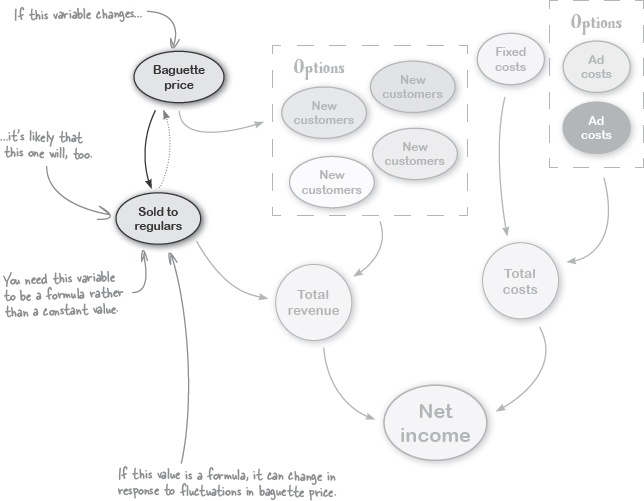
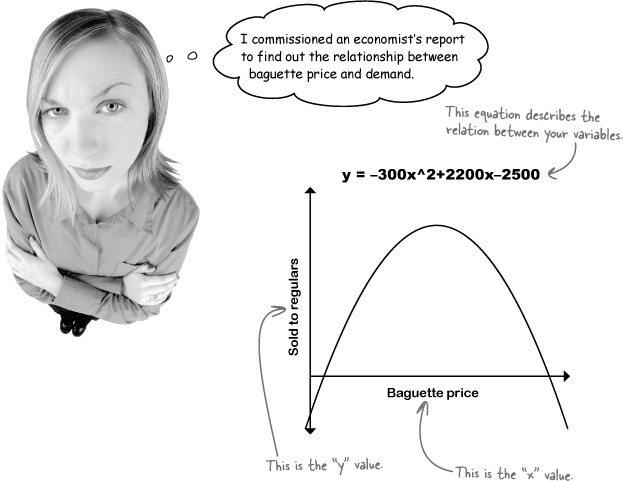
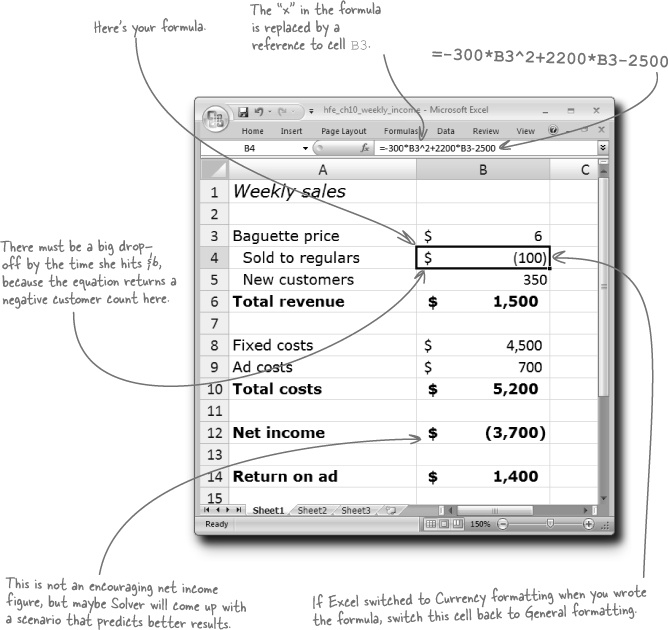
Looks like Betty shelled out the big bucks and had an economist create an equation to describe the relationship between the cost of baguettes and the amount sold to regulars. This sort of thing just screams to be made into an Excel formula.
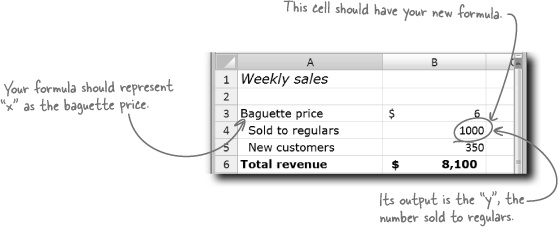
You just entered a new formula to calculate the number of regulars who’ll buy Betty’s baguettes in light of the price of those baguettes. What formula did you use?

Do this!
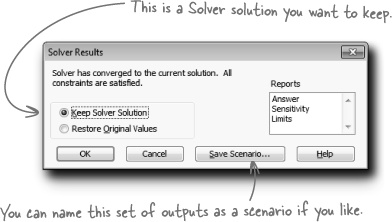
Go ahead and run Solver again.
Since you’ve set it up already, you won’t have to make any sort of modifications to your target cells, constraints, or any other element of the optimization problem. The change you made is in the model itself, so Solver will just try to maximize your profits like it did previously, but this time with a slightly different model.
Solver calculated your projections
When you reran Solver, it used the same assumptions you gave it previously, but this time the formula outputs were all different because you added a formula to provide a better prediction of the number of regulars who would buy baguettes at whatever price Solver thinks is best. Here’s what happened:
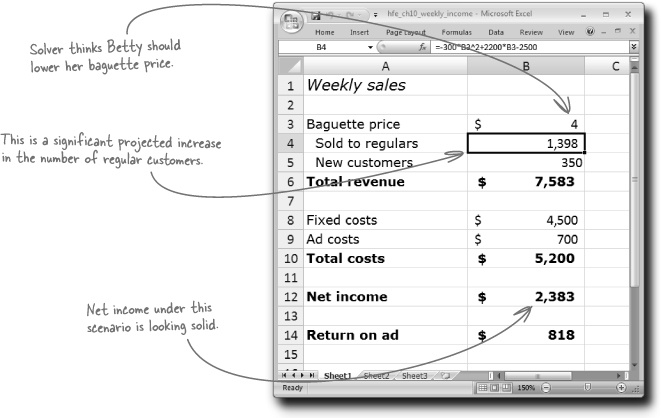
Solver thinks Betty should bring her price down to $4, which will optimize her regular customer purchases, but not any further down, which could hurt her revenue. This configuration represents a final best-case scenario for TV advertisement.