Chapter 14. Segmentation: Slice and dice

Get creative with your tools.
You’ve developed a formidable knowledge of Excel in the past 13 chapters, and by now you know (or know how to find) most of the tools that fit your data problems. But what if your problems don’t fit those tools? What if you don’t even have the data you need all in one place, or your data is divided into categories that don’t fit your analytical objectives? In this final chapter, you’ll use lookup functions along with some of the tools you already know to slice new segments out of your data and get really creative with Excel’s tools.
You are with a watchdog that needs to tally budget money
Geopolitical Grunts is a swashbuckling group of policy geeks who advise businesses and governments on the most important macro trends of the day. They need your help doing some hardcore pivot table work.
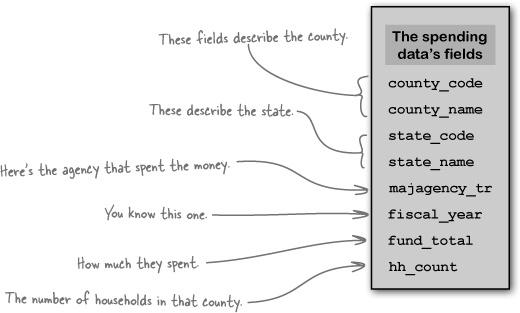
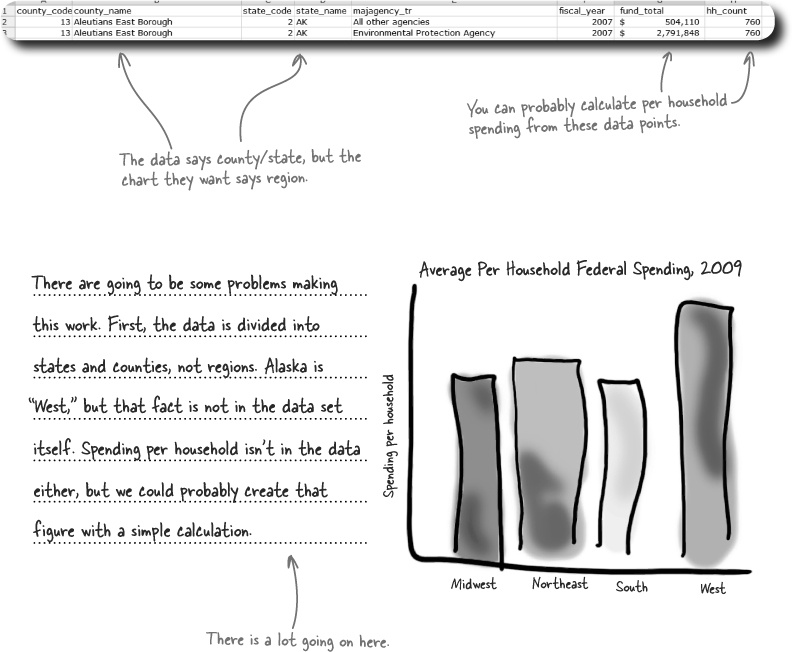
The data set describes the spending of the U.S. federal government at the county level for the past couple years.

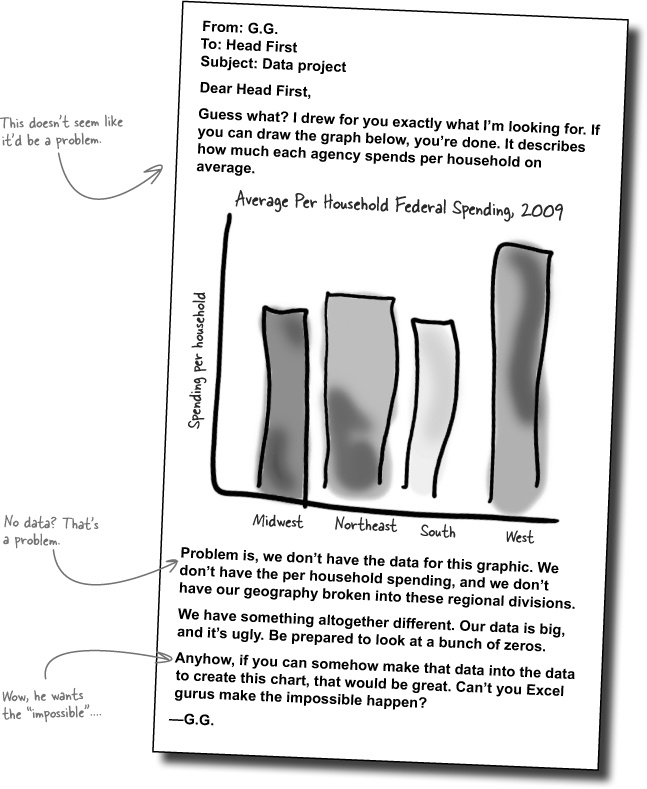
Here’s the federal spending data, broken out by county
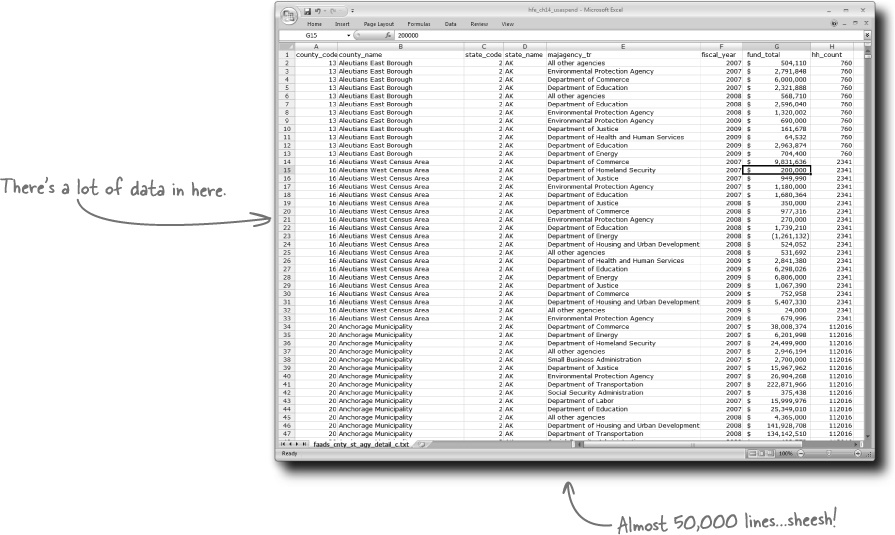
The folks at Geopolitical Grunts sent you this database, which is a county-by-county summary of U.S. federal government spending over the past couple years. And because it’s almost 50,000 lines, you might want to close other programs before loading it!
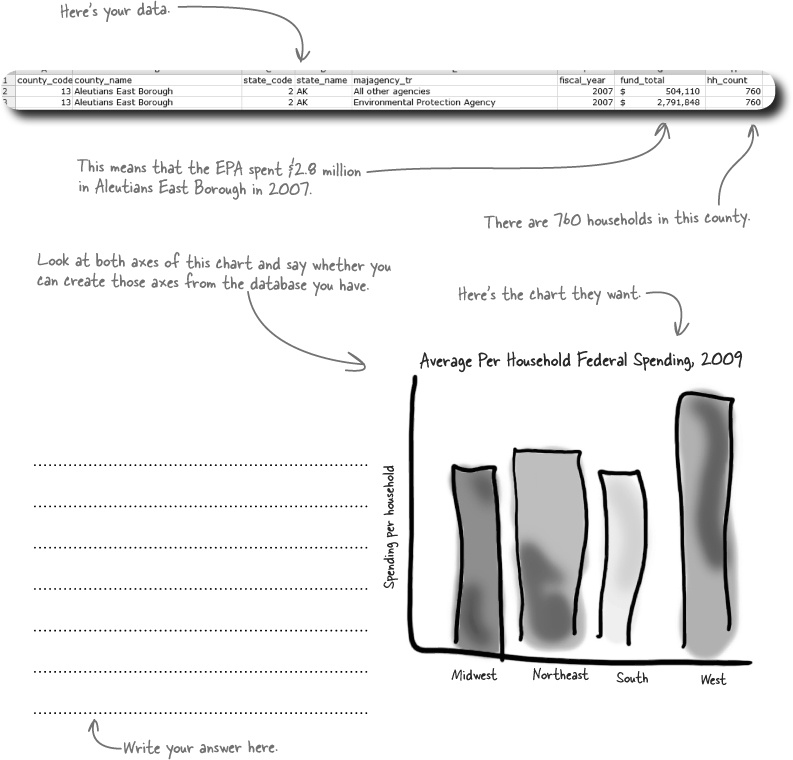
Sometimes the data you get isn’t enough
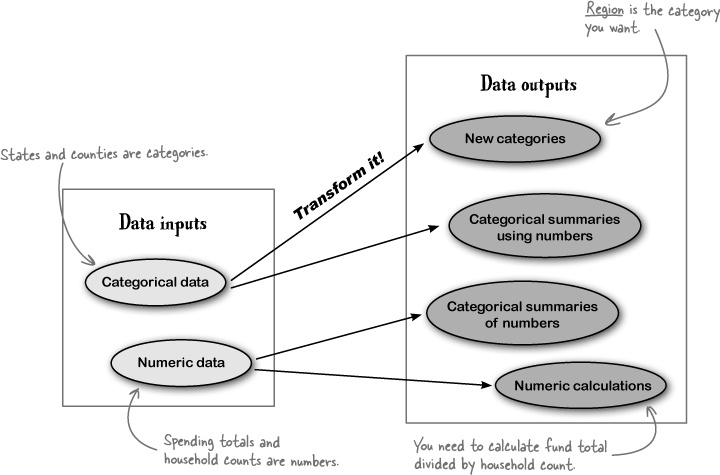
Data can be close to what you want without ever quite getting there. But that doesn’t mean that you can’t do your analysis. You can just transform the data you have into the data you need to have.
Your problems with region are bigger
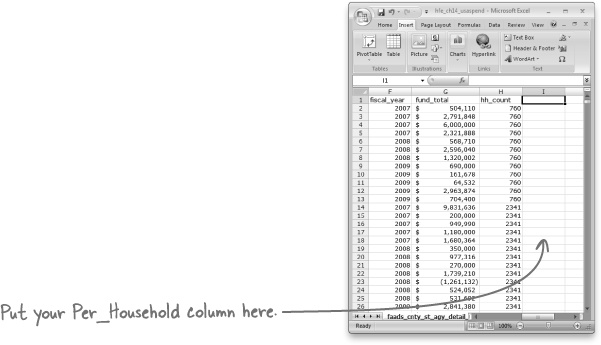
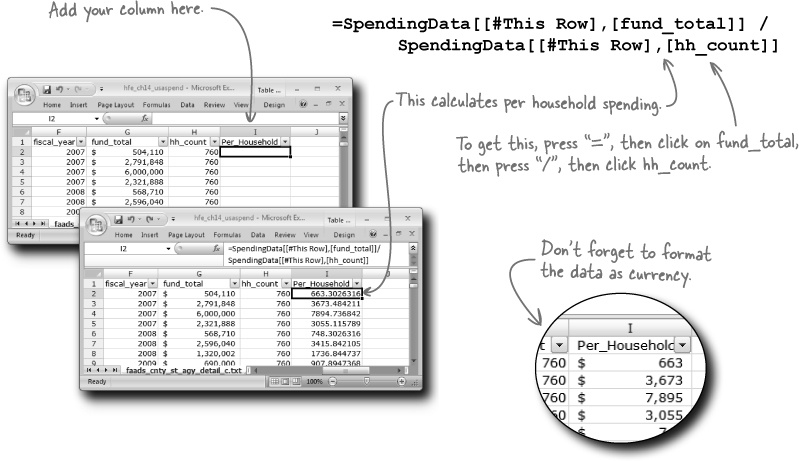
Calculating the Per_Household figure was straightforward, because you had all the data you needed right there on the spreadsheet.
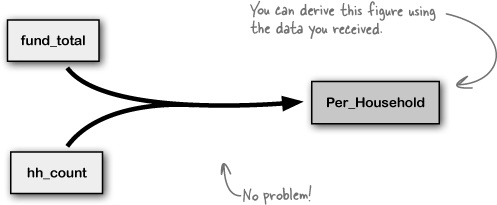
But you’re in a different situation with Region, since there’s nothing implicit in the data that you can use to calculate Region. You need to incorporate more data in order to determine the region for each row.
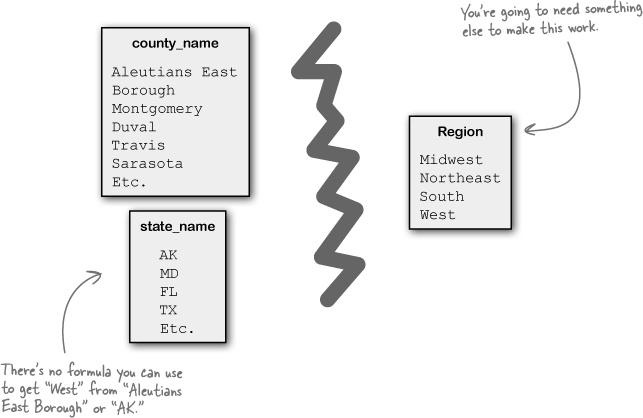
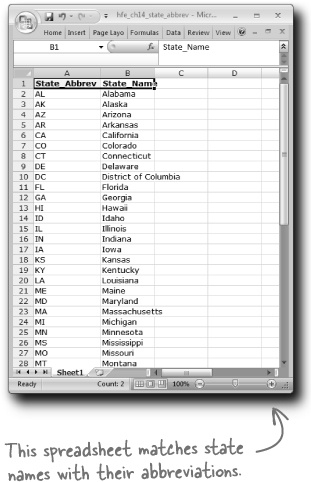
Here’s a lookup key
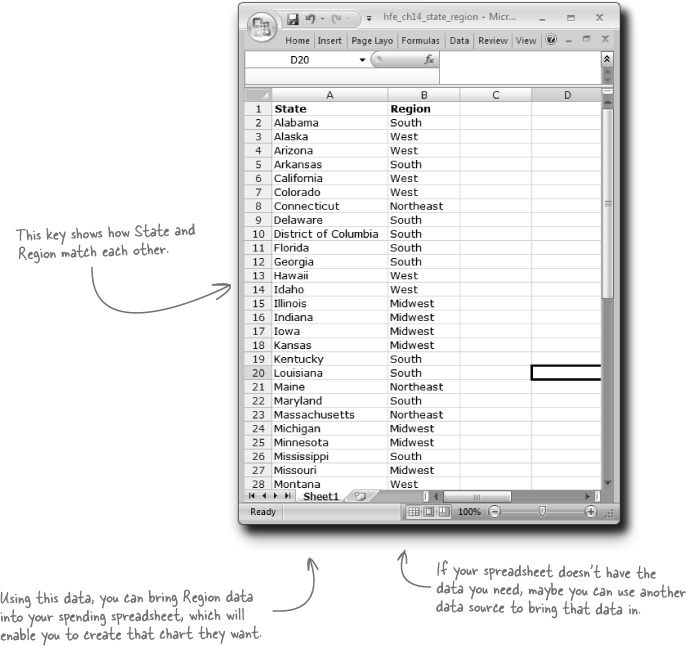
You can poke around in search engines for a few minutes and find data like this: a key that shows how state names fit with regions.
VLOOKUP will cross-reference the two data sources
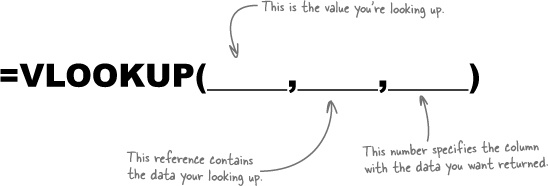
A particularly useful function in Excel is VLOOKUP. The V stands for vertical, and what the function does is look up a reference value in a vertical list and then return the value from another column that matches the position of the value in the vertical list.
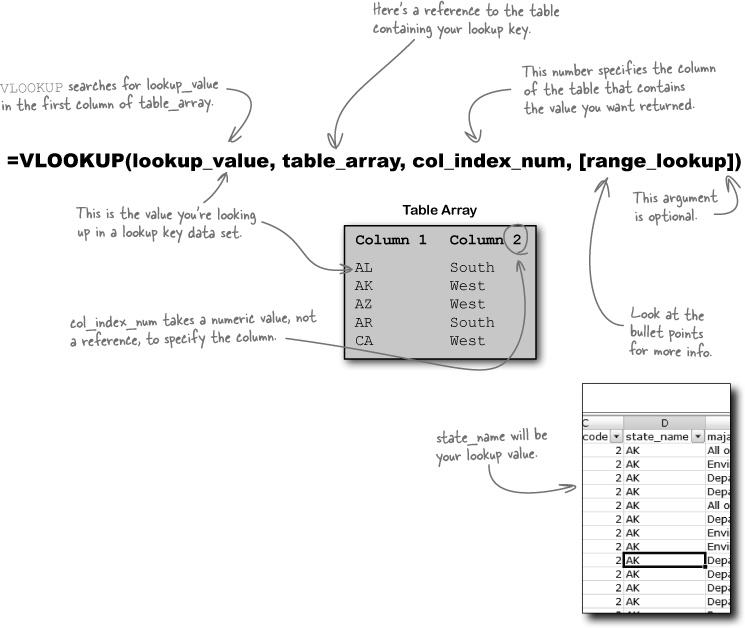
It’s a big function. Let’s give it a shot....
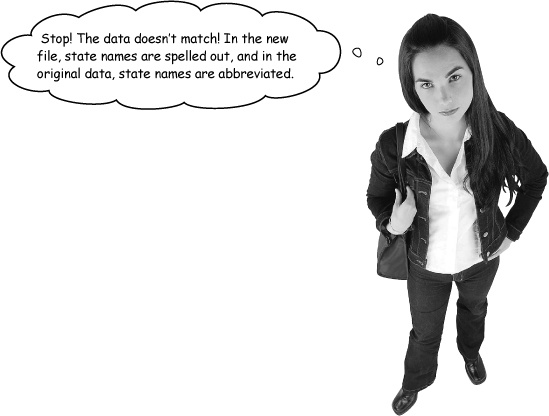
Oh, bother. So it looks like you’re going to have to cross-reference the region to the state abbreviation, then use that abbreviation to cross-reference the region to your original data. Fortunately, VLOOKUP will make quick work of bringing these data sets together.
Copy the state_region data into your state_abbrev spreadsheet like this....
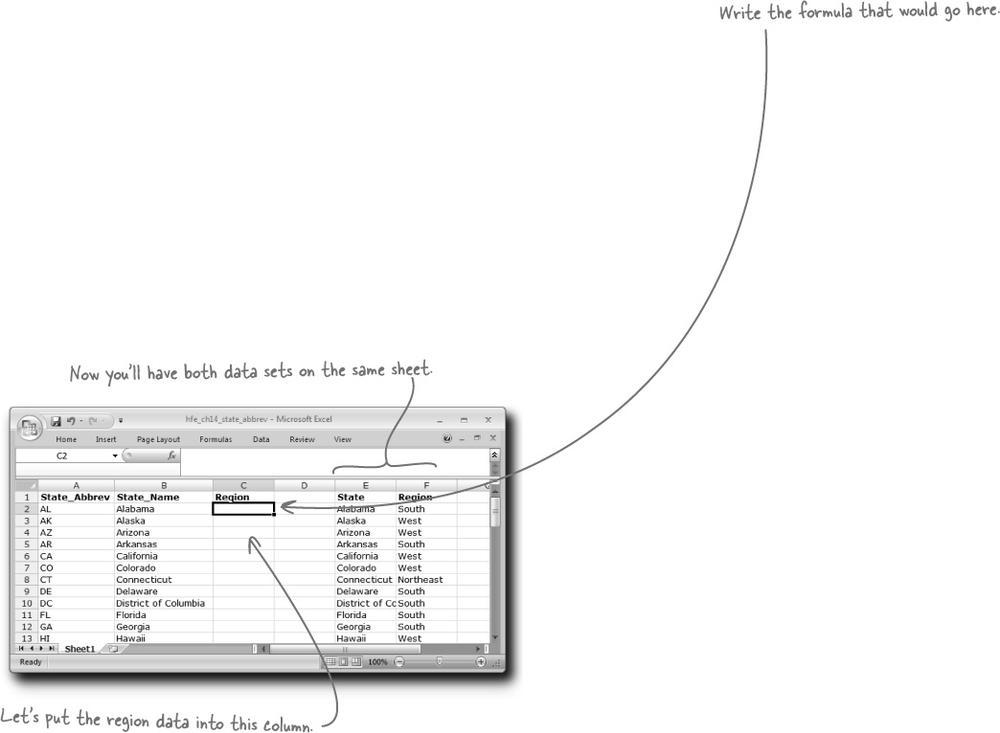
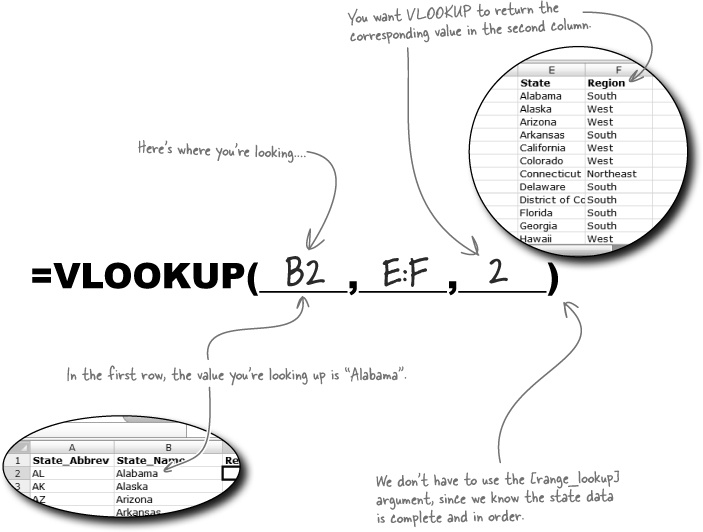
Your job is to take formula elements from the pool and place them into the blank lines in the formula. You may not use the same formula element more than once, and you won’t need to use all of them. Your goal is to make a VLOOKUP formula that puts Region and State_Abbrev into the same table.
Note: Each thing from the pool can be used only once!

You just wrote your first VLOOKUP formula to create a table that relates your Region field to your State_Abbrev field.

You’re just a step away from having all the data you need to create the chart the Geopolitical Grunts want. Create the VLOOKUP formula that will bring region data into your spending spreadsheet and then create the pivot chart your client wants.
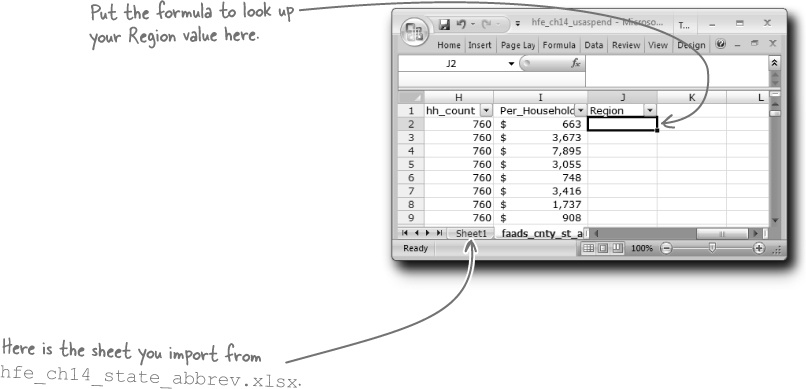
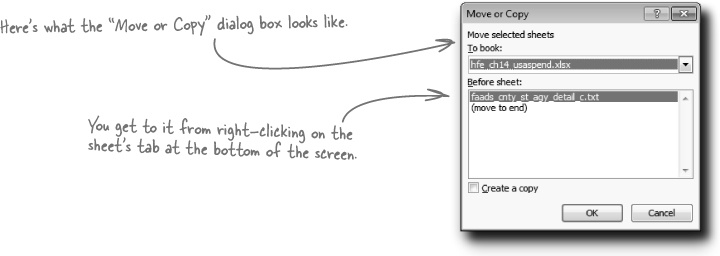
Copy the lookup key sheet you’ve been working on in
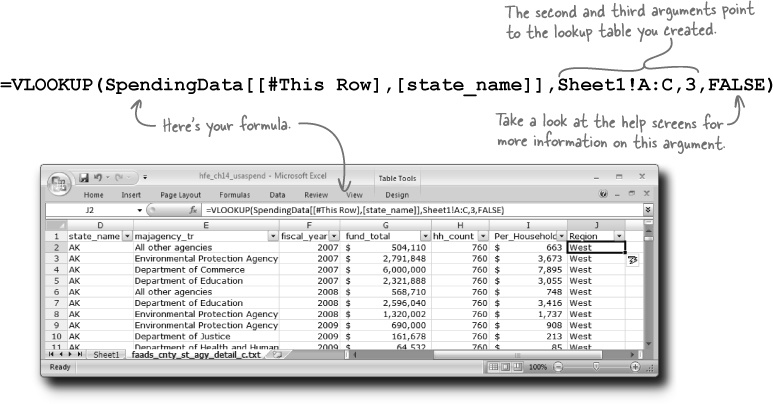
hfe_ch14_state_abbrev.xlsxinto your original workbook. Right-click on Sheet1 and tell Excel to move the sheet into yourhfe_ch14_usaspend.xlsxworkbook.Add a Region column to your original data and then write the
VLOOKUPformula that will look up the region field based on the state abbreviation in that row.NOTE: You will need to have the fourth argument of
VLOOKUPbeFALSE.
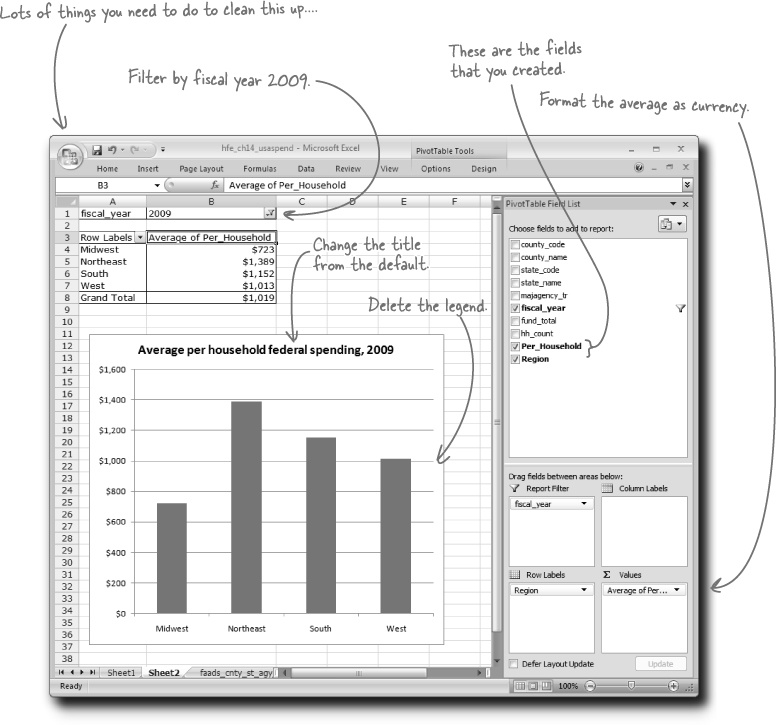
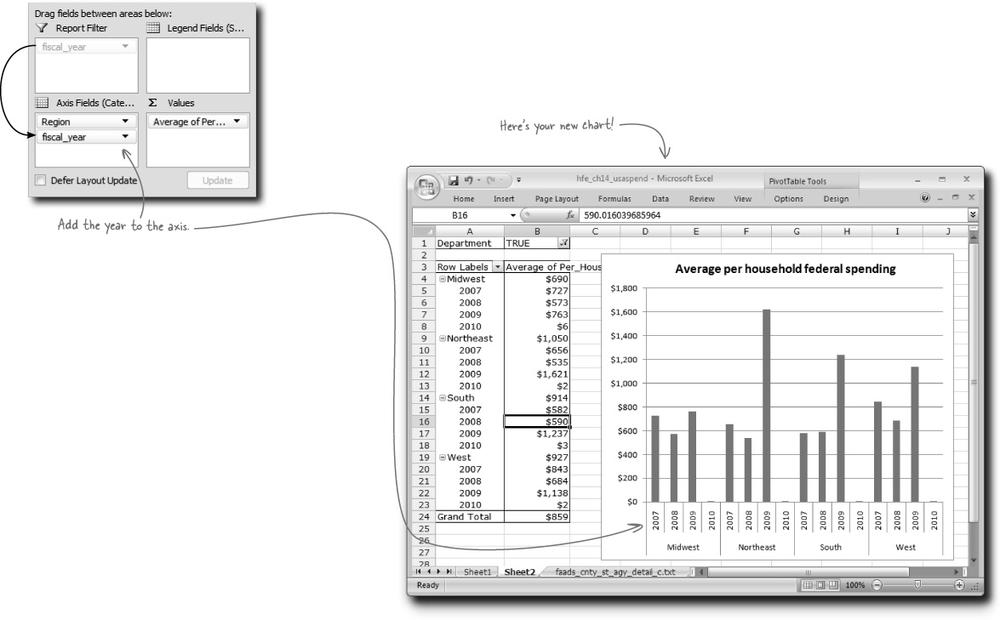
Create the pivot chart that the Geopolitical Grunts want. Just click “Pivot Chart” rather than “Pivot Table” and let Excel create the chart. You will have to change the title and formatting to get the chart right.
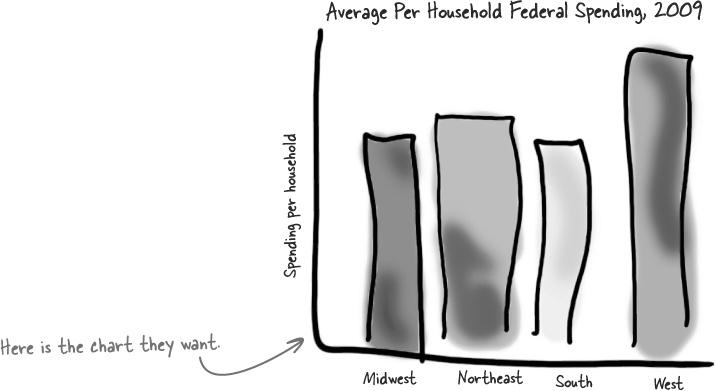
You just added another column to your data set and then created a pivot chart. How does it look?
Copy the lookup key sheet you’ve been working on in
hfe_ch14_state_abbrev.xlsxinto your original workbook. Right-click on Sheet1 and tell Excel to move the sheet into yourhfe_ch14_usaspend.xlsxworkbook.Add a Region column to your original data and then write the
VLOOKUPformula that will look up the region field based on the state abbreviation in that row.Create the pivot chart that the Geopolitical Grunts want. Just click “Pivot Chart” rather than “Pivot Table” and let Excel create the table. You will have to change the title and formatting to get the chart right.
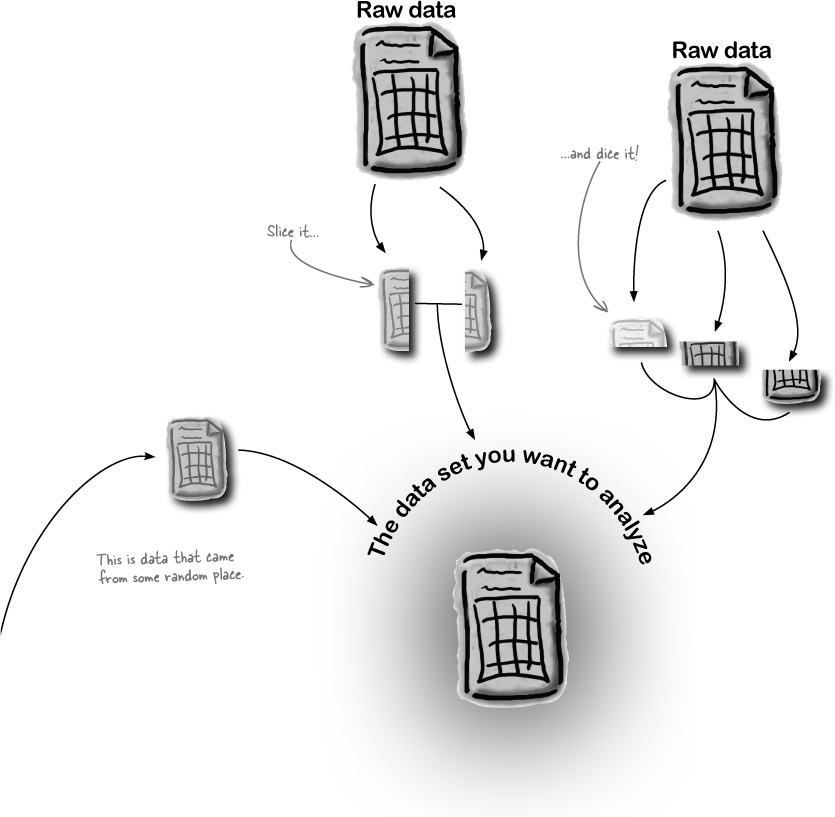
Create segments to feed the right data into your analysis
The data you receive to analyze inside Excel is just a starting point. If that data doesn’t do what you need it to do for your analysis, every tool of Excel is at your disposal to mutate the data into the form you need.
That’s what slicing and dicing data is all about.
Geopolitical Grunts would like a little more nuance

Ah, clients.... What are you going to do? You flash a little skill, and once they know what you’re capable of doing, they’ll never leave you alone!
You just created a new segment to describe transactions originating from department-level organizations. How did it go?
Adding dates to your pivot chart is the easy part. Drag the date field out of the Filter box and into the box that will make the pivot show many bars representing region and year, not just region.
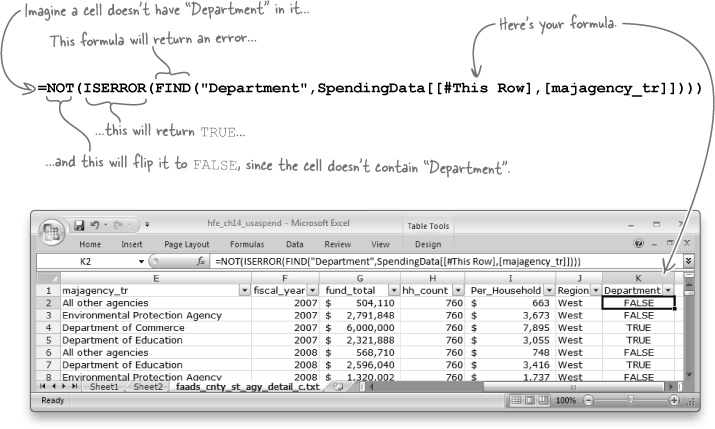
Your raw data rows need a tag to denote whether each transaction is from a department-level organization or not. Create a Boolean data field that contains
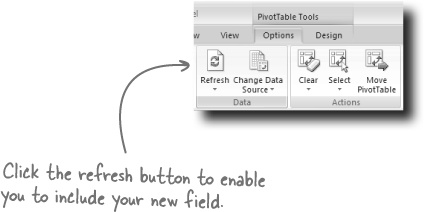
TRUEif the word “Department” is in the majagency_tr field.Head back over to your pivot table. Since you’ve added data to your data table, you’ll need to press the button in the Ribbon to refresh your pivot table. Then add your new field as a filter, showing only data points where it’s
TRUEthat the transaction is from a department-level organization.
You’ve enabled Geopolitical Grunts to follow the money trail...
Which is a good thing, because there’s a whole lot of it. So much of it, that it’s hard to keep track of it all. There’s so much of it that you could get buried in it all


It’s been great having you here in Dataville!
We’re sad to see you leave, but there’s nothing like taking what you’ve learned and putting it to use. You’re just beginning your Excel journey, and we’ve put you in the driver’s seat. We’re dying to hear how things go, so drop us a line at the Head First Labs website, www.headfirstlabs.com, and let us know how data analysis is paying off for YOU!