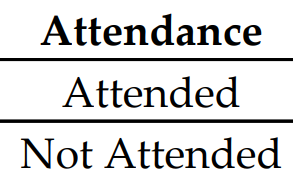
To complete this recipe, do the following:
- Use an Enter Data query to create a table called R08_Attendance with the following data:

- Create the following measure:
Attendance =
    VAR __Training =
        CALCULATE(
            MAX('R08_Training'[Training]),
            ALLEXCEPT('R08_Training','R08_Training'[Training])
        )
    VAR __TrainingDate =
        MAXX(
            FILTER(
                ALL('R08_Training'),
                'R08_Training'[Training] = __Training
            ),
            [Date]
        )
RETURN
    IF(
        COUNTROWS(
            FILTER('R08_Hours','R08_Hours'[Week] = __TrainingDate)
        ) >= 1,
        IF(
            ISBLANK(MAX('R08_Training'[Date])),
            "Not Attended",
            "Attended"
        ),
        BLANK()
    )
- Create the following additional measure:
Worked =
    VAR __Training =
        CALCULATE(
            MAX('R08_Training'[Training]),
            ALLEXCEPT('R08_Training','R08_Training'[Training])
        )
    VAR __TrainingDate =
        MAXX(
            FILTER(
                ALL('R08_Training'),
                'R08_Training'[Training] = __Training
            ),
            'R08_Training'[Date]
        )
RETURN
    IF(
        COUNTROWS(
            FILTER('R08_Hours','R08_Hours'[Week] = __TrainingDate)
        ) >= 1,
        TRUE(),
        FALSE()
    )
- Create the following additional measures:
Attended =
    IF([Worked],
        IF(
            ISBLANK(MAX('R08_Training'[Date])),
            BLANK(),
            "Attended"
        ),
        BLANK()
    )

NotAttended =
    IF([Worked],
        IF(
            ISBLANK(MAX('R08_Training'[Date])),
            "Not Attended",
            BLANK()
        ),
        BLANK()
    )

Attendance Measure to Show =
    IF(HASONEVALUE('R08_Attendance'[Attendance]),
        SWITCH(
                MAX('R08_Attendance'[Attendance]),
                "Attended",[Attended],
                "Not Attended",[NotAttended]
            ),
        MAX('R08_Training'[Date])
    )
- On a Report page, create a Matrix visualization and place the Employee column from the R08_Employees table into the Rows area of the visualization.
- In the same Matrix visualization, place the Training column from the R08_Training table into the Columns area of the visualization.
- In the same Matrix visualization, place the Attendance measure into the Values area.
- On the same Report page, create a Slicer visualization and place the Attendance column from the R08_Attendance table into the Fields area.
- On the same Report page, create a second Matrix visualization and place the Employee column from the R08_Employees table into the Rows area of the visualization.
- In this second Matrix visualization, place the Training column from the R08_Training table into the Columns area of the visualization.
- In this second Matrix visualization, place the Attendance Measures to Show measure into the Values area.