To prepare for this recipe, do the following:
- Open Power BI Desktop.
- Use an Enter Data query to create a table called R08_Currencies that contains the following information:
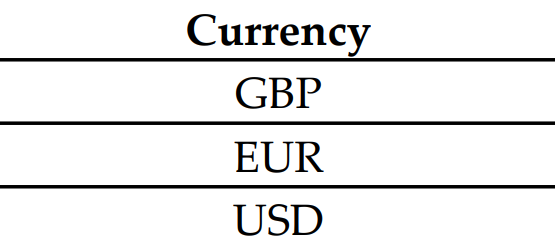
-
Use an Enter Data query to create a table called R08_Rates that contains the following information:
|
From |
To |
Date |
Rate |
|
USD |
EUR |
12/3/2019 |
0.90258 |
|
USD |
GBP |
12/3/2019 |
0.77062 |
|
EUR |
USD |
12/3/2019 |
1.10781 |
|
EUR |
GBP |
12/3/2019 |
0.85373 |
|
GBP |
USD |
12/3/2019 |
1.29746 |
|
GBP |
EUR |
12/3/2019 |
1.17109 |
|
USD |
EUR |
12/15/2019 |
0.90138 |
|
USD |
GBP |
12/15/2019 |
0.76851 |
|
EUR |
USD |
12/15/2019 |
1.10654 |
|
EUR |
GBP |
12/15/2019 |
0.85117 |
|
GBP |
USD |
12/15/2019 |
1.29296 |
|
GBP |
EUR |
12/15/2019 |
1.17109 |
|
USD |
EUR |
12/27/2019 |
0.90361 |
|
USD |
GBP |
12/27/2019 |
0.77332 |
|
EUR |
USD |
12/27/2019 |
1.10929 |
|
EUR |
GBP |
12/27/2019 |
0.85639 |
|
GBP |
USD |
12/27/2019 |
1.30102 |
|
GBP |
EUR |
12/27/2019 |
1.17109 |
-
Use an Enter Data query to create a table called R08_Sales that contains the following information:
|
Date |
Currency |
Amount |
|
12/3/2019 |
USD |
100 |
|
12/4/2019 |
EUR |
100 |
|
12/5/2019 |
GBP |
100 |
|
12/15/2019 |
USD |
200 |
|
12/22/2019 |
EUR |
200 |
|
12/24/2019 |
GBP |
200 |
|
12/27/2019 |
USD |
300 |
|
12/28/2019 |
EUR |
300 |
|
12/29/2019 |
GBP |
300 |
-
Ensure that there are no relationships between these three tables.
It is important to note that currency exchange rates are not purely reciprocal. In other words, it is not necessarily correct that if the currency exchange rate between USD and EUR is .9 then the exchange rate between EUR and USD is 1 + (1 - .9) or 1.1. Exchange rates are actually slightly different when selling a currency or buying a currency between the same conversion currency. This is the reason why our currency exchange rate table requires two rows per currency exchange pair: one for converting from a given currency to a different given currency and the reverse.