Sales
(in millions of dollars)
Earnings
(in millions of dollars)
Questions involving graphs are common on the GRE. Rarely do these questions involve any significant calculating. Usually, the solution is merely a matter of interpreting the graph.
Questions 1-4 refer to the following graphs.
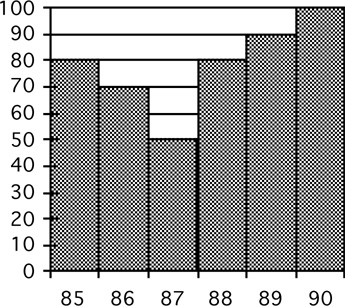
SALES AND EARNINGS OF CONSOLIDATED CONGLOMERATE
Sales |
Earnings |
|
|
Note: Figure drawn to scale.
1. During which year was the company’s earnings 10 percent of its sales?
(A) 85
(B) 86
(C) 87
(D) 88
(E) 90
Reading from the graph, we see that in 1985 the company’s earnings were $8 million and its sales were $80 million. This gives

The answer is (A).
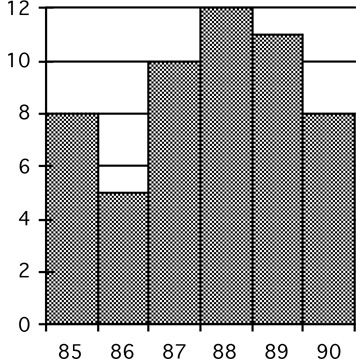
2. During the years 1986 through 1988, what was the average earnings per year?
(A) 6 million
(B) 7.5 million
(C) 9 million
(D) 10 million
(E) 27 million
The graph yields the following information:
Year |
Earnings |
1986 |
$5 million |
1987 |
$10 million |
1988 |
$12 million |
Forming the average yields  . The answer is (C).
3. In which year did sales increase by the greatest percentage over the previous year?
(A) 86
(B) 87
(C) 88
(D) 89
(E) 90
To find the percentage increase (or decrease), divide the numerical change by the original amount. This yields
Year |
Percentage increase |
86 |
|
87 |
|
88 |
|
89 |
|
90 |
|
The largest number in the right-hand column, 60%, corresponds to the year 1988. The answer is (C).
4. If Consolidated Conglomerate’s earnings are less than or equal to 10 percent of sales during a year, then the stockholders must take a dividend cut at the end of the year. In how many years did the stockholders of Consolidated Conglomerate suffer a dividend cut?
(A) None
(B) One
(C) Two
(D) Three
(E) Four
Calculating 10 percent of the sales for each year yields
Year |
10% of Sales (millions) |
Earnings (millions) |
85 |
.10 × 80 = 8 |
8 |
86 |
.10 × 70 = 7 |
5 |
87 |
.10 × 50 = 5 |
10 |
88 |
.10 × 80 = 8 |
12 |
89 |
.10 × 90 = 9 |
11 |
90 |
.10 × 100 = 10 |
8 |
Comparing the right columns shows that earnings were 10 percent or less of sales in 1985, 1986, and 1990. The answer is (D).

![]() Medium
Medium
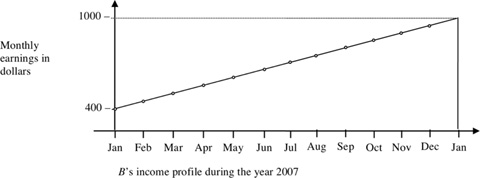
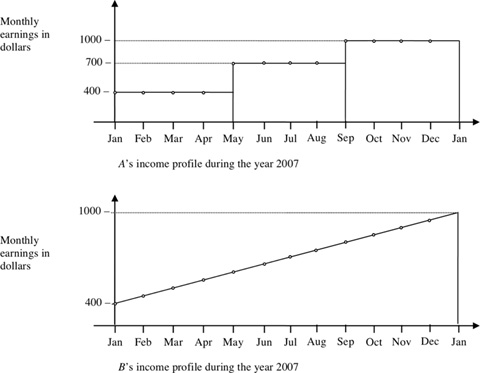
1. A launched 3 products in the year 2007 and earns income from the sales of the products only. The top graph shows his monthly earnings for the year. B’s earnings consist of continuously growing salary, growing by same amount each month as shown in the figure. Which one of the following equals the total earnings of A and B in the year 2007?
(A) 7500, 8100
(B) 7850, 8300
(C) 8150, 8400
(D) 8400, 8100
(E) 8400, 8700
Questions 2–4 refer to the following graph.
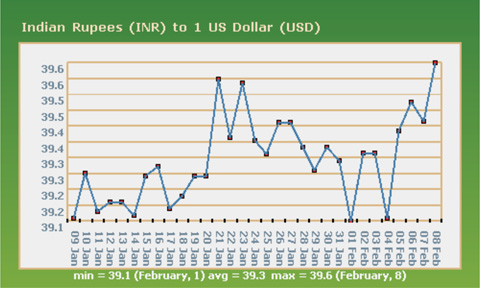
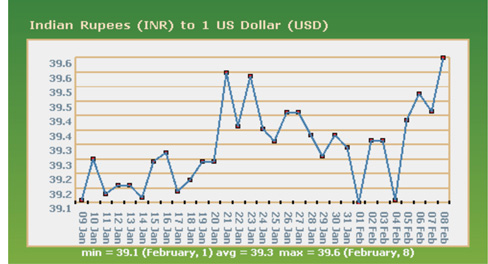
The graph below shows historical exchange rates between the Indian Rupee (INR) and the US Dollar (USD) between January 9 and February 8 of a particular year.
![]() Easy
Easy
2. On which day shown on the graph did the value of the US dollar increase against the Rupee by the greatest amount?
(A) Jan.10
(B) Jan.14
(C) Jan. 21
(D) Jan. 23
(E) Feb. 4
![]() Medium
Medium
3. John had 100 dollars. The exchange rate converts the amount in US dollars to a number in Indian Rupees by directly multiplying by the value of the exchange rate. By what amount did John’s $100increase in terms of Indian Rupees from Jan. 9 to Feb. 8?
(A) 5
(B) 10
(C) 15
(D) 25
(E) 50
![]() Hard
Hard
4. On February 8, the dollar value was approximately what percent of the dollar value on January 9?
(A) 1.28
(B) 12.8
(C) 101.28
(D) 112.8
(E) 128
Questions 5–7 refer to the following graph.
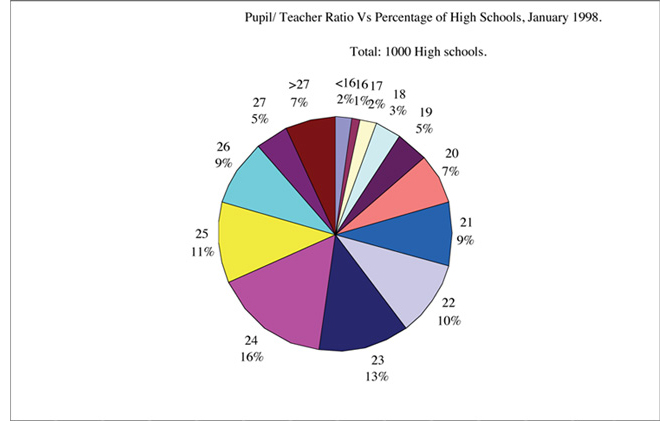
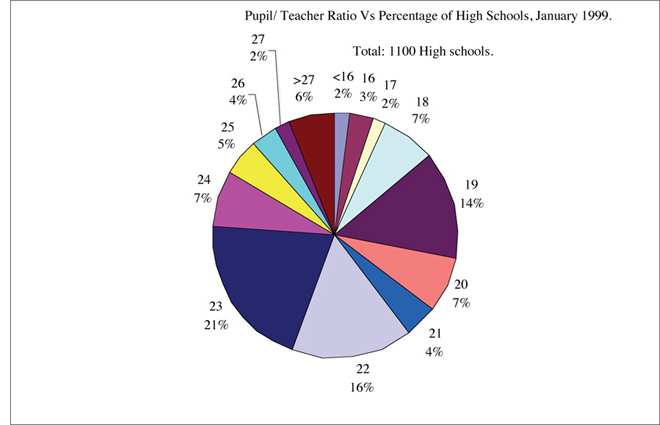
5. By what percent did the number of schools with Pupil/Teacher ratio less than 16 increase in January1999 over January 1998?
(A) –2%
(B) 0%
(C) 2%
(D) 10%
(E) 12%
![]() Hard
Hard
6. In January 1998, what percent of high schools had a Pupil/Teacher ratio less than 23?
(A) 25%
(B) 39%
(C) 50%
(D) 60%
(E) 75%
![]() Hard
Hard
7. If the areas of the sectors in the circle graphs are drawn in proportion to the percent shown, what is the measure, in degrees, of the sector representing the number of high schools with Pupil/Teacher ratio greater than 27 in 1999?
(A) 21.6
(B) 30
(C) 45.7
(D) 56.3
(E) 72
Questions 8–10 refer to the following graph.

![]() Easy
Easy
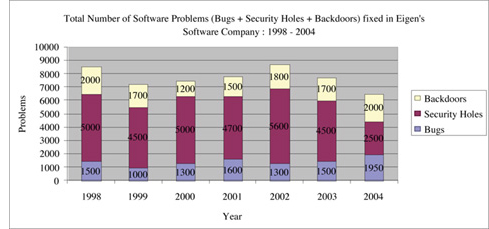
8. What was the number of security holes fixed in 2003?
(A) 1500
(B) 1700
(C) 4500
(D) 6000
(E) 6300
![]() Medium
Medium
9. For which year was the ratio of the Security holes to Bugs fixed by the software company the greatest?
(A) 1998
(B) 1999
(C) 2000
(D) 2001
(E) 2002
![]() Medium
Medium
10. If the total number of software problems solved is a direct measure of the company’s capability, then by approximately what percent did capability increase from 1999 to 2002?
(A) 10%
(B) 20%
(C) 30%
(D) 40%
(E) 50%
Questions 11–15 refer to the following discussion.
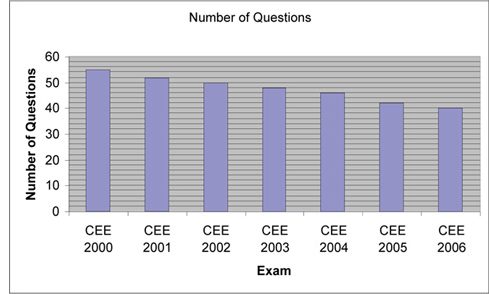
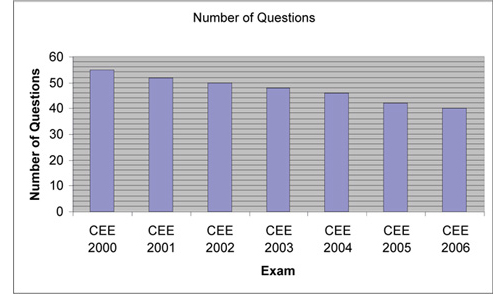
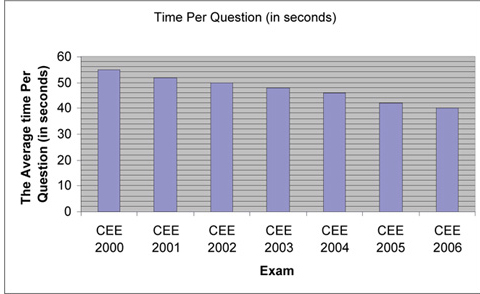
The graphs below provide data on a common entrance examination conducted in different years.

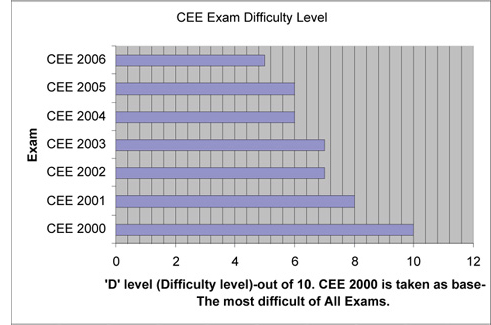
11. In which year were the questions in the exam least difficult?
(A) 2000
(B) 2001
(C) 2002
(D) 2004
(E) 2006
![]() Medium
Medium
12. By approximately what percent did the number of questions decrease from CEE 2000 to CEE 2006?
(A) 11
(B) 22
(C) 27
(D) 33
(E) 37
![]() Medium
Medium
13. In which year were the test takers given the least time to answer all the questions?
(A) 2000
(B) 2001
(C) 2002
(D) 2004
(E) 2006
![]() Medium
Medium
14. If the Pressure Factor for the examinees in an exam is defined as Difficulty level divided by Average Time (in minutes) given per question, then the Pressure Factor equals which one of the following in CEE 2006?
(A) 7.5
(B) 10
(C) 12.5
(D) 15
(E) 17.5
![]() Medium
Medium
15. If the Stress Factor for the examinees in an exam is defined as the product of the Difficulty level and the Number of questions divided by the average time given per question, then the Stress Factor equals which one of the following in the exam CEE 2005?
(A) 2 per second
(B) 3 per second
(C) 4 per second
(D) 6 per second
(E) 9 per second
Questions 16–19 refer to the following graph.
The table below provides the complete semantics of a Common Entrance Test (CET) conducted in different years.
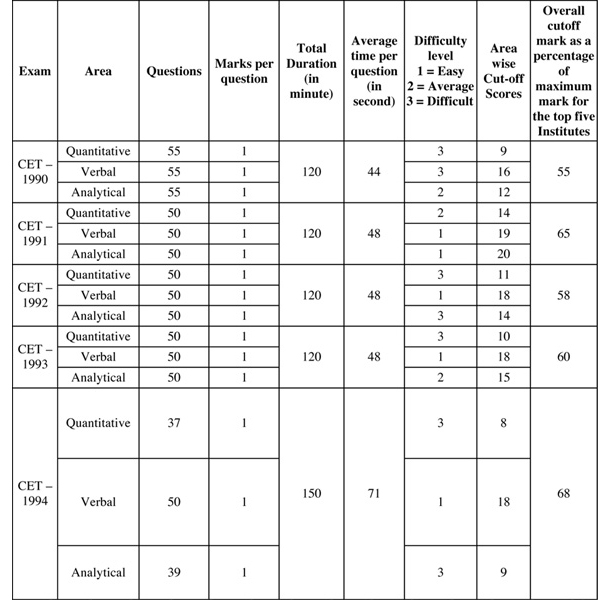
* The Difficulty Factor of the exam is the sum of the products of the number of questions of each type and the corresponding difficulty level. The Stress Factor is the Difficulty Factor divided by the Average Time Per Question.
![]() Medium
Medium
16. By approximately what percent did the number of questions decrease in CET 1994 over the previous year?
(A) 16%
(B) 19%
(C) 35%
(D) 40%
(E) 50%
17. The Difficulty Factor is the greatest for which one of the following exams?
(A) CET 1990
(B) CET 1991
(C) CET 1992
(D) CET 1993
(E) CET 1994
![]() Medium
Medium
18. Which one of the following exams has been marked as having the highest Stress Factor?
(A) CET 1990
(B) CET 1991
(C) CET 1992
(D) CET 1993
(E) CET 1994
![]() Hard
Hard
19. Which one of the following statements can be inferred from the table?
(I) As the Stress Factor increased, the cut off marks of the top five universities decreased
(II) As the Difficulty Factor of the exam decreased, the cut off marks of the top five universities increased
(III) As the Difficulty Factor increased, the Stress Factor increased
(A) (I) only
(B) (II) only
(C) (III) only
(D) (I), and (II)
(E) (I), and (III)
Questions 20–23 refer to the following table.
2007 Composition of Maryland Employment by Industry (Annual Average by Place of Work).
Industry Groups and Totals |
Number of Establishments |
Employment |
Percent of Total Employment |
Federal Government |
4,564 |
455,492 |
8.12% |
State Government |
849 |
1,121,712 |
19.99% |
Local Government |
345 |
96,972 |
1.73% |
Total Government Sector |
5,758 |
1,674,176 |
9.20% |
Natural Resources and Mining |
23,449 |
331,590 |
5.91% |
Construction |
749 |
6,836 |
0.30% |
Manufacturing |
19,335 |
188,420 |
3.36% |
Service-Providing |
14,283 |
136,334 |
2.43% |
Utilities |
121,238 |
1,041,777 |
31.04% |
Wholesale Trade |
2,320 |
9,711 |
0.17% |
Retail Trade |
11,342 |
94,997 |
1.69% |
Transportation and Warehousing |
18,593 |
299,648 |
5.34% |
Information |
3,998 |
65,765 |
1.17% |
Financial Analysis Professional and Business |
2,898 |
50,726 |
0.904082362 |
Services |
14,828 |
344,565 |
6.14113352 |
Education and Health Services |
36,384 |
347,821 |
6.19916475 |
Leisure and Hospitality |
16,534 |
229,219 |
4.085337989 |
Other Services |
13,733 |
87,309 |
1.556096024 |
Unclassified |
1,802 |
1,878 |
0.03347133 |
Total Private Sector |
301,486 |
3,936,596 |
70 |
Total Employment |
307,244 |
5,610,772 |
100 |
![]() Easy
Easy
20. In 2007, how many industry groups consisted of more than 1 million employees?
(A) 0
(B) l
(C) 2
(D) 3
(E) 4
![]() Easy
Easy
21. Which one of the following industry groups employs the maximum number of people?
(A) Utilities
(B) Information
(C) State Government
(D) Natural Resources and Mining
(E) Transportation and Warehousing
22. Which one of the following industry groups employs more than 10 employees per establishment?
(A) Construction
(B) Manufacturing
(C) Wholesale Trade
(D) Retail Trade
(E) Transportation and Warehousing
![]() Hard
Hard
23. Which one of the following is a valid inference?
(I) The State Government can be inferred as employing the highest number of Employees per Establishment only because the Percentage Employment it provides is the highest. The number of Establishments is not important.
(II) The State Government can be inferred as employing the highest number of Employees per Establishment since it has the least number of organizations and offers the highest Employment.
(III) The State Government can be inferred as employing the highest number of Employees per Establishment since it has the least number of organizations and offers the highest Percentage of Employment.
(A) I only
(B) II only
(C) III only
(D) I and II
(E) II and III
Answers and Solutions to Problem Set V
![]() Medium
Medium
1. A launched 3 products in the year 2007 and earns income from the sales of the products only. The top graph shows his monthly earnings for the year. B’s earnings consist of continuously growing salary, growing by same amount each month as shown in the figure. Which one of the following equals the total earnings of A and B in the year 2007?
(A) 7500,8100
(B) 7850,8300
(C) 8150,8400
(D) 8400,8100
(E) 8400,8700
From the figure, the monthly income of A for the first four months is $400. Hence, the net earnings in the 4 months is 4 × 400 = 1600 dollars.
From the figure, the monthly income of A for the second four months is $700. Hence, the net earnings in the 4 months is 4 × 700 = 2800 dollars.
From the figure, the monthly income of A for the last four months is $1000. Hence, the net earnings in the 4 months is 4 × 1000 = 4000 dollars.
Hence, the total income in the year is 1600 + 2800 + 4000 = 8400 dollars.
The monthly income of B grew regularly from 400 in January to 950 in December. Hence, the net income is 400 + 450 + 500 + 550 + 600 + 650 + 700 + 750 + 800 + 850 + 900 + 950 = 8100.
Questions 2–4 refer to the following graph.
The graph below shows historical exchange rates between the Indian Rupee (INR) and the US Dollar (USD) between January 10 and February 8 of a particular year.
![]() Easy
Easy
2. On which day shown on the graph did the value of the US dollar increase against the Rupee by the greatest amount?
(A) Jan. 10
(B) Jan.14
(C) Jan. 21
(D) Jan. 23
(E) Feb. 4
Here, the scale of the x-axis is uniform. Hence, growth is greatest when the curve is steepest. The growth curve of the US dollar against the Indian Rupee is the steepest (increased by a bit more than six horizontal lines on the graph) on January 21. Hence, the answer is (C). On February 5th, the growth is the next greatest, growing by a bit less than 6 horizontal lines.
![]() Medium
Medium
3. John had 100 dollars. The exchange rate converts the amount in US dollars to a number in Indian Rupees by directly multiplying by the value of the exchange rate. By what amount did John’s $100 increase in terms of Indian Rupees from Jan. 9 to Feb. 8?
(A) 5
(B) 10
(C) 15
(D) 25
(E) 50
One dollar converted to 39.1 Rupees on Jan. 9. Hence, 100 dollars converts to 39.15 × 100 = 3915 Indian Rupees. On February 8, it converted to 39.65 Rupees. Hence, on that day, 100 dollars converted to 39.65 × 100 = 3965 Rupees. The increase in terms of Indian Rupees is 3965 – 3915 = 50. The answer is (E).
![]() Hard
Hard
4. On February 8, the dollar value was approximately what percent of the dollar value on January 9?
(A) 1.28
(B) 12.8
(C) 101.28
(D) 112.8
(E) 128
On January 9, the dollar value was 39.15 Rupees, and on February 8 the dollar value was 39.65 Rupees. Hence, the dollar value on February 8th was 39.65/39.15 × 100 = (39.15 + 0.5)/39.15 × 100 = 100 + 0.5/39.15 × 100 = (100 + 1.28) = 101.28 percent of the value on January 9th. Hence, the answer is (C).
Questions 5-7 refer to the following graph.
5. By what percent did the number of schools with Pupil/Teacher ratio less than 16 increase in January1999 over January 1998?
(A) –2%
(B) 0%
(C) 2%
(D) 10%
(E) 12%
In January 1998, the Pupil/Teacher ratio is less than 16 in 2% of the schools. The number of schools in 1998 is 1000. Hence, 2% of 1000 is 2/100 × 1000 = 20. So, 20 schools have pupil/Teacher ratio less than16.
In January 1999, the pupil/Teacher ratio is less than 16 in 2% of schools again. The number of schools in 1999 is 1100. Hence, 2% of 1100 is 2/100 × 1100 = 22. In 1999, there are 22 schools with the ratio less than 16.
The percentage increase equals (22 – 20)/20 × 100 = 2/20 × 100 = 10%. The answer is (D).
![]() Hard
Hard
6. In January 1998, what percent of high schools had a Pupil/Teacher ratio less than 23?
(A) 25%
(B) 39%
(C) 50%
(D) 60%
(E) 75%
The number of schools having a ratio less than 23 is
The number of schools having the Pupil/Teacher ratio less than 16
+ The number of schools having the Pupil/Teacher ratio equal to 16
+ The number of schools having the Pupil/Teacher ratio equal to 17
+ The number of schools having the Pupil/Teacher ratio equal to 18
+ The number of schools having the Pupil/Teacher ratio equal to 19
+ The number of schools having the Pupil/Teacher ratio equal to 20
+ The number of schools having the Pupil/Teacher ratio equal to 21
+ The number of schools having the Pupil/Teacher ratio equal to 22
= 2% + 1% + 2% + 3% + 5% + 7% + 9% + 10%
= 39%
The answer is (B).
Method II:
The number of schools having the ratio less than 23 equals
100%
- (The number of schools having the Pupil Teacher ratio greater than 27
+ The number of schools having the Pupil/Teacher ratio equal to 27
+ The number of schools having the Pupil/Teacher ratio equal to 26
+ The number of schools having the Pupil/Teacher ratio equal to 25
+ The number of schools having the Pupil/Teacher ratio equal to 24
+ The number of schools having the Pupil/Teacher ratio equal to 23
)
= 100 – (7% + 5% + 9% + 11% + 16% + 13%) = 100 – 61% = 39%.
The answer is (B).
7. If the areas of the sectors in the circle graphs are drawn in proportion to the percent shown, what is the measure, in degrees, of the sector representing the number of high schools with Pupil/Teacher ratio greater than 27 in 1999?
(A) 21.6
(B) 30
(C) 45.7
(D) 56.3
(E) 72
From the chart, in 1999, 6% of schools have a Pupil/Teacher ratio greater than 27. Hence, the fraction of the angle that the sector makes in the complete angle of the circle also equals 6% = 6/100. Since the complete angle is 360°, the part of the angle equals 6/100 × 360 = 21.6°. The answer is (A).
Questions 8–10 refer to the following graph.
![]() Easy
Easy
8. What was the number of security holes fixed in 2003?
(A) 1500
(B) 1700
(C) 4500
(D) 6000
(E) 6300
From the graph, the number of security holes fixed in 2003 is 4500. The answer is (C).
![]() Medium
Medium
9. For which year was the ratio of the Security holes to Bugs fixed by the software company the greatest?
(A) 1998
(A) 1999
(A) 2000
(D) 2001
(E) 2002
Let’s calculate the ratio and find the year in which the ratio is the greatest:
Choice (A): Year 1998. The number of security holes to bugs fixed is 5000/1500 = 10/3 = 3.33.
Choice (B): Year 1999. The number of security holes to bugs fixed is 4500/1000 = 9/2 = 4.5 > Choice (A). Reject choice (A).
Choice (C): Year 2000. The number of security holes to bugs fixed is 5000/1300 = 50/13 = 3.86 < Choice (B). Reject choice (C).
Choice (D): Year 2001. The number of security holes to bugs fixed is 4700/1600 = 47/16 = 2.9375 < Choice (B). Reject choice (D).
Choice (E): Year 2002. The number of security holes to bugs fixed is 5600/1300 = 56/13 = 4.3 < Choice (B). Reject choice (E).
The ratio is greatest in the year 1999. Hence, the answer is (B).
![]() Medium
Medium
10. If the total number of software problems solved is a direct measure of the company’s capability, then by approximately what percent did capability increase from 1999 to 2002?
(A) 10%
(B) 20%
(C) 30%
(D) 40%
(E) 50%
In 1999, the total number of software problems solved by Eigen’s Software Company is Bugs + Security holes + Backdoors = 1000 + 4500 + 1700 = 7200.
In 2002, the total number of software problems solved by Eigen’s Software Company is Bugs + Security holes + Backdoors = 1300 + 5600 + 1800 = 8700.
Hence, the percent increase in the number in the period is  . The nearest answer is (B).
Questions 11–15 refer to the following discussion.
The graphs below provide data on a common entrance examination conducted in different years.
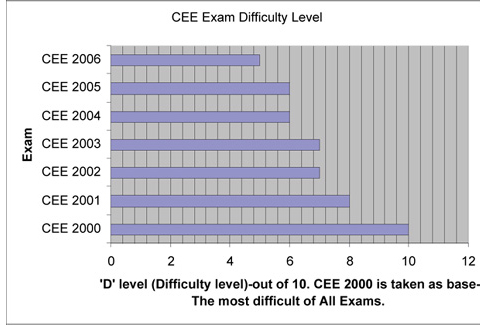
11. Which year had the second most difficult exam?
(A) 2000
(B) 2001
(C) 2002
(D) 2004
(E) 2006
Refer to the graph CEE Exam Difficulty Level. The graph starts at 0 for each exam and ends at 10 for the most difficult exam, CEE 2000. So, the difficulty actually increases with ‘D-level’ value. The second highest value corresponds to the Exam CEE 2001. The answer is (B).
![]() Medium
Medium
12. By approximately what percent did the number of questions decrease from CEE 2000 to CEE 2006?
(A) 11
(B) 22
(C) 27
(D) 33
(E) 37
From the graph, the number of questions in CEE 2000 is 55. The number in CEE 2006 is 40. Hence, the percent drop is  . Since the nearest choice is (C), the answer is (C).
![]() Medium
Medium
13. In which year were the test takers given the least time to answer all the questions?
(A) 2000
(B) 2001
(C) 2002
(D) 2004
(E) 2006
The time given can be evaluated as (Number of Questions) × (Time Per Question).
Both the number of questions and the time given per question are the least in 2006. Hence, their product should be minimum in that year.
Hence, the total time given is the least in 2006. The answer is (E).
![]() Medium
Medium
14. If the Pressure Factor for the examinees in an exam is defined as Difficulty level divided by Average Time (in minutes) given per question, then the Pressure Factor equals which one of the following in CEE 2006?
(A) 7.5
(B) 10
(C) 12.5
(D) 15
(E) 17.5
The Pressure Factor in 2006 equals Difficulty level divided by Average Time given per question = 5/40 seconds or 5/(2/3 minutes) = 15/2 per minute. The answer is (A).
15. If the Stress Factor for the examinees in an exam is defined as the product of the Difficulty level and the Number of questions divided by the average time given per question, then the Stress Factor equals which one of the following in the exam CEE 2005?
(A) 2 per second
(B) 3 per second
(C) 4 per second
(D) 6 per second
(E) 9 per second
The Stress Factor equals
(The Difficulty level) × (Number of questions/Time given per question) =
6 per second
The answer is (D).
Questions 16–19 refer to the following graph.
The table below provides the complete semantics of a Common Entrance Test (CET) conducted in different years.

* The Difficulty Factor of the exam is the sum of the products of the number of questions of each type and the corresponding difficulty level. The Stress Factor is the Difficulty Factor divided by the Average Time Per Question.
16. By approximately what percent did the number of questions decrease in CET 1994 over the previous year?
(A) 16%
(B) 19%
(C) 35%
(D) 40%
(E) 50%
CET 1993 asks 50 quantitative, 50 verbal, and 50 Analytical.
The total is 50 + 50 + 50 = 150.
CET 1994 asks 37 quantitative, 50 verbal, and 39 Analytical.
The total is 37 + 50 + 39 = 126.
The decrease percent is  .
.
The answer is (A).
![]() Medium
Medium
17. The Difficulty Factor is the greatest for which one of the following exams?
(A) CET 1990
(B) CET 1991
(C) CET 1992
(D) CET 1993
(E) CET 1994
The Difficulty Factor of the exam is the sum of the products of the number of questions of each type and the corresponding difficulty level.
Let’s calculate the Difficulty Factor for each exam and pick the answer-choice that has greatest value:
Choice (A): In CET 1990, the Difficulty Factor is (3 × 55 + 3 × 55 + 2 × 55) = 165 + 165 + 110 = 440.
Choice (B): In CET 1991, the Difficulty Factor is (2 × 50 + 1 × 50 + 1 × 50) = 100 + 50 + 50 = 200 < Choice (A). Reject the current choice.
Choice (C): In CET 1992, the Difficulty Factor is (3 × 50 + 1 × 50 + 3 × 50) = 350 < Choice (A). Reject the current choice.
Choice (D): In CET 1993, the Difficulty Factor is (3 × 50 + 1 × 50 + 2 × 50) = 300 < Choice (A). Reject the current choice.
Choice (E): In CET 1994, the Difficulty Factor is (3 × 37 + 1 × 50 + 3 × 39) = 111 + 50 + 117 = 278 < Choice (A). Reject the current choice.
The answer is (A).
18. Which one of the following exams has been marked as having the highest Stress Factor?
(A) CET 1990
(B) CET 1991
(C) CET 1992
(D) CET 1993
(E) CET 1994
The Difficulty Factor of the exam is the sum of the products of the number of questions of each type and the corresponding difficulty level.
Then
The Stress Factor = the Difficulty Factor divided by the average time per question.
Let’s calculate the Stress Factor for each answer-choice and choose the one that has the highest value:
Choice (A): In CET 1990,
The Difficulty Factor is (3 × 55 + 3 × 55 + 2 × 55) = 165 + 165 + 110 = 440
The Stress Factor is 440/44 = 10.
Choice (B): In CET 1991,
Difficulty Factor is (2 × 50 + 1 × 50 + 1 × 50) = 100 + 50 + 50 = 200.
The Stress Factor is 200/48 < Choice (A). Reject.
Choice (C): In CET 1992,
Difficulty Factor is (3 × 50 + 1 × 50 + 3 × 50) = 350.
The Stress Factor is 350/48 < Choice (A). Reject.
Choice (D): In CET 1993,
Difficulty Factor is (3 × 50 + 1 × 50 + 2 × 50) = 300.
The Stress Factor is 300/48 < Choice (A). Reject.
Choice (E): In CET 1994,
Difficulty Factor is (3 × 37 + 1 × 50 + 3 × 39) = 111 + 50 + 117 = 278.
The Stress Factor is 278/71 < Choice (A). Reject.
Hence, the answer is (A).
![]() Hard
Hard
19. Which one of the following statements can be inferred from the table?
(I) As the Stress Factor increased, the cut off marks of the top five universities decreased
(II) As the Difficulty Factor of the exam decreased, the cut off marks of the top five universities increased
(III) As the Difficulty Factor increased, the Stress Factor increased
(A) (I) only
(B) (II) only
(C) (III) only
(D) (I), and (II)
(E) (I), and (III)
The increasing order of the Difficulty Factor is
CET 1991 (200) < CET 1994 (278) < CET 1993 (300) < CET 1992 (350) < CET 1990 (440).
The increasing order of the Stress Factor is
CET 1994 (278/71 = 3.92) < CET 1991 (200/48 = 4.16) < CET 1993(300/48 = 6.25) < CET 1992(350/48 = 7.29) < CET 1990 (440/44 = 10).
The decreasing order of the cut off marks is
CET 1994 (68) > CET 1991 (65) > CET 1993 (60) > CET 1992 (58) > CET 1990 (55).
The decreasing order of the cut off marks matches the increasing order of the Stress Factor.
The decreasing order of the cut off marks does not match the increasing order of the Difficulty Factor.
As the Difficulty Factor increased, the Stress Factor did not increase. Hence, III is false. The answer is (A), only I is true.
Questions 20–23 refer to the following table.
2007 Composition of Maryland Employment by Industry (Annual Average by Place of Work).
Industry Groups and Totals |
Number of Establishments |
Employment |
Percent of Total Employment |
Federal Government |
4,564 |
455,492 |
8.12% |
State Government |
849 |
1,121,712 |
19.99% |
Local Government |
345 |
96,972 |
1.73% |
Total Government Sector |
5,758 |
1,674,176 |
9.20% |
Natural Resources and Mining |
23,449 |
331,590 |
5.91% |
Construction |
749 |
6,836 |
0.30% |
Manufacturing |
19,335 |
188,420 |
3.36% |
Service-Providing |
14,283 |
136,334 |
2.43% |
Utilities |
121,238 |
1,041,777 |
31.04% |
Wholesale Trade |
2,320 |
9,711 |
0.17% |
Retail Trade |
11,342 |
94,997 |
1.69% |
Transportation and Warehousing |
18,593 |
299,648 |
5.34% |
Information |
3,998 |
65,765 |
1.17% |
Financial Analysis Professional and Business |
2,898 |
50,726 |
0.904082362 |
Services |
14,828 |
344,565 |
6.14113352 |
Education and Health Services |
36,384 |
347,821 |
6.19916475 |
Leisure and Hospitality |
16,534 |
229,219 |
4.085337989 |
Other Services |
13,733 |
87,309 |
1.556096024 |
Unclassified |
1,802 |
1,878 |
0.03347133 |
Total Private Sector |
301,486 |
3,936,596 |
70 |
Total Employment |
307,244 |
5,610,772 |
100 |
![]() Easy
Easy
20. In 2007, how many industry groups consisted of more than 1 million employees?
(A) 0
(B) l
(C) 2
(D) 3
(E) 4
From the chart, the employment is greater than 1 million in the industry groups State Government and Utilities. Hence, the answer is 2, which is in choice (C).
![]() Easy
Easy
21. Which one of the following industry groups employs the maximum number of people?
(A) Utilities
(B) Information
(C) State Government
(D) Natural Resources and Mining
(E) Transportation and Warehousing
From the table, the State Government employs the maximum number. The number is 1,121,712. The answer is (C).
22. Which one of the following industry groups employs more than 10 employees per establishment?
(A) Construction
(B) Manufacturing
(C) Wholesale Trade
(D) Retail Trade
(E) Transportation and Warehousing
The correct choice is the industry that employs more than 10 employees per establishment in an average. Hence, the industry with the criterion: The Number of Establishments · 10 < the Number of Employees would be the correct choice.
Choice (A): Construction.
The number of establishments = 749.
The Number of Establishments × 10 = 7490.
The number of Employees = 6,836.
Here, The Number of Establishments × 10 is not less than The number of Employees.
Reject the choice.
Choice (B): Manufacturing.
The number of Establishments = 19,335.
The Number of Establishments × 10 = 193350.
The number of Employees = 188,420.
Here, The Number of Establishments × 10 is not less than The number of Employees.
Reject the choice.
Choice (C): Wholesale Trade.
The number of Establishments = 2,320.
The Number of Establishments × 10 = 23,200.
The number of Employees = 9,711.
Here, The Number of Establishments × 10 is not less than The number of Employees.
Reject the choice.
Choice (D): Retail Trading.
The number of Establishments = 11,342.
The Number of Establishments × 10 = 113,420.
The number of Employees = 94,997.
Here, The Number of Establishments × 10 is not less than The number of Employees.
Reject the choice.
Choice (E): Transportation and Warehousing.
The number of Establishments = 18,593.
The Number of Establishments × 10 =.185,930.
The number of Employees = 299,648.
Here, The Number of Establishments × 10 is less than The number of Employees.
Accept.
The answer is (E).
23. Which one of the following is a valid inference?
(I) The State Government can be inferred as employing the highest number of Employees per Establishment only because the Percentage Employment it provides is the highest. The number of Establishments is not important.
(II) The State Government can be inferred as employing the highest number of Employees per Establishment since it has the least number of organizations and offers the highest Employment.
(III) The State Government can be inferred as employing the highest number of Employees per Establishment since it has the least number of organizations and offers the highest Percentage of Employment.
(A) I only
(B) II only
(C) III only
(D) I and II
(E) II and III
The Employment per establishment is given as The Number of Employees/The Number of Establishments. The ratio is greatest when the numerator has the greatest positive value, and the denominator has the smallest positive value. Hence, II is true.
The highest employment can also be directly understood by the highest percentage employment. Hence, just as Statement II is true because of the highest employment, Statement III is also true because of the highest percentage employment.
Hence, II and III are correct and the answer is (E).