3
COMPONENTS
Afew years ago, I provided some professional advice on a hospital that was being planned in a snowy climate. The footprint of the hospital had been tentatively laid out, and I estimated the likely amount and location of snow deposition during a typical snowstorm. The location that would likely have the highest deposition of snow was right at the ambulance and emergency room entrance to the hospital. If the hospital had been built as planned, this would have created an ongoing maintenance problem for the life of the hospital—and could potentially have put people's lives at risk. It's a simple but poignant example of why microclimate should be considered early in the design process—before major decisions about location and orientation are made. In this chapter, we are going to learn about each of the components of the energy budget and consider ways that each can be understood and modified by the landscape.
There is a game that we sometimes play at faculty retreats to get things rolling. Each person in turn tells two true things about themselves and one lie. Everyone else has to guess which statement is the lie. It has led to some interesting insights about our colleagues and their lives before academia!
Let's play the same game now using statements about microclimate. Before we do this, though, let's broaden our understanding of microclimate to include not only flows of energy but also atmospheric characteristics, such as the composition of the air and the movement of sound through the air.
Here are three statements, two of which are true and one of which is a lie. Can you spot the lie? 1. Trees cause air pollution. 2. Ozone damages plants. 3. Trees reduce noise. There might seem to be at least two lies in the group. Trees are well known for removing pollution from the air, right? How could they cause it? And we hear about the ozone layer all the time and how important it is to preserve it—but it's high up in the atmosphere. How could it damage plants? The only one you might be sure of is that vegetation reduces noise in the landscape because we see it used that way all the time.
Well, just like at our faculty meetings, the things that seem to be obviously true are actually lies, and sometimes the obvious lies turn out to be true. Consider the statement about trees causing air pollution. You were right in thinking that in some cases trees can remove small amounts of pollution from the air, but in many cases trees actually contribute to air pollution in urban environments. When trees open the stomata on their leaves to take in oxygen, they give off, among other things, hydrocarbons. On warm sunny days, these emissions combine with nitrogen oxide from the exhaust of automobiles to create pollution. Certain trees, such as poplars and willows, are particularly big offenders, while other trees, such as oaks and maples, are less problematic. But the fact can't be avoided: trees cause air pollution! So when landscape architects are considering which species of trees to plant in urban areas, they need to take into account the effect the trees will have on the composition of the air.
What about the second statement, the one about ozone? Well, ozone in the upper atmosphere intercepts a wavelength of solar radiation that is dangerous to life on earth. The depletion of this ozone is causing serious problems on earth in several ways, not the least of which is that it is making it dangerous for people to be outdoors on sunny days. However, ozone also occurs at the surface of the earth as an air pollutant—and is therefore a component of the microclimate. When plants open the stomata on their leaves to take a breath, ozone enters the plant and can cause serious damage. Some plants are more susceptible than others, with some grain crops suffering serious damage. So, when landscape architects are working in areas known to have ground-level ozone problems, they have to be selective in the plants that they use, choosing those that are not susceptible to ozone damage.
For those of you keeping track, this means that the first two statements are true, so the third one must be a lie. Trees are often planted alongside sources of noise pollution, but in fact they have very little effect. Even fairly dense plantings have only a minimal effect. And, a very weird situation occurs in the atmosphere that can completely remove even the smallest benefit of vegetation. Consider people living near a busy highway. Arguably the majority of those people would want the noise of the highway to be decreased in the evenings and at night when they are at home, and they might not care too much about how much noise there is during the day when they are away from home at work or school. On clear evenings, when you might want to sit out in your backyard and listen to the crickets chirp, something called an inversion can occur in the atmosphere. Normally, the air temperature decreases with height above the surface, but on clear nights the surface can cool down rapidly and will cool the air next to it as well. This can create a situation where the air temperature increases with height for a while and then falls off normally above that point. The point in the atmosphere where the temperature stops rising and starts to fall off will reflect noise and cause it to be diverted back down toward the surface. This basically allows the noise to skip over any barrier of vegetation, as if it weren't there. So, in this case, the vegetation provides no barrier at all to the noise of the highway. The bottom line is that when considering the noise-distribution aspect of the microclimate in areas near highways, landscape architects cannot count on vegetation to provide much of a sound buffer.
There are many more counterintuitive situations related to microclimate. Using intuition alone, it would seem reasonable to plant trees in urban areas to absorb pollution; in order to have a fairly immediate effect, you might put in fast-growing trees such as poplar or willow—and you would, in fact, cause an increase in pollution levels. Landscape architects can't afford to be amateur microclimatologists, trusting their intuition in matters of microclimate—they will be wrong much of the time. And it isn't just a benign effect. They can actually make the situation worse—much worse. Unfortunately, much of what happens in the physics of the atmosphere and the way that it interacts with the landscape is not what you might expect. I can tell you about some of the situations, but I think it is much more effective if you understand the basic mechanisms by which micro climates work. That way your intuition will be well informed. I suggest that we start with the big picture.
BIG PICTURE
The sun provides virtually all the energy that fuels the atmosphere. However, radiation from the sun passes through a clear sky almost as if it weren't there. Only a very small portion of the radiation is absorbed or reflected by the air before it reaches the ground, and most of the absorbed radiation would be dangerous to humans if it were allowed through (like that absorbed by the ozone layer). Clouds in the sky will intercept and reflect a lot of solar radiation, but the key point here is that the sun does not heat the atmosphere directly. Instead, solar radiation falls on the earth, where some is absorbed by the molecules that make up the landscape. Darker-colored surfaces will absorb more solar radiation than lighter-colored surfaces, which is the main reason that asphalt gets so much hotter on a sunny day than concrete does. Molecules that absorb solar radiation get excited by the input of energy, and their temperature rises. Air molecules are in constant contact with the earth, and some of this energy is transferred to them, making them warmer as well. An individual air molecule at the surface of the earth can move only about one millionth of a centimeter before it collides with another air molecule.1
Needless to say, there are a lot of collisions, and there is a lot of energy being transferred. Air molecules that are warmed through contact with the earth become lighter and rise up through the cooler and heavier air molecules around them. As each warmed particle rises, a cooler particle falls into its place and also gets warmed by the earth, becomes lighter, and rises as well. As molecules move up through a dry atmosphere, they cool at a pretty consistent rate of about 1°C for every one hundred meters of vertical distance (about 0.5°F for every one hundred feet); if the air is moist, the rate is about 0.6°C for every one hundred meters (about 0.3°F for every one hundred feet).
This is an important relationship for landscape architects to keep in mind for several reasons. For example, when a design project is under taken, one valuable piece of background information is the typical air temperature at different times of day and in different seasons. If the data that you acquire is from a weather station that is at a different elevation than your study site, it needs to be adjusted—sometimes quite a lot. For example, the weather station at Cranbrook, British Columbia, is at the airport, whose elevation is 930 meters (3,050 feet), but my summer home in Kimberley, British Columbia, which is less than twenty kilometers (about 12 miles) away, is at an elevation of 1,300 meters (4,270 feet), a difference of 370 meters (1,220 feet). When the air temperature at the weather station is 20°C (68°F), the air temperature at my place would be nearer to 16.3°C (61.3°F)—quite a difference!
In another example, I was involved in the microclimatic design of the rooftop of a tall building in Manhattan (more on that later). The rooftop is about 280 meters (750 feet) above the ground, so climate data from the Central Park weather station had to be adjusted lower by more than 2°C (3.6°F).
Tucked away in the southwest corner of Saskatchewan is an upland area known as the Cypress Hills.2 Driving from the prairie town of Maple Creek to the hills less than twenty-five kilometers (fifteen miles) away, the elevation rises more than six hundred meters (about two thousand feet). And, indeed, the air temperature drops by about 6°C (about 10°F) during the climb. A hot summer day on the prairies becomes a cool springlike day at Cypress.
Another terrific road to drive and experience the relationship between elevation and air temperature is in Tucson, Arizona. One hot spring day when the air temperature in Tucson was about 30°C (86°F), we drove up Mount Lemmon, a rise of about 2,000 meters (6,500 feet), which can be done in about an hour. As you drive, you pass through different climate zones as the air temperature drops. When we reached the top, it was about 10°C (50°F), and there was still snow lying in patches on the shady north sides of hills.
AIR TEMPERATURE
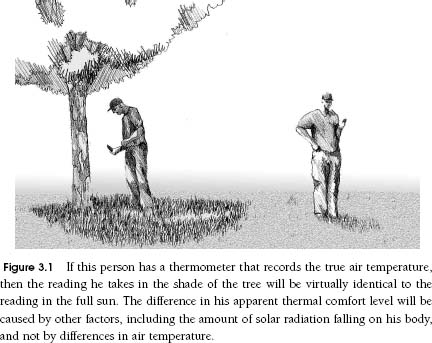
Every year I give many talks about microclimate and how it can be modified through design. I often talk about some of the oddities and counterintuitive aspects of microclimate, and I find that people are generally pretty interested and accepting of my information. However, there is one thing in particular that I tell my audiences that many people find hard to believe. Despite the fact that I provide scientific evidence, most of the comments and questions after my talks focus on the apparently unbelievable information that I am going to share with you now. Here it is. If you move expeditiously through a landscape carrying a thermometer at about chest height, the air temperature readings will be almost identical wherever you go.
At first this might seem obvious, but then you might think about a hot day when you walked from the full sun into the shade and found that it was much cooler. If I were in the audience, I might think of a parking lot on a hot sunny day. All of the parking spots in the shade would be full, so I would have to park in the full sun. I would step out of my car, and it would be hot, very hot. I would walk past the cars parked in the shade, and it would be so much cooler. Surely the air temperature is a lot higher in the sun than in the shade.
Well, there is no question that a person would feel hotter in the sunny part of the parking lot than in the shade. However, what you feel in terms of your thermal comfort is not dependent on the air temperature alone. Other things are also affecting what you sense, and often these other factors have a much more powerful influence on your comfort than does the air temperature.
Air temperature is one of only a small number of things that need to be measured in order to describe a microclimate, and you hear about them all every day. Weather forecasters will report on the air temperature, relative humidity, wind, sun and cloud coverage, and precipitation. These are all very familiar concepts, but they are far from easy things to measure. For example, measuring the temperature of the air is a very tricky business.
When Daniel Fahrenheit started making thermometers in the early 1700s, there was no standard size for a degree and there was no general agreement on where the scale on the instrument should stop and start. He put his early thermometers into the mouths of healthy men and labeled that point as 22.5°F. He then put the thermometers into ice water and labeled that value as 7.5°F. He apparently saw the difficulty in using a scale such as this, so he multiplied all the values by four, which yielded a temperature of 90°F for the core temperature of people, and 30°F as the temperature at which water freezes. He then reasoned that it would be more convenient to have 64 degrees between body temperature and ice water rather than 60°, as 64 is divisible by 2 without leading to fractions. So he set the temperature at which water freezes to the now familiar 32°F, and the temperature of human cores to 96°F. After his death, it became normal to calibrate thermometers using the boiling point of water (which was 212°F on his scale) and the freezing point of water. These were more stable values than the core temperature of people, which can vary somewhat from person to person.
Not long after this, Anders Celsius came up with a much more rational and easy-to-understand scale where water freezes at 0°C and boils at 100°C. Old habits die hard, though, and some parts of the world, including the United States, still use the awkward Fahrenheit scale. Thermometers now come in many types and sizes and give quick and easy readings. However, the challenging part is to tell what it is they are really measuring.
Let's start by considering how a simple mercury-in-glass thermometer works. Mercury changes volume with temperature, expanding as it warms and contracting as it cools, but it remains liquid even in the coldest weather.3 This makes it an ideal material for use in thermometers. When the mercury in the reservoir at the bottom of the thermometer gets warmer, it expands and forces some mercury to move up the tiny tube running up the middle. We can see the height of the mercury in the thermometer and read the number on the scale. Mercury expands and contracts with temperature at a very well-known, consistent rate. However, it is difficult to get exactly the same amount of mercury into every thermometer. It is also difficult to make every glass thermometer exactly the same size, with the same size reservoir and with the same size tube in the middle of the glass. So if we were to line up a dozen thermometers and put them into the same environment, we might get a dozen slightly different readings. If we used good-quality instruments, the readings would be pretty close but they likely wouldn't be identical. So this is problem number one. How do we get all thermometers to read the same value?
Well, if you live in Canada, you could take the instrument to Ottawa and compare it with the national standard, which in turn has been compared with the international standard. I bought a new thermometer a few years ago and sent it to Ottawa for calibration. They put my thermometer and the national standard thermometer into a range of predefined environments and compared the readings. It turned out that my thermometer reads a little high—that is, when my thermometer says 19.8°C (67.64°F), the true temperature is 19.7°C (67.46°F). So every time I take measurements with that thermometer, I have to subtract a tenth of a degree (0.18°F) to get the real temperature.
Once you have a thermometer that you can count on to give accurate and precise values, you can think about using it to measure the air temperature. If you just held it in your hand and walked out into the landscape, you would get a reading. This reading, however, would not actually represent the temperature of the air but would instead be the result of a combination of many different factors. Heat from your hand would be transferred to the mercury, causing it to expand. Radiation from the sun and the surrounding environment would be absorbed by the mercury, also causing it to expand. Wind might cool the thermometer through convection, causing the mercury to contract. Each of these would affect the volume of the mercury, and if you were to just read the level of mercury in the tube, you would be measuring not the temperature of the air but some combination of many factors. Yikes!
Think for a minute about the big thermometers that people often put in their yards—you know, the ones that have a deer jumping over a fence printed in the background. People often hang them in locations where the sun falls on them for at least part of the day, and they gleefully report things like “it was 35°C (95°F) in the sun today.” The reading of a thermometer in the sun will undoubtedly be high, much higher than the weather forecast, but you can see now that the weather forecast was predicting air temperature, while the jumping-deer thermometer would be measuring some combination of air temperature plus solar radiation plus heat from the building plus who knows what else.
Lots of people, including some researchers, make this mistake, and unfortunately there is quite a bit of literature that uses erroneous air temperature measurements. Watch for it when you are reading books and journals. They will draw conclusions that would not be supported by correctly measured data.
So how could you possibly take a true measurement of the temperature of the air? Basically, what you have to do is to make sure that the thermometer is measuring only the temperature of the air and that there is no possibility that the instrument is being affected by any other sources of energy. You can do this by making sure that enough air is passing over the thermometer to allow the thermometer and the air to reach a thermal equilibrium. If the air is a bit warmer than the thermometer, then heat will be transferred from the air molecules to the thermometer. If the air is a bit cooler than the thermometer, then heat will be transferred from the thermometer to the air molecules. When no heat is passing either way, the resulting measurement of the thermometer will be a measure of the air temperature.
The air has to be moving quickly enough that it overwhelms the effects of things that would heat up the instrument, such as solar radiation. There are a variety of ways that this can be done, but in general the thermometer needs to be shielded from the sun and well ventilated. One early proponent of accurate air temperature measurement was Thomas Stevenson, father of the famous author Robert Louis Stevenson. He invented an instrument stand that is now known as the Stevenson Screen. It's a common sight at climate stations and airports—a white box with slatted sides set at about chest height. The white box reflects much of the solar radiation and keeps it from reaching the thermometer, while the slatted sides allow the wind to pass through. Over the years, we've found that this is a good solution but not perfect, as there can still be some radiation error.
A more effective way to measure the air temperature is to put a good-quality thermometer inside a tube that is covered with white paint or aluminum foil, which will reflect a large portion of the solar radiation that falls on it. Put a fan in the other end of the tube and turn it on so that it pulls air through the tube and past the thermometer. Using a system like this allows you to take measurements of air temperature that are accurate to about a tenth of a degree or less.
If you used a system like this, you would find that air temperatures throughout a landscape would be virtually identical at any one given point in time (see figure 3.1). Some researchers recently set up a carefully controlled experiment in a sunny parking lot on a hot day. They measured the air temperature over asphalt that was in full sun and over asphalt that was in the shade of a tree. This is certainly a situation where you would expect to see large differences in temperature because if you were to stand in those two places you would surely feel a big difference in your comfort level. When they measured the ground surfaces, they found that the asphalt in the sun was 20°C (36°F) hotter than that in the shade. However, when they took measurements of the air temperature at 1.5 meters above the surface, the values in the two places were virtually identical. The air temperatures were within half a degree of each other, and even that difference might have been due to radiation error.
Now, I have to admit to you that I was pretty careful in wording my initial statement: If you move expeditiously through a landscape carrying a thermometer at about chest height, the air temperature readings will be almost identical wherever you go. The key words are ‘expeditiously', ‘landscape', and ‘chest height'. Air temperature will change over time, over long distances, and with height. But if we hold those variables constant, then there are generally very small differences in air temperature.
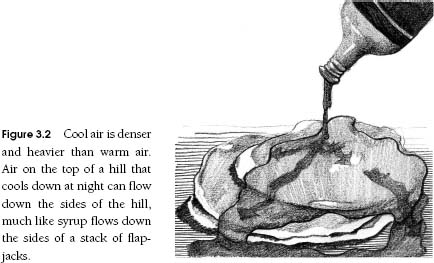
There are a few times and places where the relationship is not completely true, and these situations can be used effectively in microclimate modification. They occur in situations where there is little or no mixing of the air—in areas or times where it is almost completely calm. For example, on clear nights, surfaces exposed to the open sky can cool down and the air next to the surface will cool down as well. If this happens on a hilltop, the cooler air, which is heavier than the warmer air around it, will flow down the hillside just like maple syrup flows down the side of a stack of pancakes (see figure 3.2).
If this heavy, cool air is trapped by a depression at the bottom of the hill, it will pool there and you will have a lens of air that is cooler than the air around it. If this occurs on an evening when the air temperature is near freezing, this lens of cool air can create an area of frost. When this situation arises in an orange grove in the spring, for example, the frost has the potential to freeze the flowers and destroy the year's crop. This problem can be eliminated by creating an artificial wind by using large fans or even by renting a helicopter to fly low overhead and force the air to mix.
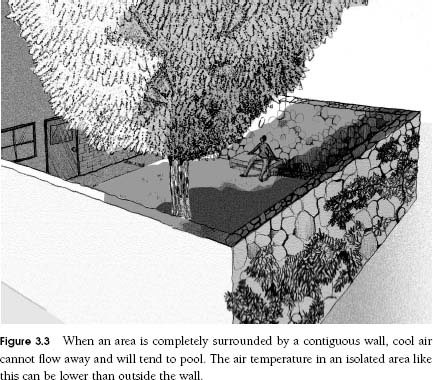
This notion of cool air pooling against an obstruction has potential for application in microclimatic design and is used effectively in many hot climates of the world. Air in a courtyard that is completely surrounded by solid walls can be isolated from the prevailing atmosphere and, if cooled by shade trees or fountains, can create a pool of cool air (see figure 3.3).
A situation known as advection can also occur, in which a green area in or near a city can generate air that is cooler than air in the adjacent hard urban surfaces. Under light wind conditions, this cool air can be pushed horizontally out of the park, acting almost like a natural air cooling system. The effect does not extend far, but, like in the urban heat island situation, lots of green areas can have a cumulative effect and can cool a city in a way similar to how lots of gray areas can warm it.
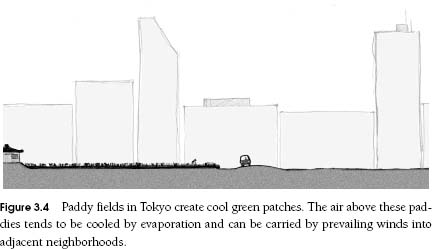
We looked at the advective effect of paddy fields in Tokyo during a particularly hot period one summer. We carefully measured the air temperature at 1.5 meters (4.9 feet) above a large urban paddy field, then measured the air temperature at 1.5 meters above the ground along neighborhood streets radiating off from the paddy field (see figure 3.4). The air temperature over the paddy field was about 2°C (3.6°F) lower than in the middle of the urban neighborhood. When we moved downwind of the paddy, the temperature gradually rose from the paddy field temperature to the urban temperature over a distance of about 150 meters (492 feet). The boundary layer set up in a situation like this grows at a rate of about 1 in 100, so the measurements at a height of 1.5 meters would be affected for the first 150 meters from the paddy field. Streets that ran in directions other than downwind of the paddy field received no cooling effect from the paddy field.
So why is our experience so much different than this? A person standing in the parking lot in the full sun would definitely feel as if it was too hot. The person would be receiving a large amount of solar radiation directly from the sun and would also be receiving a large amount of terrestrial radiation from the hot asphalt. Remember, radiation from the sun passes through a clear atmosphere almost as if it weren't even there. Over short distances, the same holds largely true for terrestrial radiation. So the air does not get heated by the radiation. And the air molecules that come in contact with the hot asphalt surface are quickly mixed in with the large number of air molecules nearby and end up having little local effect. Over time, the air temperature will gradually rise, but because of the efficient mixing of the air, it will rise the same amount almost everywhere in the landscape.
HUMIDITY
Tokyo can be almost unbearably hot and humid in the summer. Even though the air temperature might be only a little over 30°C (86°F), it can feel oppressive. In fact, in some ways it feels hotter to me than the 50°C (122°F) temperatures I've experienced in Death Valley, where the air was very dry. This is central to the ongoing debate about hotness, and the impetus for deriving things like the humidity index, or humidex. What the `humidex tries to do is to combine the effects of air temperature and humidity into a single scale. On a humid day where the actual air temperature is only 25°C (77°F), but the humidex says 35, then it is supposed to feel the same as it would on a day when the air temperature is 35°C (95°F) but the humidity is low.
There is no question that humidity in the air affects the thermal comfort of people, but it turns out that the same mechanism that mixes the air molecules so efficiently that we can't find horizontal temperature differences also mixes the water vapor molecules just as efficiently. If you were to walk expeditiously around a landscape measuring humidity in the air at chest height above the ground, you would not be able to find any substantial differences. We say that air temperature and humidity are horizontally homogeneous within a landscape at a given point in time.
When water molecules change their state from liquid to vapor, the molecules mix with the dry air molecules and the effect is hardly noticeable until there get to be quite a few vapor molecules in the air. The higher the temperature of the air, the more water it can hold in the form of vapor—and it's not a linear relationship. At 30°C (86°F), the air can hold more than three times as much water vapor as it can at 10°C (50°F). However, the main reason it feels so oppressively hot at times of high humidity is that the opportunity for evaporative cooling from your body and from surfaces is limited. In hot, dry air, perspiration can evaporate freely, carrying heat away from your body with it, but in hot, humid air there is no room for more water vapor in the air, so perspiration isn't able to evaporate.
On that hot, humid day in Tokyo, I ordered a small flask of cold sake to accompany my nigiri zushi lunch. In a short time, the flask was completely beaded with wet droplets on the outside. Humidity from the air was condensing on the cool flask. The air immediately next to the flask would have a slightly lower humidity than in the prevailing air. Knowing that people sometimes find air with lower humidity to be more comfortable, the process of condensing water out of the air provides an opportunity in microclimatic design.
As in the situation with lowering air temperature, the key is to isolate an area completely from the prevailing atmosphere so that the air doesn't have an opportunity to mix and dissipate the lower-humidity air. A walled garden with some cool surfaces onto which water from the air could condense would lower the humidity in the air. However, condensing water out of the air releases heat to the surface over time, and the surfaces would gradually lose their potential to condense more water from the air. The other issue is a bit more complex and has to do with the molecular weight of water vapor and dry air.
Water vapor molecules are lighter than dry air molecules, so that when a vapor molecule is displaced by a dry air molecule, such as when water is condensed out of the air, the resulting drier air is actually heavier than it was when it was moister. This means that if we are successful in removing humidity from the air, the resulting air will act much as the cooler air did in previous cases and will sink to the ground and stay there unless disturbed. We can ensure that it is not disturbed by having a solid barrier all around it, which keeps out the wind and doesn't allow it to flow out at the base.
Depending on the situation, there are two opportunities to modify air humidity through design. When the air is hot and dry, you can cool the air by adding water and allowing it to evaporate. When the air is hot and humid. you can condense water out of the air, making it drier and more comfortable for people. But in both cases, you have to do this in an isolated environment or the effect will quickly dissipate.
Despite the fact that air temperature and humidity are horizontally homogenous in a landscape, they can both vary greatly with height and time and over large horizontal distances. In the parking lot example, the air temperature immediately next to the sun-drenched asphalt surface would be very high—almost as high as the temperature of the asphalt itself. By the time you reach 1.5 meters (4.9 feet) above the asphalt, the air temperature had fallen 20°C (36°F) to be almost identical to the prevailing air temperature. The graph of this temperature profile looks a lot like the path that a jet would follow if it took off from a runway and then rose as quickly and steeply as possible. The temperature falls off very quickly at first (the path of the jet along the runway and at takeoff) and then changes very little with height as you get farther from the surface (when the jet is going almost straight up). The profile for humidity is similar. Very near a wet surface, the humidity in the air can be very high, but it falls off precipitously a short distance away.
There is also a variation in air temperature and humidity with time. Generally, the coolest time of the day is just before sunrise as the earth and the air have had all night to cool down without the input of solar radiation. Then the earth heats up as it absorbs solar radiation, reaching a maximum near midday, but the air temperature, because it is heated from below through contact with the earth, reaches its maximum a little later in the day. The maximum air temperature normally occurs in the early to mid-afternoon.
And, of course, there are tremendous variations in air temperature and humidity on a global scale. Temperatures as low as–89.2°C (–128.6°F) have been recorded in Antarctica, and temperatures as high as 57.8°C (136°F) have been documented in Libya. Humidity at various places on earth at any time ranges from near 0 percent to 100 percent.
The amount of humidity in the air can be measured in a number of different ways, some of which are more accurate and precise than others. Many of the measurements are based on the concept of a wet sock. You might have had the experience as a kid of getting a soaker—when you stepped into a puddle that was deeper than you expected or your foot slid off the shore and into the edge of a river or lake. Your sock and shoe got soaked. If this has happened to you, you likely will also have experienced the chill that often accompanies a soaker. The water might have been cold, but even if it wasn't, over time your foot would likely have gotten cooler and cooler. As the water in your sock evaporated, it would have taken heat from your foot.
Now consider taking a regular mercury-in-glass thermometer and putting a wet sock onto the bulb. As the water evaporates from the sock, it will take heat from the thermometer, resulting in a reading that is lower than air temperature. It is this difference between the wet-bulb and the dry-bulb temperatures that yields a measure of the humidity in the air. When the air has a high amount of humidity in it, little water will be able to evaporate from the sock and the temperature difference will be small. But when the air is very dry, a lot of water will evaporate from the sock, taking a lot of heat from the wet-bulb thermometer and creating a big difference in the temperature of the two thermometers. In order for this system to work well, both the wet-bulb and the dry-bulb thermometers need to be shielded from radiation and to have a wind pass over them. This can be accomplished by using a fan, or the instruments can be spun around in the air. The dorkiest but still effective microclimate instrument ever invented is the sling psychrometer. You have to spin the instrument in a horizontal circle over your head or in front of you for at least a minute or two and then quickly take the readings from the two thermometers. Then you can use a simple graph to determine the humidity level in the air.
We should discuss one more point about humidity here. Weather forecasts tend to report on something called relative humidity. This is a ratio of the amount of humidity in the air relative to the maximum amount that the air will hold. But there's a catch. The maximum amount of water vapor that the air can hold changes with temperature, and it isn't a linear relationship. So if you hear that the relative humidity has fallen, you don't know whether it is because there is less humidity in the air or because the temperature of the air has risen and the maximum amount of moisture that the air can hold has also risen.
This can lead to some very confusing situations. I was watching an Olympic marathon on television once, and the announcers were discussing how hot and humid it was for the runners. They reported that at eight o'clock in the morning the air temperature was already 30°C (86°F) and the humidity was 84 percent. They continued to comment on the weather and the fact that the air temperature continued to rise through the race, but they were surprised to see that the relative humidity went down over time. They said something like, “The conditions have improved a bit for the runners. Despite the air temperature rising to 33°C (91.4°F), the relative humidity has actually fallen off a bit to only 78 percent.” Well, certainly the conditions for the runners were not better as the day wore on. There was essentially the same amount of water vapor in the air, probably a bit more actually as water evaporated from the vegetation along the marathon route. But because they were reporting relative humidity, as the air temperature rose the relative humidity value went down. Everyone, including sports announcers, would be better off if we talked about absolute humidity in the air.
SOLAR RADIATION
The earth is almost twelve thousand kilometers (7,450 miles) in diameter, yet most of our atmosphere—about 80 percent—is within fifteen kilometers (9 miles) of the surface. Now, a fifteen-kilometer-thick layer might seem like a lot of air when you are looking up at it from your position down here at the bottom, but if you were to scale the earth down to something the size of, say, a basketball, the atmosphere would be less than one millimeter thick. If you included virtually all of the atmosphere, it would still only be a layer two millimeters thick. You would be hard pressed to spread peanut butter in a layer that thin on a basketball.
So, earth is basically a ball floating in space with a very thin layer of atmosphere attached to it. As we all memorized at one time or another in our lives, the earth revolves around the sun at an average distance of about 150 mil lion kilometers (93 million miles). But the important fact that you might not have learned, or may have long forgotten, is that as the earth revolves around the sun it is tilted. Now, it's a bit difficult to try to imagine how something floating in space is tilted. After all, there is no up or down in space. But relative to the sun, the earth is tilted at about 23 degrees. It's actually closer to 23.4 degrees, but when trying to remember what the value is, I like to think of it as being about half of 45 degrees, which is half of 90 degrees, which is half of 180 degrees, which is half of 360 degrees, a full circle. In any event, this tilt is pretty important for a whole variety of reasons, but the most important for this discussion is that it means that for half the year we are tilted toward the sun and for the other half we are tilted away.
Wherever you live on earth, the time that your home is tilted toward the sun will be summer and the time when you are tilted away will be winter. Try this. Make a fist with your right hand, and point your thumb straight up. Now rotate your wrist until your thumb is pointing toward the left wall. Then move your thumb until it is halfway between pointing at the wall and at the ceiling—this will be about half of 90 degrees, or 45 degrees. Then go halfway from that point to the ceiling, and your fist will be tilted at about 22.5 degrees, about the same tilt as the earth. Now move your hand to a position to the immediate right of this book (which you are now balancing precariously on your knees), and imagine that the book is the sun. You will see that the knuckle of your pointer finger will now be facing toward the sun and would be experiencing summertime sunshine. The knuckle of your pinky finger, in the meantime, would be tilted away from the sun and would be in midwinter.
Now, keeping your thumb pointed at the same angle, tilted 22.5 degrees from vertical, move your hand to the left of the book. Now the knuckle of your pointer finger will be pointed away from the sun and it would be wintertime. Your pinky is now tilted toward the sun and it would be summer there.
Of course, there is much more to it than this. To simulate the movement of the earth over time, you would have to be able to spin your fist around your thumb and move your fist in circles around the book. But in general, it gives a reasonable representation of the relative positions of the earth and the sun.
So now that you have had to contort yourself, what is the point? Well, it all comes down to intensity of radiation—that is, the amount of solar radiation per unit area. The same amount of radiation can be spread over a large area when the sun is lower in the sky (low intensity) and over a much smaller area when the sun is higher in the sky (high intensity). If you could see the radiation being emitted by your book (remember, it will be emitting terrestrial radiation, which is invisible to the human eye), the part of your hand tilted toward the book would be receiving a higher intensity of radiation than the part tilted away.
This concept is probably still a bit fuzzy. No worries. Let's try something else that might make it clearer. Take three identical, black, rectilinear objects, something like black notebooks. On a sunny day, set one in the sun so that the largest face of it (the front of the book) is perpendicular to the sun—that is, the sun is falling directly onto it and it has the highest intensity of solar radiation possible. Orient a second one so that the sun's rays are parallel to the largest face so that almost no direct solar radiation is falling on the object and the intensity of solar radiation is very low. Put the third in an intermediate position, at an angle halfway between the first two. Make sure that there is little or no wind passing over the books, and then, after a few minutes in the sun, put your hand on each of the three objects in turn and check their temperatures. The object perpendicular to the sun, which is receiving the highest intensity of radiation, will be the warmest object, and the one parallel to the sun's rays will be the coolest.
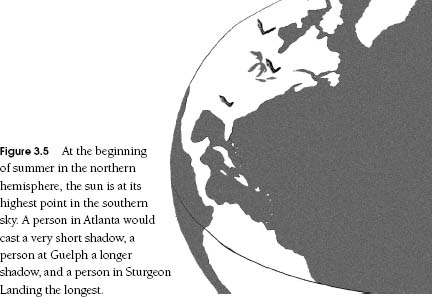
You can check out the intensity of radiation on a global scale if you ever travel a considerable distance to the north or south within a short time period. I had an opportunity one June to travel to three locations separated by about 10 degrees of latitude within a week—Atlanta, Georgia, at about 34 degrees N; Guelph, Ontario, at about 44 degrees N; and Sturgeon Landing, Saskatchewan, at about 54 degrees N (see figure 3.5).
In Atlanta, the sun was so high at noon that I hardly cast a shadow. The intensity of radiation on horizontal surfaces was about as high as it could possibly be. In Guelph, my shadow at noon was longer than in Atlanta and the intensity of the radiation on horizontal surfaces was lower (that is, the radiation had to be spread over a larger area). Finally, in Sturgeon Landing. my shadow was quite long and the intensity of radiation on horizontal surfaces was quite a bit lower than in Guelph.
Here's another experiment that you can do at home. It isn't difficult, but it takes a bit of time and dedication. Put five stakes in the ground in the pattern of an X—one stake where the two arms cross, and one at the end of each arm, with each arm of the cross pointing to a main compass direction (north, east, south, and west). Then, over the period of a year, observe where the sun rises and sets relative to the four directions and notice how long the shadows of the stakes are at different times of the year. You'll find that the sun rises due east and sets due west only on the equinoxes in March and September, and that in the winter the sun rises in the southeast and sets in the southwest (your latitude will determine how far toward the south). In summer, it will rise in the northeast and set in the northwest. You will see that the shadows of the stakes are longest in winter and shortest in summer.
This is invaluable information for use in microclimatic design. It illustrates how the position and movement of the sun changes through the seasons. The position and movement also changes as a function of your position on the planet. During my trip to Atlanta, I observed that the sun came up in the east-northeast, was very high in the sky at noon, and set in the west-northwest. In Guelph, the sun came up in the northeast, was quite high in the sky at noon, and set in the northwest. And in Sturgeon Landing, the sun rose in the north-northeast, was not very high in the sky at noon, and set in the north-north west. Even the middle of the night wasn't very dark, as the sun seemed to be passing just below the horizon.
So, there were big differences in the three places. The most surprising thing for most people is to discover that the sun doesn't always rise in the east and set in the west. The most that could be said is that the sun rises in the eastern sky and sets in the western sky, but certainly it is seldom due east and due west.
Here's one more experiment to try on a sunny day. Take three of your tee shirts, one that's black, one that's white, and one of an intermediate color. Lay them out side by side on a dry surface, such as a board or a picnic table, in the full sun and away from any wind. Angle them so that the intensity of the solar radiation falling on them is high, and wait a few minutes. Then put your hand on each one in turn and test its temperature. The black one will be the hottest because most of the solar radiation falling on this shirt will be absorbed into the material. The white shirt will be the coolest since most of the solar radiation falling on it is reflected away. The intermediate shirt will have an intermediate temperature. This will undoubtedly give you some good ideas of what to wear on hot sunny days, but it should also make you consider that the color of materials that you put in a landscape will have a major impact on their temperature and, as a consequence, on the microclimate around them.
These simple experiments demonstrate three of the most powerful and useful microclimate modification principles. By understanding how the sun moves through the sky during different times of the year and then simply changing the color of a material or its orientation relative to the sun, you can substantially affect surface temperatures and, consequently, the microclimate.
Let's consider what is happening. All of the solar radiation arriving at a surface must go somewhere, since energy can be neither created nor destroyed. The amount of radiation per unit area, the intensity of the radiation, is a function of the orientation of an object relative to the sun. As we saw in our experiment, the more nearly perpendicular the object is to the sun, the higher the intensity of radiation received.
The radiation that is received at the surface must be either reflected or absorbed. The amount that is absorbed by an object is a function of its color. Darker colors absorb more solar radiation than lighter colors. The ability of an object to reflect solar radiation is known as its albedo. In our experiment, the white tee shirt had a high albedo, while the black one had a low albedo.
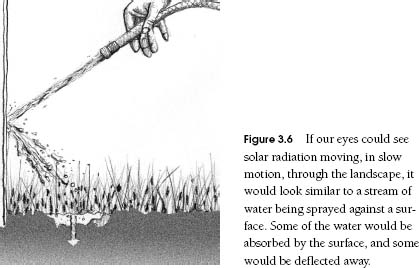
If we could see, in slow motion, solar radiation moving through the landscape, it would be a bit like a jet of water in a world of sponges of various densities (see figure 3.6). When a jet of water hits a very porous sponge (like solar radiation striking a dark surface), most of the water is absorbed into the sponge and little is deflected away. If that same jet, however, were to hit a solid, impermeable, smooth-surfaced sponge (like solar radiation striking a light-colored surface), very little of the water will be absorbed and most will be deflected onto other surfaces. It will bounce around from surface to surface until it is absorbed or deflected out of the space (in this analogy, you have to imagine that the water doesn't slow down when it hits surfaces).
Here's another oddity about the sun that you might not have noticed. The sun moves faster through the sky in summer than it does in winter. Now, there are some who will tell you that the sun doesn't actually move but that, rather, it is the earth moving around the sun that makes it appear that the sun is moving. They are not wrong. However, because of relativity, it is also not wrong to say that the sun moves through the sky. In fact, no one can prove you wrong (and some pretty great minds have tried) if you were to say that everything in the universe revolves around you!
Back to the speed of the sun moving through the sky. If you timed how long it took the sun to move from southeast to south in June in New York, you would find that it takes about one hour. In January at the same location the sun takes about three hours to move the same number of degrees. This has important implications in terms of capturing sun in winter and repelling it in summer.
Now, how do we measure the amount of solar radiation in different parts of the landscape? Many different instruments have been designed to measure this visible and invisible energy, but only a few are of any particular value in microclimatic landscape design. Let me start by telling you some of the instruments that you should not use—ever.
First of all, you shouldn't ever use a light meter to measure solar radiation. Remember that only about half of the radiation from the sun can be seen, while the other half is invisible to human eyes. We still feel the heat of the invisible portion in the same way as we feel the visible portion, so it has to be considered in any energy budget—but light meters don't sense it so will give faulty readings. There's another twist to the story too. Trees have adapted to use only part of the visible portion of the solar spectrum to grow. Their leaves allow much of the invisible portion, known as solar infrared radiation, to pass through. So, when you sit under a tree it might look quite shady to your eyes, but in fact there can be a fairly large amount of solar infrared radiation from the sun washing over your body. If, instead, you sat in the shade of a solid structure such as a building, there would be far less solar infrared radiation washing over you because it would be intercepted by the building. Even though the shade of a tree and the shade of a building might look quite similar to your eye, there is a lot more solar radiation passing through the tree while none is passing through a solid building. A person under a tree would have a higher input of energy than someone in the shade of a building. So, your eyes can play tricks on you. What you see is not necessarily what you get.
So far we have been talking about solar radiation that comes directly from the sun and arrives at a surface, but not all of it makes it through the atmosphere unchanged. The sizes of air molecules are exactly the right size to deflect the blue wavelengths. When you look up and see a blue sky, what you are looking at are the blue wavelengths of solar radiation that are being scattered about in the atmosphere like pool balls on a crowded billiard table. Besides adding a colorful dimension to our landscapes (the “sky” on the moon, for example, has no color), it also adds radiation to shaded areas. You might have thought that the shade of a building would have absolutely no solar radiation in it, since the building is solid. However, the solar radiation deflected by air molecules, often called sky radiation or diffuse radiation, adds energy to the landscape the same as any other radiation. On a clear day, the amount of solar radiation in the shade of a solid structure will be about 10 percent of what it is in the open, and on cloudy days there can be nearly as much solar radiation in the shade of a building as there is in the open.
We've already discussed how some of the solar infrared radiation passes through leaves of trees. Add to that some diffuse radiation scattered from the sky, and it is starting to look like trees don't provide nearly as much shade as you might think.
So, how should solar radiation be measured? The most effective way is through the use of an instrument called a pyranometer. In full sun on a clear day, the reading from an instrument like this would be around 1000 watts per square meter (W/m2). Hourly readings with instruments like this are often taken at a few key locations, such as airports in major cities. The instrument is set on a horizontal surface in the middle of a flat grassed area that has been mown quite short—to make sure that the landscape is not affecting the reading in any way.
TERRESTRIAL RADIATION
A few years ago, I was teaching an urban design course in London, England, and had decided to take a weekend trip to Dublin, Ireland, to visit a former graduate student who was practicing landscape architecture there. The train ride had been fine, but the ferry had not been very warm and the wind off the sea had penetrated my thin jacket and chilled me to the core. Once on land, we transferred off the ferry and walked to the train, and—although we were still outdoors—I suddenly felt quite warm. I became aware that there were some radiation heaters along the walkway (similar to the catalytic heater that we used to survive the cold of the football game). As at the football game, this heater was not heating the air but simply bathing us in an invisible stream of terrestrial radiation.
Every space in the landscape and every part of a microclimate are full of terrestrial radiation, and it is impossible to see any of it with the human eye. There are instruments that will see and measure this radiation, but fortunately there is also a very simple relationship between the temperature of an object and the amount of radiation that it emits. You might not think it is fortunate when I first tell you what the formula is, but since the advent of calculators and computers, the equation has gone from a lion to a pussycat. Here is what it says: take the temperature of the object in Celsius (T), add 273 to convert it to Kelvins (K), take the result to the power four, and then multiply the answer by 5.67 X 10⁻⁸ (which basically means 0.0000000567; a constant known as sigma [σ]), and the answer will be the amount of terrestrial radiation (R) emitted by the object. Here is how it looks written out:
R = σ × K4
Simply plug that formula into your computer or calculator, and then if you ever want to know how much energy is being emitted by an object, put in the temperature and out will pop the answer. We know from our earlier discussion that when I was slothing on the couch I was gen erating about 60 W/m2 of internal energy. How much energy do you think that I was emitting? Let's assume that my skin was at about 33°C (91.4°F) and the formula would say that we add 273 to 33 to get 306 Kelvins. Take this to the fourth power and multiply it by σ and we get 497 W/m2. Yikes! Where is all that energy coming from? Am I really emitting that much radiation?
For comparison, let's check how much energy I would be getting from the walls and objects in the room. They are probably at about 20°C (68°F), so using our formula we would calculate that I would be receiving 415 W/m2. So the difference, or net terrestrial radiation, is about 497 - 415 = 82 W/m2. My body is emitting 82 W/m2 more than it is receiving. That sounds more reasonable. And this might make me feel a bit cool if I didn't have many clothes on, but if I had on a shirt and pants, then the surface of my clothing would likely be much lower than 33°C (91.4°F), probably more like 25°C (77°F). If this were the case, then we could again use our formula to see that I would be emitting 447 W/m2. My terrestrial radiation balance would be 447 going out and 415 coming in, for a net terrestrial radiation budget of 32 W/m2 away from my body—an amount that would be hardly noticeable.
So the real key is not the absolute amount of terrestrial radiation you are receiving from an object but, rather, the amount relative to the amount that you are emitting. If the balance is greatly in your favor—that is, if you are receiving a lot more than you are emitting—then over time it will make you feel warmer. If the balance is the other way, you will have a net loss of terrestrial radiation and will feel cooler. The trick in designing human environments is to be strategic with the use of terrestrial radiation, as it doesn't normally have the same level of impact as solar radiation or wind on your thermal comfort. But there are certainly situations where it can strongly influence a person's thermal comfort level.
You might have had an opportunity to sit by an open fire when camping. That fire would have been a major source of terrestrial radiation. The air that was heated by the fire rose quickly and mixed with the cooler air above, but the terrestrial radiation would have been a major source of energy that warmed you. If it was a cool evening, you might have experienced the condition of the front of your body being too warm due to terrestrial radiation load from the fire while the back of your body was too cool due to the small amount of terrestrial radiation being emitted by the cold landscape.
My apartment in Tokyo was on a street that was a favorite weekend playground for wealthy young Japanese, and the local businesses seemed to cater to their every desire. One of their desires apparently was to “see and be seen.” Even on winter days (which are generally quite cool but not cold in Tokyo), people wanted to sit long into the evening in outdoor cafés along the street. The businesses with radiant heaters generously spaced among the tables were the most popular by far. People gravitated to the heaters even though they couldn't see the stream of terrestrial radiation that was bathing them. Microclimate modification undoubtedly had a very positive economic consequence for the proprietors.
If you want to “see” terrestrial radiation, there are some instruments that will assist you. There are devices with special filters that allow only terrestrial radiation to enter the instrument. The sensor then provides a reading of the amount of terrestrial radiation being received, or it can quickly calculate the temperature of the object that emitted that radiation. I often use a radiation thermometer in my classes to help students visualize terrestrial radiation. This is an instrument that every landscape architect should have when doing a site visit—to allow the person to “see” the hot and cold places in the landscape.
We usually start by pointing it at the walls and see that they are the same temperature as the air in the room—about 20°C (68°F). This translates into about 418 W/m2 that is being emitted by the walls. We then check the temperature of a person's clothing and usually find that it is somewhere around 22°C (71.6°F), which means that they are emitting about 429 W/m2. This translates into a net radiation budget of about 11 W/m2, a very small exchange of energy. After checking temperatures of everything interesting in the classroom and finding only very small differences, we head outside. Suddenly, the invisible streams of radiation in the landscape are made visible through the radiation thermometer. On a typical fall day, when the air temperature is about 15°C (59°F), the range of terrestrial radiation emitted by different surfaces in the landscape can be quite spectacular. Asphalt surfaces, because the black surface is absorbing a lot of the solar radiation it receives, can be emitting more than 500 W/m2, while concrete walls in the shade can be emitting less than 350. The net terrestrial radiation for the person whose clothing was at 22°C (71.6°F) would be about +70 W/m2 if near the asphalt surface and–80 W/m2 if near the concrete. These differences are not huge when compared with the amount of solar radiation that can be received, but they can tip the balance in favor of being thermally comfortable rather than too warm or too cool.
Once the students are starting to feel comfortable with the idea of streams of radiation that relate to the temperatures of objects, someone inevitably points the radiation thermometer at the sky—and causes quite a commotion.
Now, normally, the field study components of my courses are held no matter what the conditions of the day. The topic of microclimate is the one exception. While soils don't change much from day to day or as a result of the weather, the microclimate does. If you go looking for microclimates on cloudy, calm days, you will find that the differences are minimized. But differences in microclimates are maximized on sunny, windy days. So when a student points the radiation thermometer at the sky, it is always a clear sky in the middle of the day. And the amount of radiation being emitted from the sky is only a little over 200 W/m2, suggesting that the temperature of the sky is about–20°C (–4°F)! The students are emitting over 400 W/m2 and receiving only 200 W/m2 from the sky, resulting in a large net loss of terrestrial radiation to the sky.
Think about the implications of this deficit in terms of the landscape. During the day, the effect tends to be minimal compared to the large input of solar radiation, but shut off the solar input at sunset and all of a sudden this terrestrial radiation deficit can become pretty important. Consider a warm spring day when the apple trees on the hillsides are in full bloom. The sunny day becomes a clear evening, and the stars burst out of the sky. Invisible to our eye, the hilltop above the apple trees is emitting lots of terrestrial radiation upward but is receiving much less back from the sky. At first the effect is minimal, but over time the ground cools down, eventually becoming very cool. The air that touches the ground gets cooled as well, and with it being a calm evening there is no wind to mix the cool air. A bubble of cool air forms on top of the hill and begins to slide down the hill like syrup flowing off pancakes. In the middle of the slope, the apple trees are fine because as the cool air passes it draws some warm air from above in its wake, but at the bottom of the slope it's a different story. If the air has nowhere to go when it reaches the bottom—say, if there is a depression with no outlet or if there is a windbreak blocking the air from flowing farther—the cool air will accumulate. And if it gets cold enough, the blossoms on the apple trees at the bottom of the slope will freeze.
Why doesn't this happen every evening? First of all, if there are clouds in the sky, they emit terrestrial radiation at a much higher level than a clear sky does, so the ground and the clouds can reach an equilibrium and very little cooling of the ground will take place. This is the main reason it is often relatively warm on mornings after a cloudy night. Second, if there are trees on the hilltop, it will be the tops of the trees that will exchange terrestrial radiation with the sky and that can become quite frosty on clear evenings. The terrestrial radiation emitted by the ground will be received by the tree canopy, and the tree canopy will emit terrestrial radiation to the ground, resulting in an equilibrium; consequently, the ground under the tree will not cool down as much as ground open to the sky. This relationship explains something that you often see after the first few frosts in the fall—white frost on the grass but green frostless grass under trees.
These principles can be applied very easily to the design of outdoor environments. On cool evenings, people will find it to be more thermally comfortable under the canopy of a tree, or under an umbrella or a trellis, than out in the open. If the air is cool, then people will also appreciate warm surfaces under and beside them that will bathe them in terrestrial radiation. They won't be able to see it, nor will most of them understand why it is more comfortable, but they will appreciate it nonetheless.
To give a sense of the importance of terrestrial radiation in human thermal comfort, the other day my colleague phoned me from down the hall and said, “I was comfortable in my office yesterday, but today I'm feeling quite chilly. I haven't adjusted my thermostat, so what's going on Dr. Thermal Comfort?” (a nickname I don't really relish). I said, “Don't move…. I'll be right there.” I grabbed my radiation thermometer and when I got to his office I saw that he was sitting at his desk facing a large window. I measured the amount of terrestrial radiation being emitted by the window (it was 13°C [55°F] so was emitting approximately 379 W/m2), and the amount being emitted by his face (32°C [90°F], so 491W/m2), which indicated a deficit of more than 100 W/m2. As he sat facing the window, he was emitting more terrestrial radiation than he was receiving, and over time it was making him chilly. The previous day had been much warmer outside, and the temperature of his window would also have been warmer—resulting in less of a radiation imbalance.
WIND
The tilt of the earth relative to the sun means that areas near the equator receive the highest intensity of solar radiation while areas near the two poles receive the lowest. This sets up a simple but very grand scale system in the atmosphere in which the air near the equator is relatively warm while the air near the poles is relatively cool. These two regions of air mix about as well as oil and water, and the interface between the two air masses has become known as a front. The term front was introduced by Jacob Bjerknes, a Norwegian who had the idea that masses of air of different temperatures bumped up against each other like a couple of World War I armies. The analogy is not a bad one and is the concept at the theoretical heart of meteorology today. It is like a long, ongoing war where neither side really makes much progress, and if they do move forward for a while, they end up losing ground later.
If, at the very coarse scale, you were to draw a picture of the earth and the atmosphere, the cool air would sit like a toque on the top and bottom of the globe. The rest of the atmosphere would be the warm air. These toques expand and shrink with the seasons, with the toque on the north getting larger during winter and smaller during summer. Think of it as pulling your toque down over your ears in winter but letting it sit on top of your head like a Rasta in summer. The location of the global front between the cold and warm air masses is controlled by the size of the toque. In winter the front moves toward the equator, while in summer it recedes toward the pole.
Unfortunately, we now have to complicate this picture slightly by taking into consideration that the earth is spinning around underneath the atmosphere. And it's not exactly a slow and lazy spin. At the equator, the earth is spinning at more than 1,600 kilometers (994 miles) per hour, and even around London, in the middle latitudes where the fronts hang around, the speed is still close to 1,000 kilometers (621 miles) per hour. The atmosphere is in contact with, but not attached to, the earth, so the movement of the earth drags the bottom of the atmosphere along, making the whole atmosphere rotate slowly in the same direction as the earth—that is, from west to east. So, with the atmosphere being dragged from below by the earth, the result is that in general winds blow from the westerly directions in the middle latitudes. This sets the whole system in motion and sets up a wave along the front between the warm and cool air. These waves are responsible for the weather systems that we know as cold and warm fronts.
Along with these systems are areas known as low-pressure systems and high-pressure systems. The air responds to these pressure differences by flowing from the areas of higher pressure to those of lower pressure, but because of the spin of the earth, the air can't move in a straight line but, rather, arcs out from areas of high pressure and arcs into areas of low pressure. It's one of the weird consequences of living with Cartesian coordinates (straight lines, flat surfaces, and so forth) in a rotating spherical world. Most of the things we do and the things we measure are much more easily done in Cartesian coordinates so, rather than changing our whole system of coordinates and calculations, in 1835 a fellow named Gaspard-Gustave de Coriolis had a brilliant idea: he suggested that we add an imaginary force to our calculations about air movement in the atmosphere to take into account the movement of the earth. The coriolis force was born and started to be used in meteorology in the early 1900s, and it is still in use today.
The consequence for those of us stuck to the surface of the earth and spinning with it is that we experience a lot of winds that flow from west to east, and since we have a convention of naming winds from whence they blow, it is common to have a prevailing westerly wind in midlatitude regions of the world. The wind won't be westerly all the time because every time a frontal system passes, the wind will blow from each direction of the compass for at least a few minutes or hours and then will typically settle back into a westerly flow.
As I was growing up on the Canadian prairies, wind was my constant, usually unwelcome, companion: hot dry winds in summer, cold penetrating winds in winter. The wind always seemed to be blowing from out of the west. When I was on adventures with my buddies, we were always on the lookout for places in the landscape where we could escape from the wind. One place where we found them was in the coulees, a local term for small valleys. We could get out of the wind and drop out of sight at the same time.
We knew that the windiest place was on the windward crest of the hill. Here we could lean far into the wind and not fall over. The wind was the calmest on the lee side of the hill near the base, and we found that vege tation slowed it even more. Even on the windiest of days, we could find a spot that was sheltered from the wind where we could light a campfire and relax. I learned that landforms can direct and deflect the wind, as do trees and shrubs. In an environment where the winds were so constantly and predictably from the west, we could rely on the east side of a chokecherry grove on the eastern base of a hill to be calm most of the time. Other characteristics of the wind were less predictable and understandable.
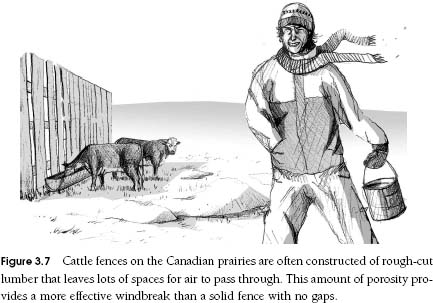
One of my first jobs was as a hired hand for a fellow named Bernie. His ranch in the Great Sandhills of Saskatchewan provided me a lot of opportunities to experience the wind. It was virtually treeless, and the wind carried away anything that wasn't tied down. Bernie had built some rough looking fences, with lots of missing boards, right beside the place where he put out winter feed for his cattle.
The fences were oriented in a north-south direction so as to provide a windbreak from the prevailing westerly winds. One day I asked Bernie why he didn't replace the missing boards (see figure 3.7). He explained that the fence made a better windbreak the way it was. A solid fence would create a lot of turbulence and only a very small area right next to it where the wind would be very slow. Not many cattle could fit into that small space. The staggered-board fence created a much larger area of reduced wind that allowed a lot of cattle to benefit from it. It's the same situation with the snow fences along the roads. They are also about 50 percent porous, which seems to be the most efficient for catching drifting snow before it reaches the roads.
The porosity of a windbreak is a very important determinant of its effectiveness. Many studies have demonstrated that the optimum porosity is somewhere near 50 percent, just as Bernie had learned through trial and error. If a windbreak is too dense, it will create only a small area of low wind speed, while a barrier that is too porous creates a large area with barely discernible wind reduction. The way to achieve this desired porosity ranges from wooden fences to various species of plants. The Eastern white cedar has a nearly ideal porosity when grown on sixty-centimeter (twenty-four-inch) centers.
Windbreaks are most effective when oriented perpendicular to the wind, but with the wind constantly changing directions, it is impossible to have an ideal windbreak without completely surrounding an area. Which leads us to the last big question in microclimatology: how to describe the way the wind moves in and around elements in the landscape. Solve this one, and I'll nominate you for a Nobel Prize in classical physics. We simply don't have equations or computer models powerful enough to accurately and precisely predict wind flow in complex environments, although some commercially available software is getting close through the use of numerical simulations.
In the meantime, we have to rely on physical simulations and general patterns. Simulations are done by building scale models of the landscape and inserting them into a wind tunnel. You then turn on the fan, forcing air to flow over your model, and you measure the relative speeds of the wind in various locations in your model landscape. You can then insert scale models of windbreaks or buildings and see what effect they have under various wind conditions. It is a bit time-consuming and expensive, but it is currently the best way to predict the way your landscape will interact with the wind. The advantage of using a wind tunnel is that, if you get it wrong the first time, it is fairly easy to change the model and test again, whereas if you have already built the landscape it can be very expensive to change.
There are ways to increase the wind speed somewhat, but not nearly as dramatically as wind speeds can be reduced. Winds can be slowed to nearly a standstill, but only naturally increased by maybe 20 percent or so.
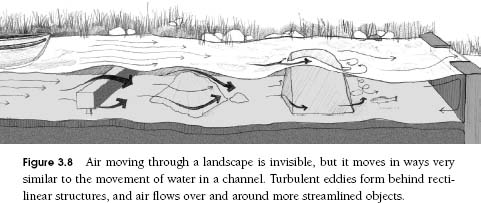
Using a wind tunnel can sometimes be impractical or too costly, and in those situations you can often rely on patterns that have been observed and recorded. For example, it is well understood that wind speed increases with distance above the ground, and decreases when it travels over rough surfaces. Wind will flow only if it has somewhere to go. If there is an opening on the windward side of a house, little air will flow in unless there is also an opening somewhere else that allows it to flow out. Wind approaching a hill will be forced to compress slightly and speed up, and then on the lee side of the hill the air will decompress and slow down. As wind approaches a windbreak or structure in the landscape, it will flow over and around it, but if the structure is not very permeable there will be a low-pressure area set up on the lee side. This low pressure will draw air in, creating a turbulent environment. If the structure is somewhat permeable, then a small amount of air will be able to pass through and break up the low-pressure area. Wind will not be drawn in, and turbulence will be reduced. Smooth, streamlined objects will tend to allow the wind to pass easily over and around them, while rectilinear objects will create turbulence and complex wind patterns. Tall buildings can intercept fast-moving air high above the surface and can force it down toward the ground. This can create very high speed and turbulent winds in urban areas. Because the wind is essentially invisible to us, unless it is carrying snowflakes or dust, it can be valuable to visualize it as being analogous to the movement of another fluid: water in a stream (see figure 3.8).
The speed of the wind and the temperature difference between a person and the air are the two most important determinants of the amount of convection (usually cooling) that will take place. When there is a large difference in temperature, such as a person's skin exposed to winter winds, the amount of heat carried away by convection is high, while in summer, when the air temperature can be very nearly the same as a person's skin temperature, the amount of heat carried away by convection is very low. In fact, if the air is the same temperature as a person's skin, then no heat is carried away, and if the air temperature is higher than a person's skin temperature, then it can actually add heat to the person, making him or her warmer. You can test this yourself if you ever go into a sauna. The air temperature will be higher than your skin temperature. Create a wind by blowing onto your forearm. The wind will feel hot, an indication that the convection was carrying heat to your arm. This certainly demonstrated why the wind is so much more effective in cooling people in cold weather than in warm or hot weather.
The goal for the thermal comfort of people, then, is generally to decrease wind speeds in cold seasons and to increase them, if possible, in warm weather. Even in very hot conditions, people like to have some air movement.
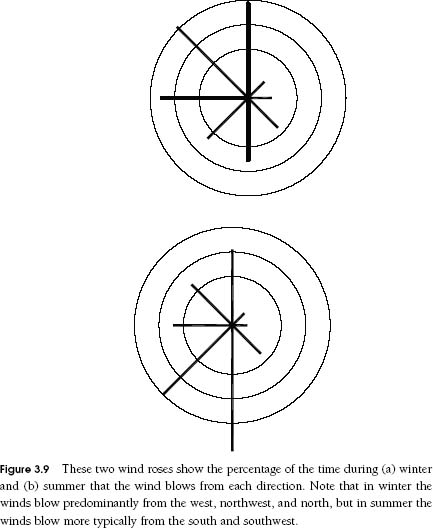
The first problem to consider, as we have already discussed, is that the wind does not blow consistently from any one direction. In fact, on any given day, it can blow from any and every direction. This makes if difficult to block without creating a windbreak on all sides. However, the wind will tend to blow from a predominant direction in each different region and in each different season. These patterns are available from published data. For example, about 60 percent of winds in Halifax, Nova Scotia, during the winter are from the west, northwest, and north, while 60 percent in the summer are from the south, southwest, and west.
Wind data can be graphically represented by a wind rose. This handy diagram is a series of lines drawn out from a small circle in the middle, with one line for each direction of the compass. Figure 3.9 shows a wind rose for Halifax in winter and summer. The length of the line indicates the percentage of time that the wind typically blows from each direction. A wind rose can readily indicate if there were any prevailing winds—that is, directions from which the wind blows more often than from others.
The speed and direction of the wind are generally measured at ten meters (thirty-three feet) above a level, well-mown grassed surface with no obstructions or vegetation for quite a distance in all directions. One of the few places that typically meet these criteria are airports, so climate stations are often established on or near major airports. Anemometers are typically used to measure wind speed. The most common of these is called a cup anemometer, as it has three cups that look like ping-pong balls cut in half mounted on a stand. The cups catch the wind and make the instrument spin; the faster it spins, the higher the wind speed. This instrument works quite well in unobstructed situations like an airport but is of limited value in a complex environment where turbulence invalidates the reading.
Many other types of instruments have also been devised, including one called a hot-wire anemometer, which consists of a tiny wire that is kept at a constant temperature. As the wind cools it, the amount of energy needed to keep it at a constant temperature yields a measure of the wind speed. However, all it takes is for one bird to decide to land on it, or one spider who decides to built a web on it, and the instrument quits working. It's not very robust and mostly is reserved for scientific study.
Wind direction is usually measured through the use of a simple vane. This is simply a paddle of some sort mounted on a spindle; when it catches the wind, it turns so that the wind passes by without obstruction. The direction is recorded, but if you ever have a chance to watch a wind vane on a breezy day, you will notice that there is a lot of variation in the direction of wind flow—a lot! Sometimes the wind can blow from virtually every direction within a minute or two. In order to make some sense of this, an average wind direction over an hour is sometimes calculated, or sometimes the direction that the wind blew from the most during the hour is recorded. Either way, it is a generalization, and it's important to remember that there can be a lot of variation in the data. It's also important to remember that the data recorded at a weather station give an indication of conditions prevailing in an area but will not be exactly the same as the conditions at a landscape some distance from the weather station.
PRECIPITATION
Some mechanisms that we have already discussed can help to explain how and why precipitation occurs. Some of the solar radiation that is absorbed by the ground surface evaporates available water to create vapor, and some of it heats the ground, which in turn heats the air that comes in contact with it. This warmed air will rise, and as it rises it cools. Cooler air cannot hold as much humidity as warmer air, so at some point in its cooling, air will become completely saturated, holding as much water as it is possible for it to hold. If it continues to rise and cools further, then it has to get rid of some of the water vapor that it has in it. It does this by condensing the vapor back into liquid water.
In general, these condensed water particles are initially very small. However, they soon start to collide with one another and start to coalesce into water droplets. When these droplets are heavy enough that the air can no longer hold them up, they will fall to the earth as precipitation. When there are strong updrafts of wind, these particles can grow quite large before they fall. The temperature near the ground will determine whether we experience the precipitation as rain, snow, sleet, or hail.
Air can also be forced to rise by coming in contact with topography. For example, the Cypress Hills in southwestern Saskatchewan, which we discussed earlier, were originally known as the Thunder Hills. Air masses moving across the prairies are forced by elevation change to rise, thus cooling the air and causing condensation and precipitation, which is often accompanied by lightning and thunder.
Precipitation is fairly challenging to measure mainly because rain does not fall equally in all areas of a landscape—even within one storm. The amount of rain that is measured at one point can be quite different from a point even a short distance away—partly due to the actual amount that falls in different areas but also partly because of the design of the rain gauge.
There are probably two main reasons why you might want to use precipitation data—one related to rain and one to snow. In areas with small amounts of rainfall, it might be advantageous to collect rainwater for irrigation or domestic uses, and it's a fairly straightforward calculation to multiply the normal annual rainfall amount by the surface area that will be collecting it (say the roof of a house) to yield the volume of water that could typically be accumulated each year. In areas that receive snowfall, it can be valuable to know both the typical amount of snow in a given year and the direction of the wind during and immediately after snowfall events. This information would allow for strategic windbreaks to be designed into the landscape to encourage the snow to accumulate in desired areas and not where it is unwanted.
The distribution of precipitation around the world is fairly extreme. There are some areas of Chile that have not had precipitation in living memory. The lowest measured precipitation on earth is in Arica, Chile, where the average annual amount is less than one millimeter! On the other end of the scale, there are several places that contend for the wettest place on earth. The winner is probably Lloro, Colombia, where they get, on average, more than 13 meters (43 feet) of rainfall each year. Another way of measuring “wettest” is to count the number of rain days per year. This contest is likely won by a mountaintop climate station in Hawaii that has only about fourteen days per year when it doesn't rain. Lucky the person who selects those two weeks for their annual vacation!
Precipitation is a significant issue in many people's lives and livelihoods. It's certainly a rural tradition in Canada to record and compare rainfall amounts. Southern Saskatchewan doesn't get very much rain in a typical year—somewhere around thirty-six centimeters (fourteen inches), and most of that comes in the springtime.4 Farmers at coffee row report on every rainfall event: “Wild Horse Butte only got a half inch.” “We had a full inch on our north quarter.” “Didn't rain at all at Shaunavon.”
In terms of microclimate, though, it isn't so much the amount of rainfall but, rather, the time and duration of precipitation events that is often of most interest to us. Knowing that most of the rain in an area falls during a specific period allows for strategic planning. Elizabeth II, queen of Canada, once toured Saskatchewan to celebrate their one hundred years as a province. Anyone who looked at the average rainfall data for Saskatchewan would say that she could come at almost any time and expect clear weather—after all, they get less annual precipitation than places in the middle of the Sahara Desert. However, anyone who looked more closely at the rainfall distribution throughout a typical year would see that the month of May was smack dab in the middle of the rainiest time of the year. Sure enough, she came in May and spent her time under an umbrella, while the massive crowds stood in pouring rain, just about the only big rainfall of the year, to get a glimpse of Her Majesty.
With the other main form of precipitation, snowfall, we are more concerned about how much falls and what the direction and speed of the wind are during and after snowfall events. This will influence where and how much snow deposits in the landscape. The faster the wind is moving, the more snow it can carry with it. A light wind will hardly be able to deflect snow that is falling, and it will be distributed like a blanket across the landscape. However, a strong wind, either during snowfall or when there is snow on the ground, can carry it great distances and will deposit it unevenly evenly across the landscape. When the wind slows down for some reason, such as behind a windbreak, the slower-moving air has to drop part of its load. Snow will build up in drifts behind windbreaks and snow fences. In winter landscapes, the deposition of snow can have a major impact on the lives and activities of the population. The champion of all snowfalls was during a week in February 1959 when almost 5 meters (about 15 feet) of snow fell at Mount Shasta Ski Bowl in California. Even the powder snow fanatics wouldn't dare ski in that much new snow!
We had a family business on Main Street in a small Saskatchewan town when I was a teenager, and one of my responsibilities was to clear the front sidewalk every morning before school. The sidewalk faced to the east and was often a relatively comfortable place to be, since the prevailing winds are from the west and the building provided a wind break of sorts. However, all winter long, the wind picked up snow from across the prairies and deposited it on my stretch of sidewalk. The reduced wind speed that made the area more thermally comfortable created ideal conditions for snow deposition. Across the street from me, the owner of the hardware store was itching to try out the various snow shovels and brooms in his store. Every morning I would see him come out, look at his snow-free sidewalk, sigh heavily, shake his head, and take his snow shovel back inside.
ENERGY BUDGETS
The energy budget is probably the most important concept in microclimatology. It is a powerful tool for analyzing components of the landscape to determine their effect on the microclimate. It's a fairly simple concept but can lead to some complex and insightful analyses.
Earlier, we discussed the concept of a radiation budget. You will recall that we said that all the radiation that reaches a surface has to be accounted for and that it can be intercepted, reflected, or absorbed. Now we are going to consider the radiation that has been absorbed by a surface. Once again, we have to say that all the energy has to be accounted for. So where does it go?
Radiant energy that is absorbed by a surface is divided first between two streams of energy. We can think of these two streams as lining up and taking turns. First in line is latent heat (that is, heat that is used to evaporate water). As long as an object is wet, and the atmosphere has some capacity to receive more vapor, evaporation can take almost all the energy that it wants from a surface—and changing the state of water from liquid to vapor takes a lot of energy! Wet surfaces will generally gobble up a lot of the energy they receive, and there will not be much left for the other stream. If the surface is dry, however, and if there is no liquid water available to evaporate, then no energy can go into evaporation and all of the energy has to be used by the other stream—sensible heat (that is, heat that can be sensed).
The molecules in the surface of the material become excited by the energy they receive, they become more energetic, and the temperature of the surface begins to rise. The molecules at the surface will become warmer than those molecules below them in the material as well as those above them in the air. If the object has a high capacity to absorb heat, then a large amount of energy will go first into the conduction channel—that is, it will be conducted into the material. Some materials, such as stone, have high thermal admittance values, so they will allow a lot of energy to be absorbed and used to warm the interior of the stone.5 Other materials, such as wood, have low thermal admittances, so not much energy will be admitted into the interior of the wood.
The second channel through which the heated molecules at the surface can expend their energy is convection. As we have discussed before, air molecules that come in contact with the surface get heated and carried away by the wind or will rise because they are warmer than the surrounding air (a process known as natural convection). Finally, if any energy is left over, it will be emitted as terrestrial radiation.
Through this simple but powerful model, we can understand and control the energy of any surface. Let's consider a few examples. We've talked a few times already about how a black asphalt surface can get so hot on a sunny day. Let's use an energy budget to find out why.
First of all, the low albedo of the black color means that most of the solar radiation reaching the surface will not be reflected and will have to be absorbed. Unless there has been a recent rainfall, the surface will be dry and no energy will be able to go into evaporation. All the energy has to go into heating the asphalt itself. The surface will become quite hot, and this surplus of energy can be conducted into the asphalt, passed into the air by convection, or emitted as terrestrial radiation. A strong, cold wind would be able to cool the surface, but on a hot still summer day, a very large portion of the solar radiation received will heat the asphalt and be emitted as terrestrial radiation. A person standing on the asphalt surface would be bathed in a stream of terrestrial radiation.
If you wanted to manage the microclimate so as to reduce the terrestrial radiation emission, you have the opportunity to modify any or all of the channels. First, you could reduce the amount of solar radiation arriving at the surface by intercepting it along the way. This could be done with a shading device, such as a tree in full leaf or an overhead canopy. If you can't intercept the radiation, then you could change the albedo of the surface. This could be done by painting the asphalt a lighter color or in some way covering it with a layer of lighter-colored material. The next option you have would be to wet the surface to allow energy to go into evaporation. If you continued to add water to the surface, eventually it would cool down to air temperature or even lower. If the humidity in the air was low, the surface would cool down to the dew point of water. Finally, if none of these options is available to you, then you would need to consider whether you could use the terrestrial radiation. For example, could the asphalt surface be allowed to heat up during the day and then used as an input of terrestrial radiation in the evening when the air is cooler?
A few years ago, I was visiting some friends who live in the interior of British Columbia. The climate there can be very hot and dry during the summer, and their home had decks on the east and west sides of the house, both of which were completely open to the sun. We had coffee on the east deck early in the morning, but by mid morning it was impossibly hot. We were able to then move to the west deck until nearly noon, and then it too was unbearably hot. Then neither deck was usable until late in the evening, when the air started to cool. Both decks were quite comfortable then due to the amount of terrestrial radiation that they were emitting. The problem was that this pattern didn't match my friends' preferred use pattern. They really wanted to be outside in the afternoons and early evenings because that is when the house got so warm that it was uncomfortable. During the heat of the day, they had nowhere to go to be comfortable.
If you were faced with this problem and were asked to provide some design advice, you could consider the energy budget of the situation and provide a series of possible solutions. You might first suggest that the solar radiation be intercepted before it reaches the deck. This might be accomplished with a strategically placed shade structure or shade tree. Another option would be to intercept the solar radiation before it reaches the people on the deck. This could be done through the use of movable shading devices such as umbrellas, but the shadow of an umbrella would be offset by the angle of the sun—that is, when the sun was not directly overhead, the shadow of the umbrella would be cast some distance from the umbrella. Finally, the people themselves could be encouraged to wear light-colored clothing, which would reflect most of the solar radiation they receive, or they could hold an umbrella to shade themselves.
These techniques would be effective when the sun is actually shining on the deck, but the two decks actually offer an opportunity where one of the decks will be shaded by the house itself at all times except precisely at noon. This means that a shading device might not be necessary and that other means of cooling the decks could be employed. By mid-morning, when the sun is providing so much solar radiation on the east deck that a person would be too hot there, the west deck is shaded quite nicely by the house. The surfaces would have received little solar radiation since the previous afternoon so would likely be quite cool and emitting low amounts of terrestrial radiation. It is probably quite comfortable on the west deck until nearly noon.
Now the problem starts. After noon, the west deck has no shade and the solar radiation load is too large for anyone to spend any time there. Meanwhile, all the surfaces of the east deck are hot from the solar radiation load that they received all morning and are emitting huge amounts of invisible terrestrial radiation. Anyone sitting there would be uncomfortably warm. What opportunities are there for cooling the surfaces? The first thing to think about is whether a lot of the solar radiation that reaches the surface can be reflected. This could be done by lightening the surfaces' colors. White surfaces would stay quite cool, while darker surfaces would be much warmer. If there is no opportunity to lighten the colors, then what about changing the materials? Materials such as wood have low thermal admittance, so they will not store much energy and won't be able to provide a source of terrestrial radiation for long. Alternatively, brick walls, stone surfaces, and the metal of the barbeque will all have high thermal admittance values and will store a lot of energy that will be emitted as terrestrial radiation.
If you can't change the colors or the materials, what about a quick and effective fix by forcing the heat to go into the latent stream rather than into sensible heat? Water sprayed onto hot surfaces will evaporate, carrying heat away with it. If a surface is sprayed until it stays wet, then the surfaces will have cooled down to the dew point of the air, which is often lower than air temperature, especially in dry climates. The amount of terrestrial radiation it will be emitting will be greatly lessened.
Considering the energy budgets of surfaces in the landscape opens up a whole series of opportunities that might not have been apparent without it. There are many more areas that you will probably be able to think about in terms of the east deck, but let me suggest a couple more. First, we could introduce some forced convection into the deck by running a fan. If the fan were directed at surfaces, it would soon cool the surfaces to air temperature (remember our discussion about measuring air temperature, in which we purposely passed wind over a thermometer to make sure that it was at air temperature?). Used in combination with a spray of water, it would be a very effective way to cool surfaces. In addition, it could be directed at people, thus increasing their convective heat loss and making them feel cooler.
The final solution that I will offer for the east deck (although there are many more possibilities) is a weird one. So far I have been implying that all surfaces emit terrestrial radiation based solely on their temperature—that is, the warmer they are, the more radiation they emit. This is generally true, but there are a few interesting exceptions. Some materials are notoriously poor at emitting radiation, notably aluminum and gold. If you had two surfaces that were the same temperature but one was covered with aluminum and the other was something like wood or brick, the amount of terrestrial radiation from the aluminum surface would be much lower than the other surface. If you think about it for a minute, this begins to open up some interesting possibilities in the landscape. Aluminum deck furniture would reflect most of the solar radiation it receives and would emit little terrestrial radiation if it did heat up.
But, of course, the most effective action would have been to consider the microclimate when designing the house and decks in the first place—which is really the underlying intent of this book. Consider microclimate first, or at least very early in the design process, and you won't be faced with trying to resolve problems like this later.
Covering west-facing windows with aluminum foil has become a vernacular microclimatic design response. People do it to keep the interiors of their houses cooler in hot climates, but I'm sure that most of them don't understand the physics behind why it works. First of all it is highly reflective, so that most of the solar radiation that it receives it simply reflects away. That is quite effective in and of itself. However, there is the added benefit that when the air temperature gets very high, like it does in Tucson in the summer time, the temperature of the walls and windows of houses will also get very high. A normal glass window will emit radiation into a house based on its temperature, but an aluminum foil–covered window will emit terrestrial radiation at a much lower rate, resulting in a cooler interior to the house.
This concept was used in a spectacular way in downtown Toronto where a major bank constructed a tall office building. They covered the windows in gold. To look at the building from the outside, the windows are definitely gold colored, but in fact the layer of gold is almost unimaginably thin—just a few molecules thick. From inside the building, you can easily see out the windows as if there were no layer of gold on them. However, even a layer of gold that thin will emit at a much lower rate than the windows alone. This has benefit in both summer and winter. In summer, the amount of energy added to the interior of the building is reduced by the highly reflective gold. In the winter, the amount of energy emitted from the windows into space is minimized.
The concept of energy budgets can be usefully applied to other things in the landscape as well, such as buildings and people. As fossil fuel supplies dwindle and energy costs rise, the amount of energy needed to heat and cool homes will become of increasing interest to the public. An analysis of the streams of energy into and out of a building can help to identify ways to reduce energy loss in winter and energy input in summer. Similarly, assessing the flows of energy to and from a person in the landscape can help to identify ways that the environment can provide thermally comfortable settings. Sometimes, a problem offers an opportunity. The solar radiation that was making both the east and west decks too hot could be captured by solar panels, turned into electricity, and used to run an air conditioner to cool the interior of the house.
Remember the age-old question, “If a tree falls in the woods, and no one is there to hear it, does it make a sound?” We can ask a couple of similar questions about microclimate modification. “If a fan blows air through an outdoor area, and there is no one there to experience it, will it make the microclimate cooler?” or “If radiant energy is emitted into an outdoor area and no one is there to intercept and absorb it, will it make the microclimate warmer?” In both microclimate cases, the answer is no. It's like leaving a light on in a room when no one is there to use it. The light is only useful if there is an eye there to see it. Similarly, the tree falling in the woods sets up waves in the air. These waves are only experienced as sound by an ear, and if there is no ear to hear it, then there is no sound. Oh, and by the way, there is no color per se in the universe. It is the human eye that categorizes some of the wavelengths of the solar spectrum to allow our brains to experience them as colors. So it's all in how information is received.
SUMMARY
At this point, you might be asking the question that I've been asked so often: “so what?” What does it matter whether or not we can modify the air temperature or the humidity in the air and that the only things we can modify are wind, sun, and precipitation? Why do we need to understand that there is terrestrial radiation? If we can design landscapes that are thermally comfortable environments, why should we worry whether it is the air temperature that we are changing or the radiation that we are modifying?
The short answer is that if you don't understand what you are doing, you will be right only some of the time; the rest of the time, you will inadvertently create uncomfortable environments. If you find a pattern or prototype that works for a given climate region, you might be able to reproduce it over and over again and it might work reasonably well much of the time. But what if the site conditions are slightly different, or what if you move out of the climate region? What if your site was close to a large body of water? And what about changing a part of the pattern? Will you know for sure that it won't end up creating an uncomfortable microclimate? Unless you understand the physics of the system, you won't know how to correct it. Take the piazza situation in Italy: without considering the energy budget of the space, it is unlikely that anyone would have guessed that the cars parked there during the day were causing it to be a place where people didn't want to go in the evenings.
Or take a situation where people decide to make an outdoor café warmer in the cool evenings. If they didn't realize how quickly and effectively the air mixes and dissipates the heated air, they might end up wasting ing a lot of energy trying to heat the air. They might think that turning the heater on early would warm up the environment, when in fact it has no effect (except maybe to heat up the chairs and tables) until people are there to absorb it. Similarly, if they tried to warm up an area, they might not realize that as the air warms it rises out of a place and the energy is wasted. If they understood instead that a source of radiation will heat people in a cool environment without wasting any energy heating the air, they could create an effective and comfortable environment. There might be a situation where you would want to humidify the air—if you were doing a project in a dry climate, for example. Almost whatever you did would dissipate almost immediately. But if you understood the mechanism by which this happens, you could either decide to design to isolate the space from the surrounding air, thus creating an area of moisturized air, or you might try to achieve something else.
Here is an example that might help to make my case. As I began to formulate my ideas about the microclimatic aspects of the dry landscape gardens in Japan, I was interested in visiting as many of these gardens as possible to look for similarities. My Japanese colleague and I visited a garden that had been moved from its original location to a site outside Kyoto. The building and garden were meticulously moved, but when we sat on the verandah and looked into the garden, it was surprisingly devoid of any interest to us. It just seemed like a rectangle of gravel, and within a short time we were very uncomfortable and disinterested and rose to leave. It was at this point that we realized the orientation of the garden had been changed during the reconstruction. This garden had faced to the south when in its original location but now was oriented toward the north. The pattern was correct, but because the orientation was wrong, the microclimatic processes were very different, resulting in a garden that didn't work.
Here's another example. One landscape prototype that can be very effective is the sun-catch. This is a situation where the outdoor area is oriented on the south face of a hill or the south side of a building and wind barriers are provided on the west and north sides. A sun-catch can be thermally comfortable even in the middle of cold winter days. While people outside the sun-catch struggle along in the cold wind, others can sit and bask in the sun-catch—away from the cold wind and in the intense winter sunshine.
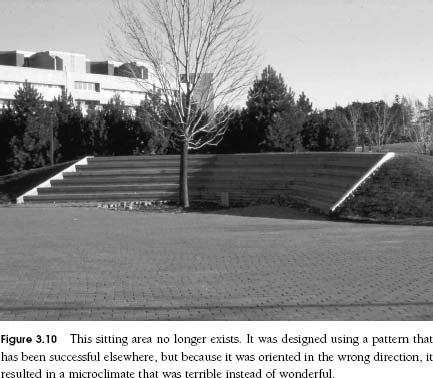
If a sun-catch is going to be used in the summertime, then it needs to have a shading device, a role that can be played very nicely by a deciduous tree. If the tree is located within the sun-catch to the south of the sitting area, then it will not block much solar radiation in winter and will provide welcome shade in summer.
But what happens if you change a prototype a little bit? For example, a prototypical sun-catch was built on the University of Guelph campus and the designer apparently didn't understand the microclimatic mechanism. It was built with all the right characteristics and looked fine, but it was orientated in the wrong direction (see figure 3.10). You can see that all the elements are there; they are just in the wrong spots. The sitting area opens toward the north, so the sun doesn't shine into the area during the winter. However, the cold winds can blow directly into the space. In summer, the shadow of the tree falls on the walkway, while the breezes are effectively blocked by the windbreak. You would be hard-pressed to design a more microclimatically inappropriate space. Nobody ever used the space, and after a few years it was dismantled. If you visit it today, you will see that they have removed all the seating and covered it with turf. Now it is simply a maintenance problem.
At this point, let's pause to think about what we have learned in this chapter. Human thermal comfort is affected by air temperature, air humidity, solar radiation, terrestrial radiation, and wind. Air temperature and air humidity affect thermal comfort but can't be modified very much through the design of the landscape (with some notable exceptions). On the other hand, solar radiation, terrestrial radiation, and wind can all be greatly affected by the landscape, so they provide us with mechanisms that we can modify through design.
These three elements affect thermal comfort differently in different seasons. When designing places that will be used in winter, we should design first to reduce the speed of the wind and then do what we can to maximize solar and terrestrial radiation. For places that will be used primarily in summertime, we should design first to minimize the solar and terrestrial radiation and then do what we can to allow breezes to move through the area. One simple way to remember these relationships is through the acronym WW:SS, which stands for Winter Wind:Summer Sun. In the winter the priority is the wind, and in the summer the priority is the sun. In the spring and fall the wind and sun are of roughly equal importance.
Now that you are aware of the largely invisible components of the microclimate, you can use your body to experience and understand them at a deeper level. Whenever you move through any landscape, be conscious of your thermal comfort; as it changes, assess what mechanism is at work. Take time to stand near a sun-warmed wall on a cool day, or by a cool shady wall on a hot day. See how long it takes before you notice the effects of the terrestrial radiation balance. Visit public open spaces and watch where people choose to spend their time. In the spring do most people look for a place to sit in the full sun? Do they avoid windy areas? In the summer do they seek shade? Does an area that is hot during the day attract evening visitors?
I'm sure that you are already forming all sorts of ideas about how you can use this information in your designs to make outdoor places more thermally comfortable. Now that you understand the mechanisms, they will become second nature and in many cases you can design for thermal comfort by simply using your intuition. For more complex situations, you will benefit from having a process that you can follow. In the next chapter, we are going to learn about a process that you can use to strategically and deliberately modify microclimates to create thermally comfortable outdoor space.