APPENDIX
Data Dictionary
Produced by Michael Oram, with Anthony Perl,
Jeffrey Kenworthy, and Matt Hern
In order to pursue the analysis presented in this book, we were obliged to construct a unique data set that assembled information about both physical and fiscal characteristics of major mobility infrastructure in Montreal, Toronto, and Vancouver. Collecting and organizing such data became a prerequisite for our analytical objective. In many nations, data on numerous aspects of urban mobility can be easily obtained from agencies responsible for transportation, urban development, or statistics generally. This information resource provides a reliable and accessible empirical foundation for building the kind of analysis that we have presented in the preceding pages.
Canada has been recognized as an outlier among developed nations when it comes to the public availability of statistical data. A recent media investigation into Canada’s data culture found that “either the government doesn’t collect the numbers, or it doesn’t make them easily accessible to the public. Or they are kept hidden away entirely. [As a result] Canadian society has no way of answering key questions about itself, in fields ranging from energy and the environment to the condition of seniors in nursing homes” (Andrew-Gee and Grant 2019). This led one of Canada’s major national newspapers to recommend that the federal government develop a new Canadian “facts strategy” because “the most obvious problem with our data deficit … is that Canadian politicians and voters often don’t have good evidence to make the right decisions, whether the issue is maternal health, people with disabilities, energy use or the housing industry. That’s fine if you belong to the school of policy-making where decisions are made on feelings and hunches. The rest of us should demand better” (Globe and Mail 2019).
As a small contribution to illustrating what greater availability and quality in Canada’s urban mobility data could resemble, we are presenting in this appendix the specific definitions and sources of the data that we have assembled, which are organized in the form of a data dictionary. A data dictionary has been defined as “a part of the metadata that is used to understand the data and the databases that contain it. The data dictionary identifies data elements and their attributes including names, definitions and units of measure and other information” (Northeast Environmental Data-Network 2006).
In assembling our data set, we drew upon sources from municipal and provincial governments, as well as transit agencies and the news media. Each source used different definitions and measures for much of the fiscal and physical information that we sought to interpret. Different jurisdictions typically adopted unique standards and formats for measuring mobility infrastructure. Sometimes these measures changed within a single jurisdiction as the result of government reorganization or a new political direction.
Financial information was even less transparent than physical measures for major mobility infrastructure. Infrastructure funding was rarely disaggregated for specific projects and physical segments. Capital expenditures on road building thus often mixed city streets, suburban arterials, and urban expressways (and sometimes even rural expressways) into a single annual total.
Due to this idiosyncratic variety in both fiscal and physical measurement across Canada, our data represents a patchwork of sources and content, which we have sought to stitch together. This has required a fair amount of interpolation and estimation, which we seek to document here. We hope that this contribution will make our work more transparent and enable our judgments about data collection to be understood better by readers and researchers who seek to expand and improve upon our efforts. There remains much work to close fully the data gaps on Canada’s urban mobility infrastructure and thus create a solid factual foundation along the lines called for in most prescriptions for evidence-based policy analysis.
DEFINITIONS
We begin by presenting our definitions of the key urban-mobility terms used in our data collection. Unlike some nations, where such definitions are prescribed in national statutes or administrative codes, Canada has not adopted a single legal framework of expressway or rapid-transit standards. Instead, provinces have pursued the development of their road networks and urban transit infrastructure, applying their own standards, which are not wholly compatible across the country. We have thus relied on semi-formal guidelines and academic and professional standards in creating our definitions of major mobility infrastructure.
Expressway
An expressway, as defined by the Transportation Association of Canada, is a roadway that provides priority to motor vehicles and possesses the following characteristics: grade separation, traffic volume, restricted access, and minimum traffic speed. This definition, and our justification for selecting it, is elaborated in Perl, Hern, and Kenworthy (2015).
Rapid Transit
Canada’s landscape of public-transit infrastructure is even more diverse than that of its expressways. As a result, we relied on principles articulated by transit-operating agencies and transit researchers to support a definition of rapid-transit infrastructure that could be applied consistently in Montreal, Toronto, and Vancouver.
Our definition was centred on right-of-way and the propulsion attributes to differentiate rapid transit from other forms of public transportation. “Rapid transit is a type of high-capacity public transport that typically operates on an exclusive right-of-way” (TransLink 2016b). This transit consists of electrically powered rail and has high capacity, reliability, and safety (Vuchic 2005).
Construction of New Major Mobility Infrastructure
We sought to differentiate between the initiation and extension of major mobility infrastructure – which contributes to the structure of transport networks and plays a significant role in shaping urban form – and the augmentation of capacity and function within existing mobility networks. Transport infrastructure is regularly and incrementally adjusted and adapted through maintenance and upgrading. Thus, we began with the definition offered by Falcocchio and Levinson (2015) that physical changes to a roadway or transit line that result in increased capacity constitute construction. But we then focused on construction that extended the linear route of the expressway or rapid-transit infrastructure as being the most relevant to our attempt to explain the relationship between major mobility and urban development.
Currency Valuation
All dollar figures have been converted to constant 2014 Canadian dollars. The Bank of Canada’s (2014) inflation calculator was used to calculate the adjustments for inflation.
Time Frame for Data Collection
Our data have been collected from the earliest evidence of major mobility infrastructure within the urban boundaries of Montreal, Toronto, and Vancouver. Most of our data come from the postwar decades of the twentieth century – i.e., the 1950s through 2001, coinciding with the 1 January 2002 amalgamation of the municipalities on the Island of Montreal (Trent 2012). With one exception, any infrastructure that was not operational at 1 January 2002 was deemed to be outside the scope of the analysis and interpretation that we have developed. Vancouver’s Millennium Line rapid-transit infrastructure opened to the public on 7 January 2002. Since it had been built and was fully operational (but not in revenue service) by the end of 2001, we elected to include that infrastructure in our analysis of Vancouver.
Selected, and by no means comprehensive, information about major mobility infrastructure that has been built within our urban area boundaries beyond 2002 has been included as supplementary information. It is identified in separate listings here under the headings “Construction beyond 2001” or “Non-operational as of 1 January 2002” for reference purposes.
URBAN ATTRIBUTES
Montreal
POPULATION
We obtained population data from two sources. The first source was Statistics Canada’s census metropolitan area (CMA). The second source was Statistics Canada’s census subdivision (CS). The difference between the two sources is definitional, with the CS being the same area as the legal body that is the City of Montreal, and the CMA being a creation of Statistics Canada. The CMA includes an urban core surrounded by suburban municipalities. The CS refers to a single municipality as determined through provincial legislation. In other words, the CS covers the City of Montreal (“metropolitan Montreal”), and the CMA includes the surrounding suburbs (“greater Montreal”).
The 1951 and 1956 census data were used for population counts between 1951 and 1957, with the years between censuses being averaged out. Between 1958 and 1987, population figures were periodically verified through City of Montreal’s population data. From 1988 to 2011, population counts were averaged out from the observed census population figures accessed through the City of Montreal’s website for the years 1991, 1996, 2001, 2006, and 2011. For the years 2012, 2013, and 2014, population estimates were provided in the City of Montreal’s annual budgets.
MUNICIPAL BOUNDARIES
Municipal boundaries in and around Montreal have undergone a series of changes over the years. Prior to 2002, the Island of Montreal was made up of twenty-eight municipalities. On 1 January 2002 the provincial government enacted amalgamation to create one City of Montreal on the entire Island of Montreal. This amalgamation only lasted four years and was broken up into sixteen municipalities in 2006. However, following this break-up of the amalgamated city, a regional authority, the Metropolitan Transportation Agency (AMT), continued to provide and plan for public transport in the greater Montreal region (Trent 2012; AMT 2013; Government of Quebec 2015). The AMT carries out its role in coordination with municipal transit agencies.
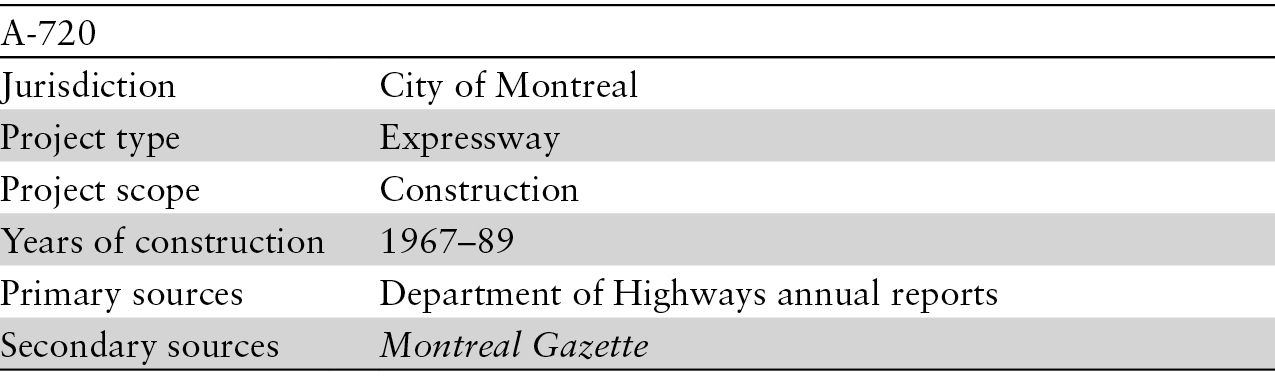
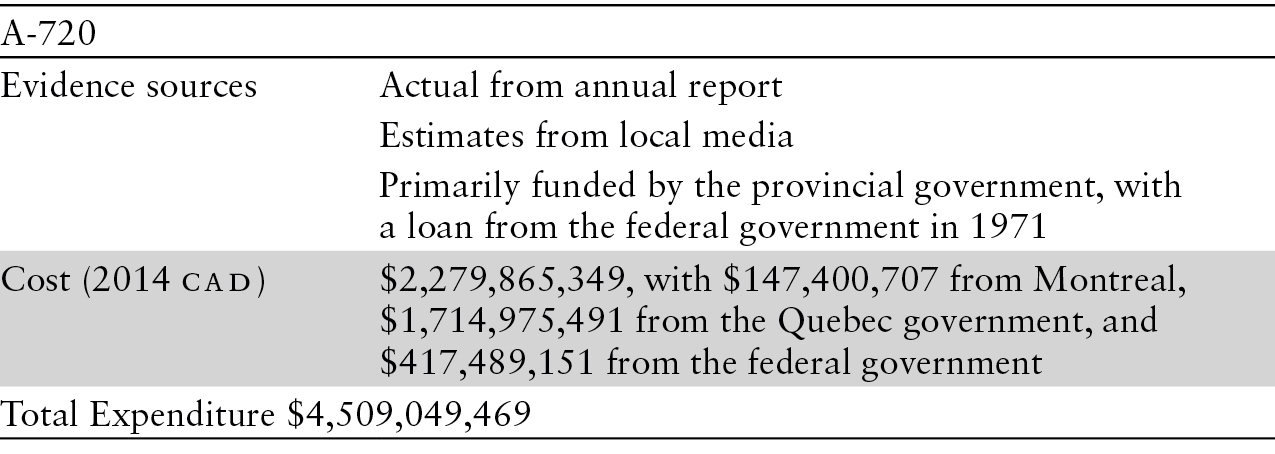
Expressway data were collected for the City of Montreal, using the boundaries as they had existed before 2002. Individual municipalities were responsible for their own expressway expenditures at the start of urban expressway development in and around Montreal, while the regional transit body, the Montreal Urban Community (MUC), was responsible for building rapid-transit infrastructure. For example, it was the City of Montreal – and not the surrounding municipalities – that signed the 1964 expressway-funding agreement with the Province before Expo 67. Expo-related expressway projects and the A-720 expressway (located almost entirely in Montreal) accounted for the lion’s share of expressway investment in the Montreal area and left many surrounding municipalities untouched. In contrast, the original rapid-transit investments were committed by the City of Montreal, with other municipalities sharing responsibility for rapid-transit-infrastructure investment when they joined the MUC in subsequent decades.
EXPRESSWAYS
Length Measurement
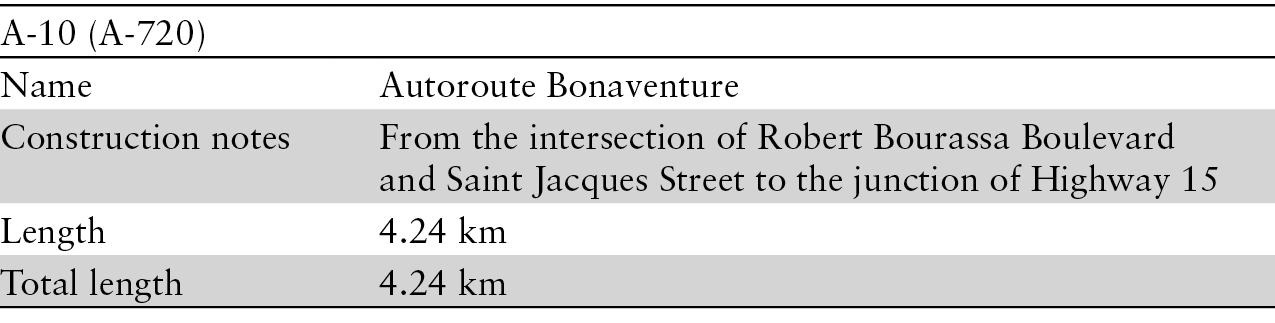
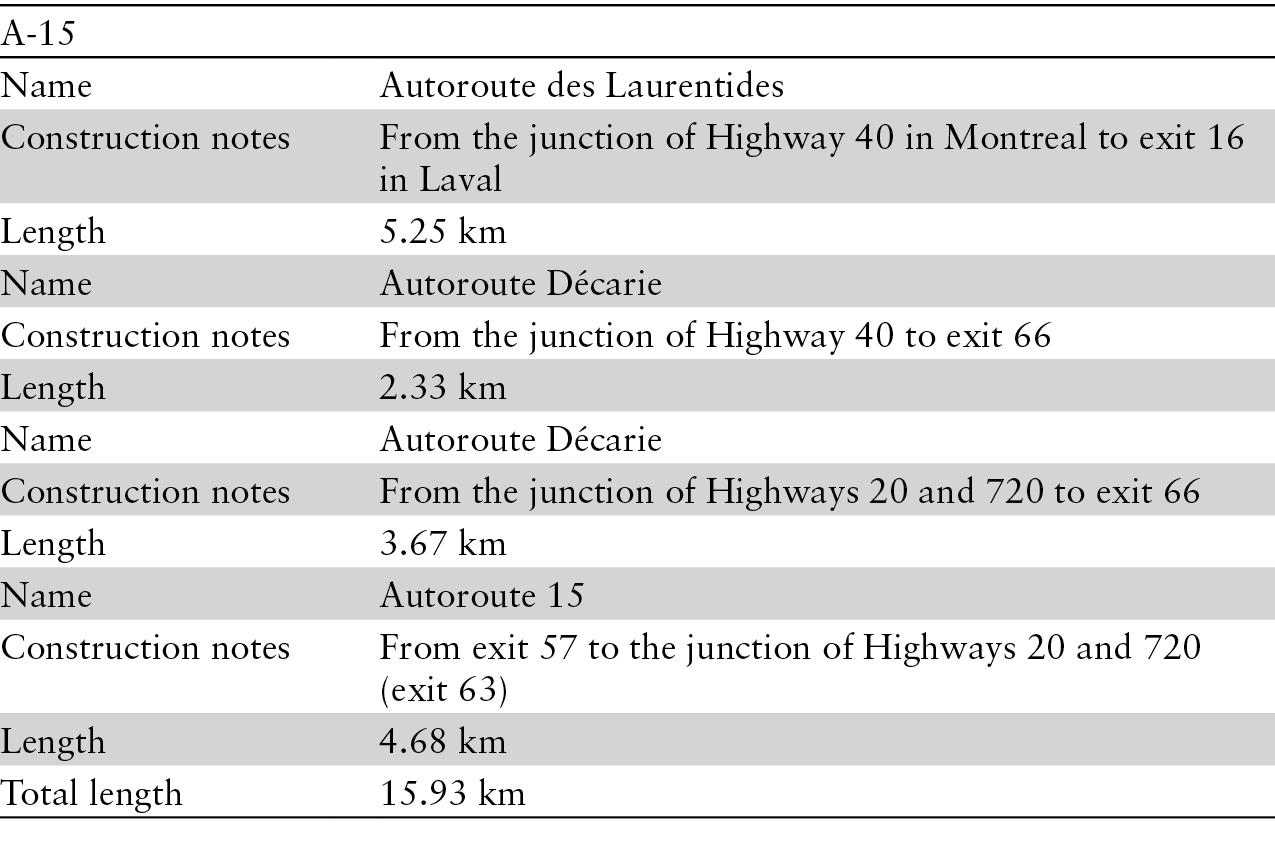
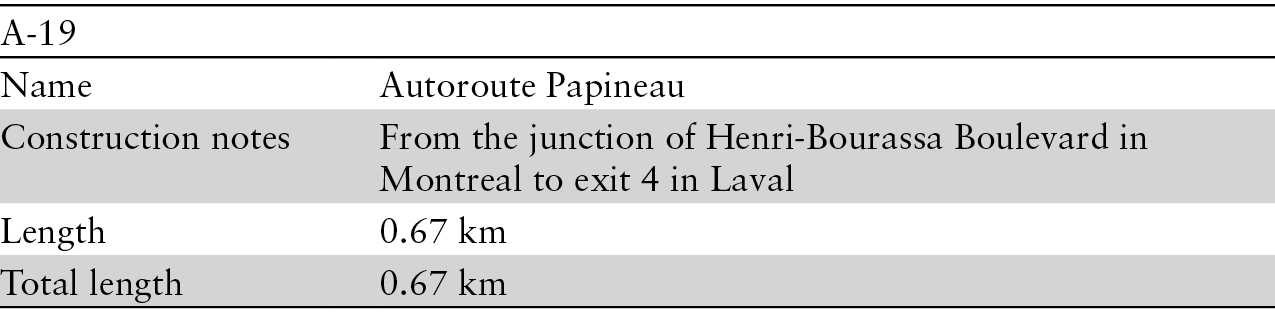
Expressway length was measured using Google Earth’s line tool. A line was overlaid on the expressways, following their routes through the area of study for Montreal. Expressway start and end points are identified in each of the following tables.
All measurements were completed between 23 and 27 May 2016; a second set of measurements was completed between 20 and 30 June. All Google Earth imagery used was dated in 2015.
Limits, Gaps, and Notes
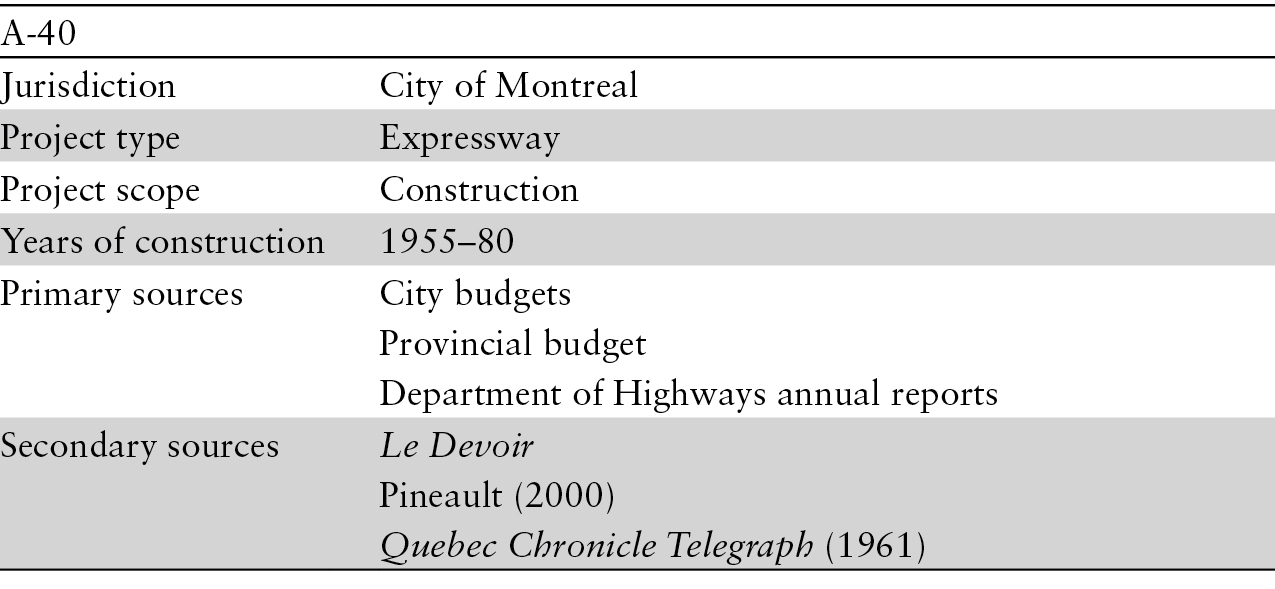
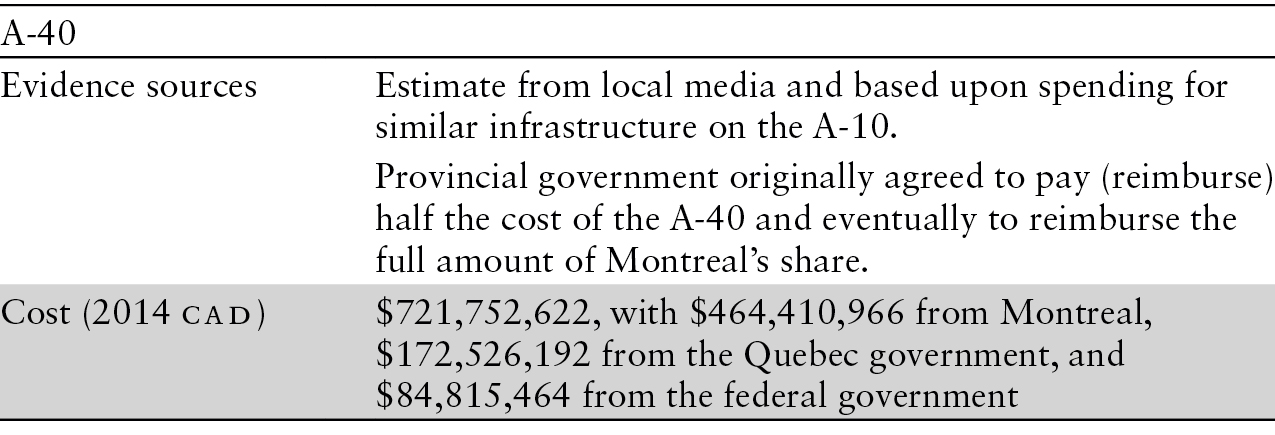
There has been considerable change in the funding sources for Montreal’s expressway infrastructure. During the 1950s, Montreal and surrounding municipalities were the sole funders of the A-40 expressway. In the 1960s, expressways became a cost-shared initiative of the municipal, provincial, and federal governments. By the 1970s, the Government of Quebec had become the principal funder of expressway infrastructure.
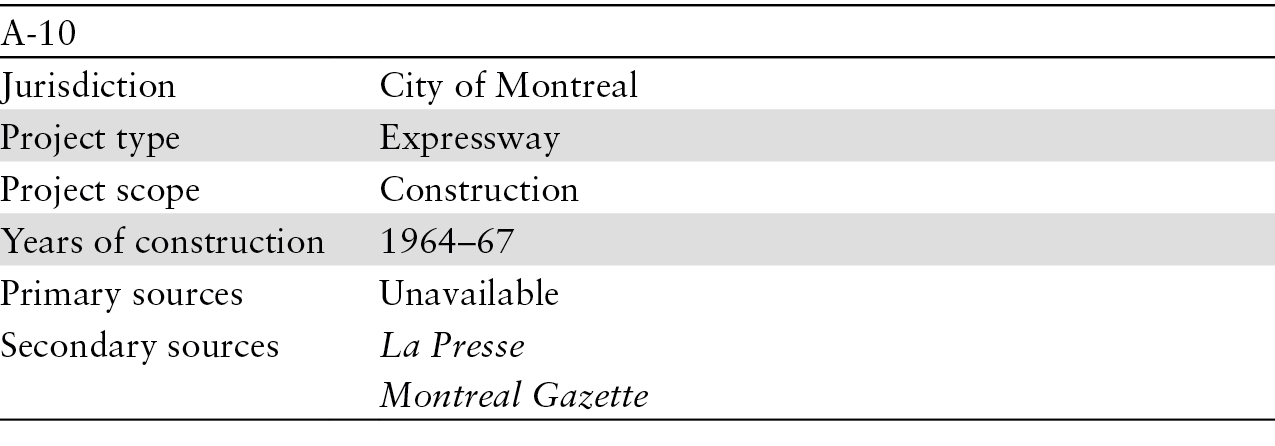
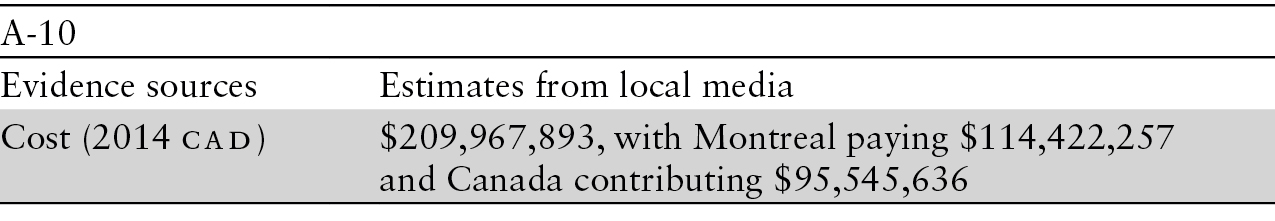
Intergovernmental funding arrangements are complicated by both retroactive and transitive financing provisions. In other words, intergovernmental transfers were negotiated after expenses had already been incurred on expressway construction, with the financing being used to leverage construction of other expressway segments. For example, in 1961 the Province assumed responsibility for funding part of the A-40 infrastructure and agreed to repay the City of Montreal through annual transfers. However, during this same period the City made significant investments in Expo-related expressway projects (e.g., the A-10 expressway) and provided much of the expropriation costs for the early development of the A-720 expressway’s infrastructure.
Annual spending patterns have been extrapolated from estimates of total project costs, or the most similar expressway project cost with a known expenditure, which were spread over the life of the construction project.
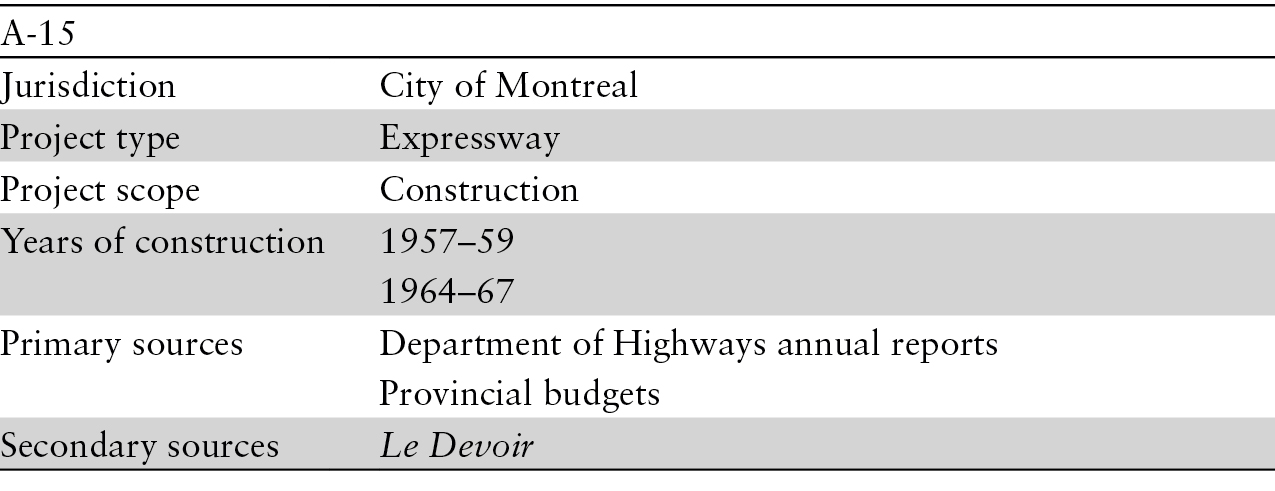
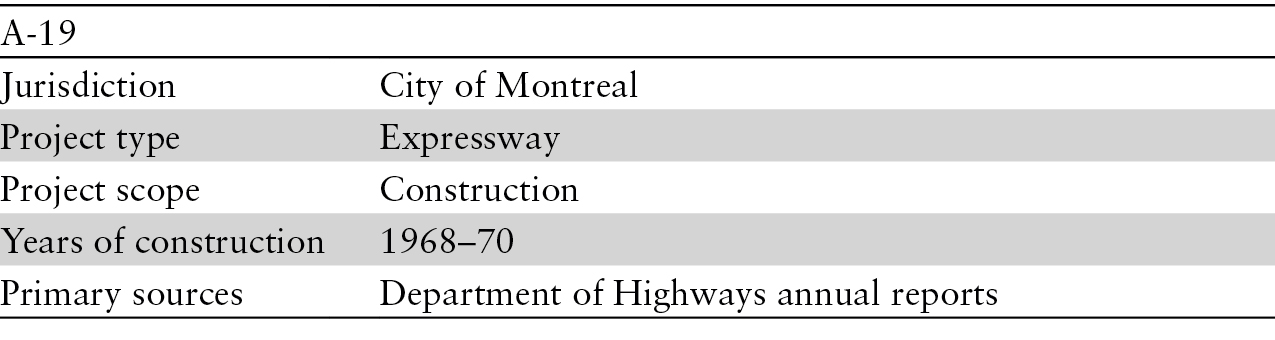
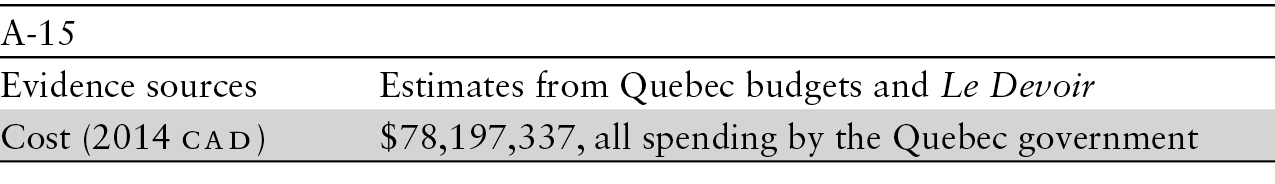
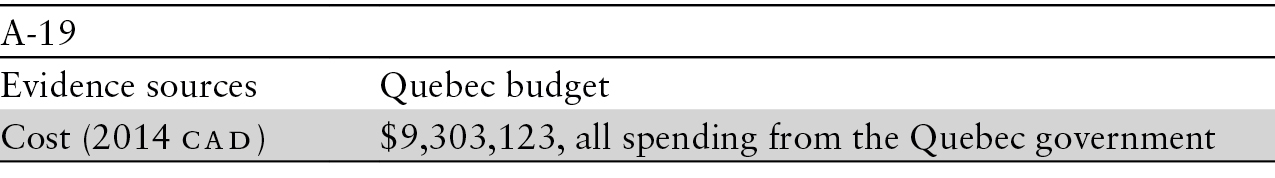
Along the trajectory of developing Montreal’s major mobility infrastructure, fiscal reporting on capital expenditure for expressway infrastructure has been inconsistent and incomplete. For example, after 1961 the City of Montreal focused its expressway expenditures on right-of-way acquisition through expropriation and other preparatory engineering works (e.g., relocating utilities), but its reporting documents do not provide a clear breakdown of these outlays. As another example, the federal government provided Quebec with a $346 million loan (all figures in 2014 Canadian dollars) as part of a job creation program in 1970. The Province agreed to a twenty-year repayment schedule, but that schedule was never released. Similarly, the provincial transport ministry has reported aggregate construction costs along an entire expressway’s route. Most highways – such as the A-19, the A-40, and the A15 – are provincial expressways that run through Montreal. It was thus challenging to isolate the spending for specific segments within the City of Montreal.
In 1960 the federal and provincial governments came to an agreement on cost sharing for the Trans-Canada Highway. Following this, in 1964 the City of Montreal entered into a cost-sharing agreement with the Government of Quebec for expressway construction leading up to Expo 67.
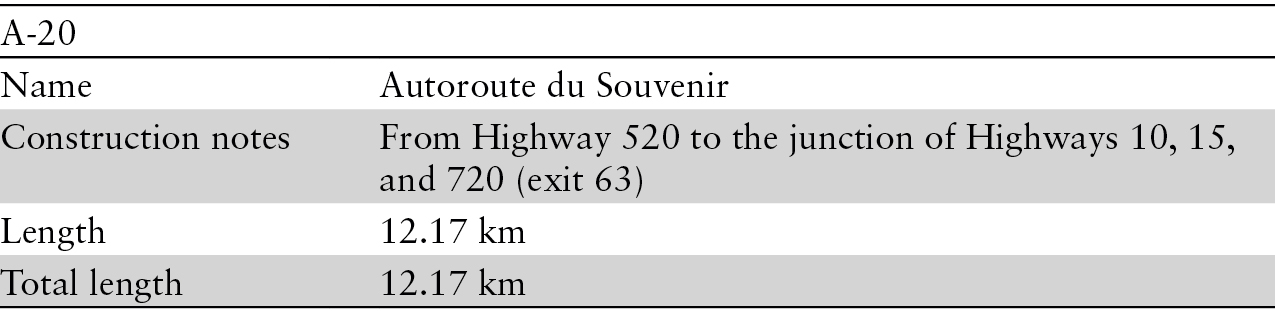
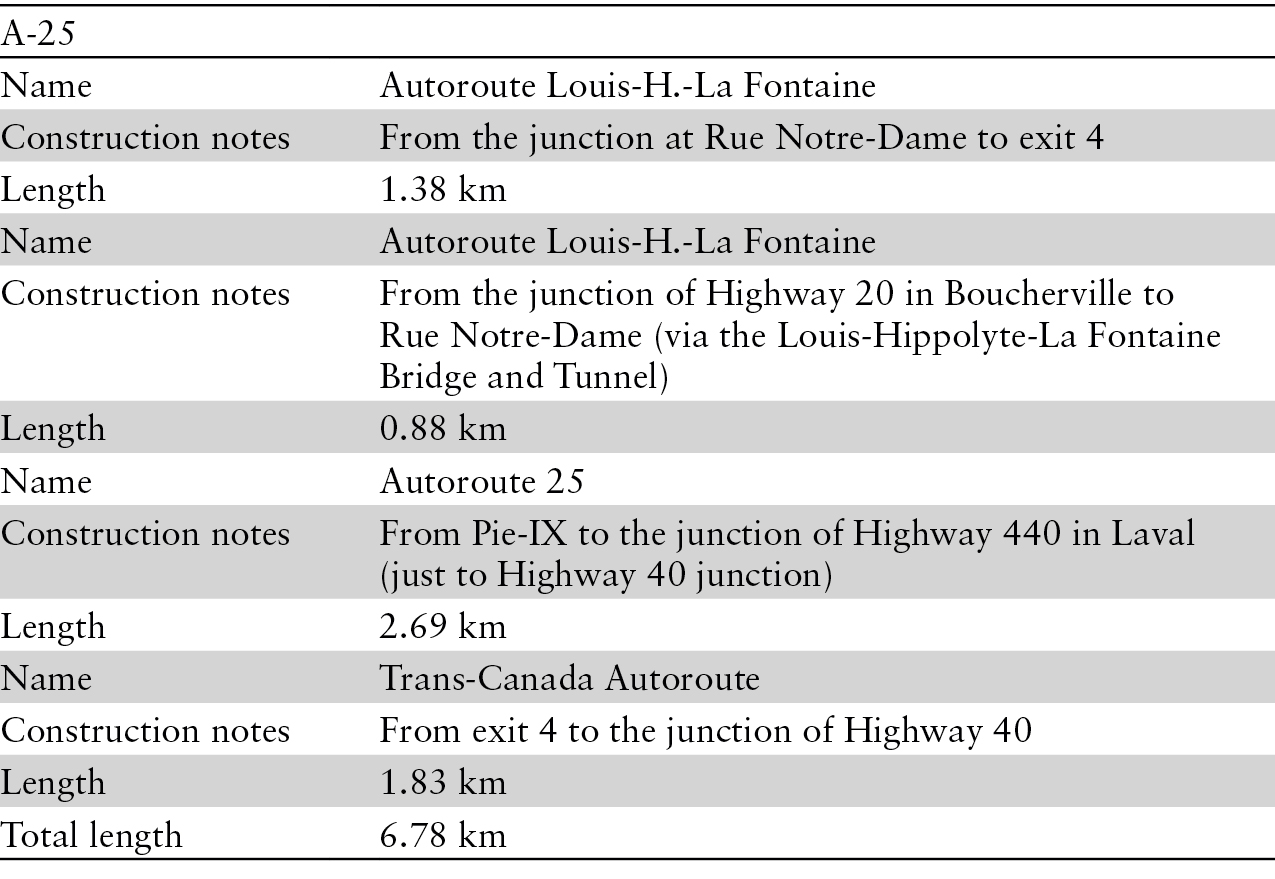
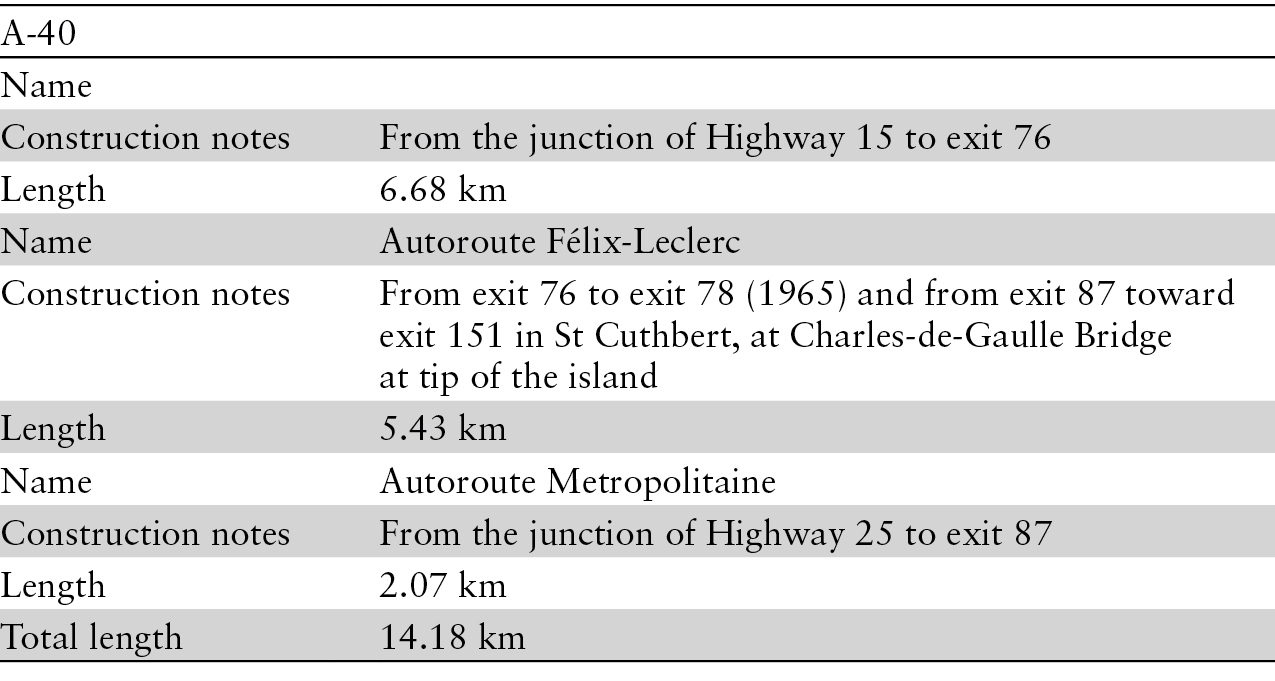
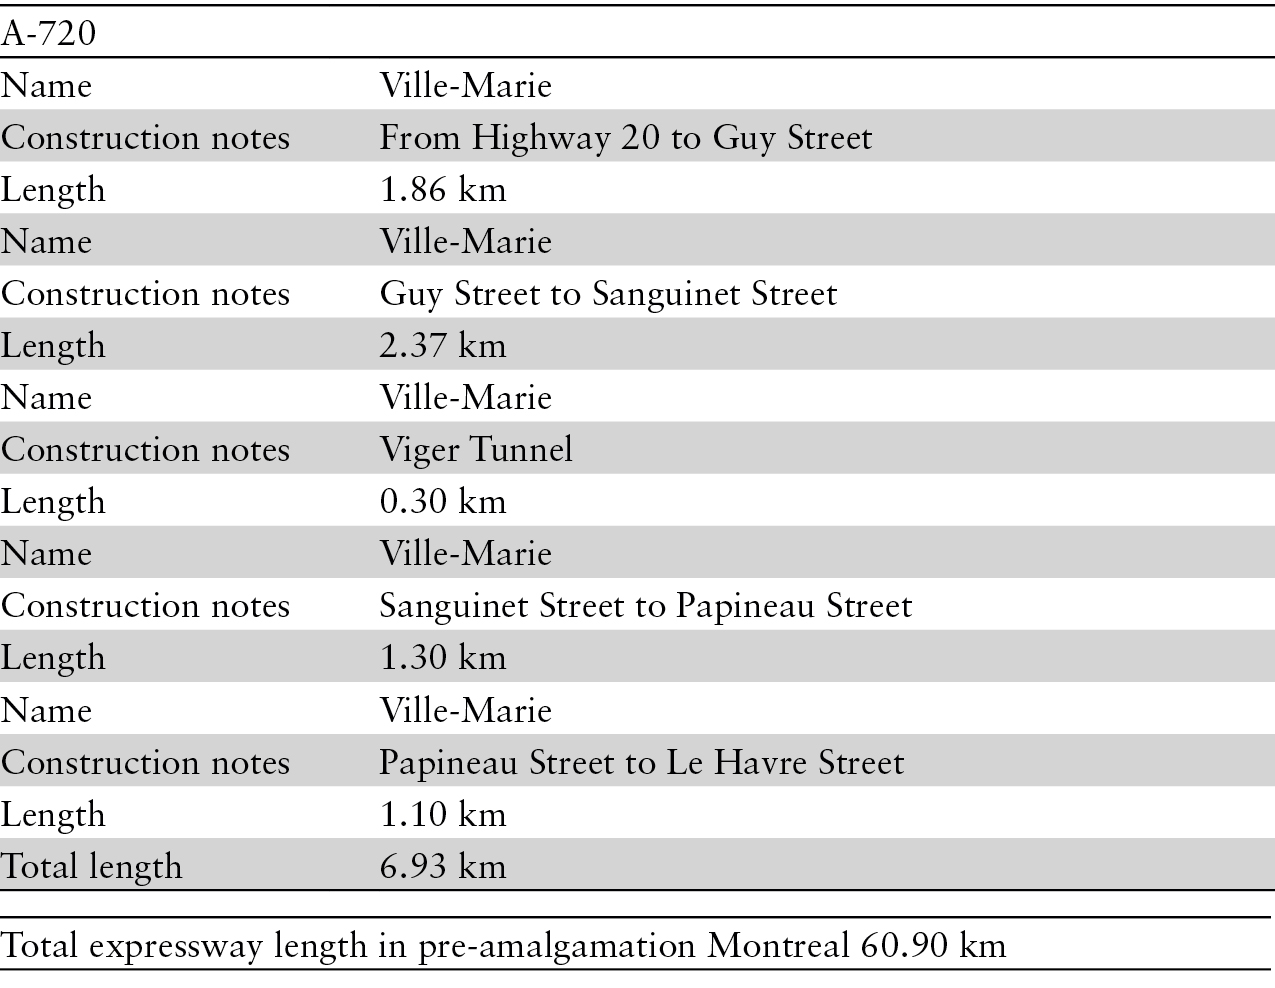
Overview


Length
Some expressways in Montreal have an overlap in their names and numbering. Where this occurs, multiple names and numbers have been noted. Some expressway infrastructure beyond Montreal’s municipal boundary was included when municipal-level co-financing of such infrastructure was in evidence.
Expenditure
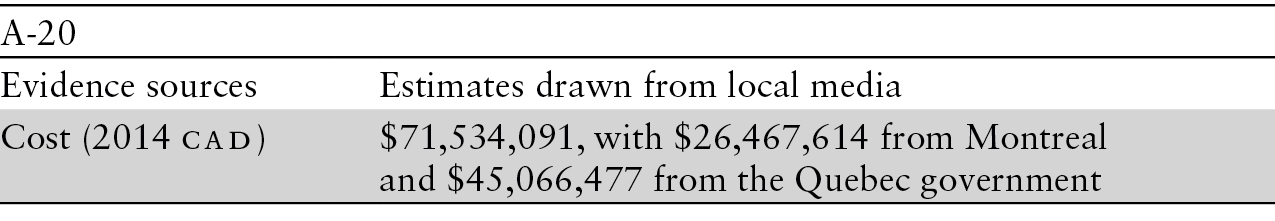
Capital expenditure on expressways was assessed in three ways. When it was specified in municipal or provincial budgets, actual costs for highway projects were extracted. If specific costs were not reported, but cost estimates were identified in annual reports on municipal or provincial transport infrastructure, these estimates were used. When neither actual nor estimated costs were available in government documents such as budgets and annual reports, then local media were used to estimate spending on expressway projects. Expenditure evidence and estimates were assembled only for the portions of expressways within the boundaries of pre-amalgamation Montreal.

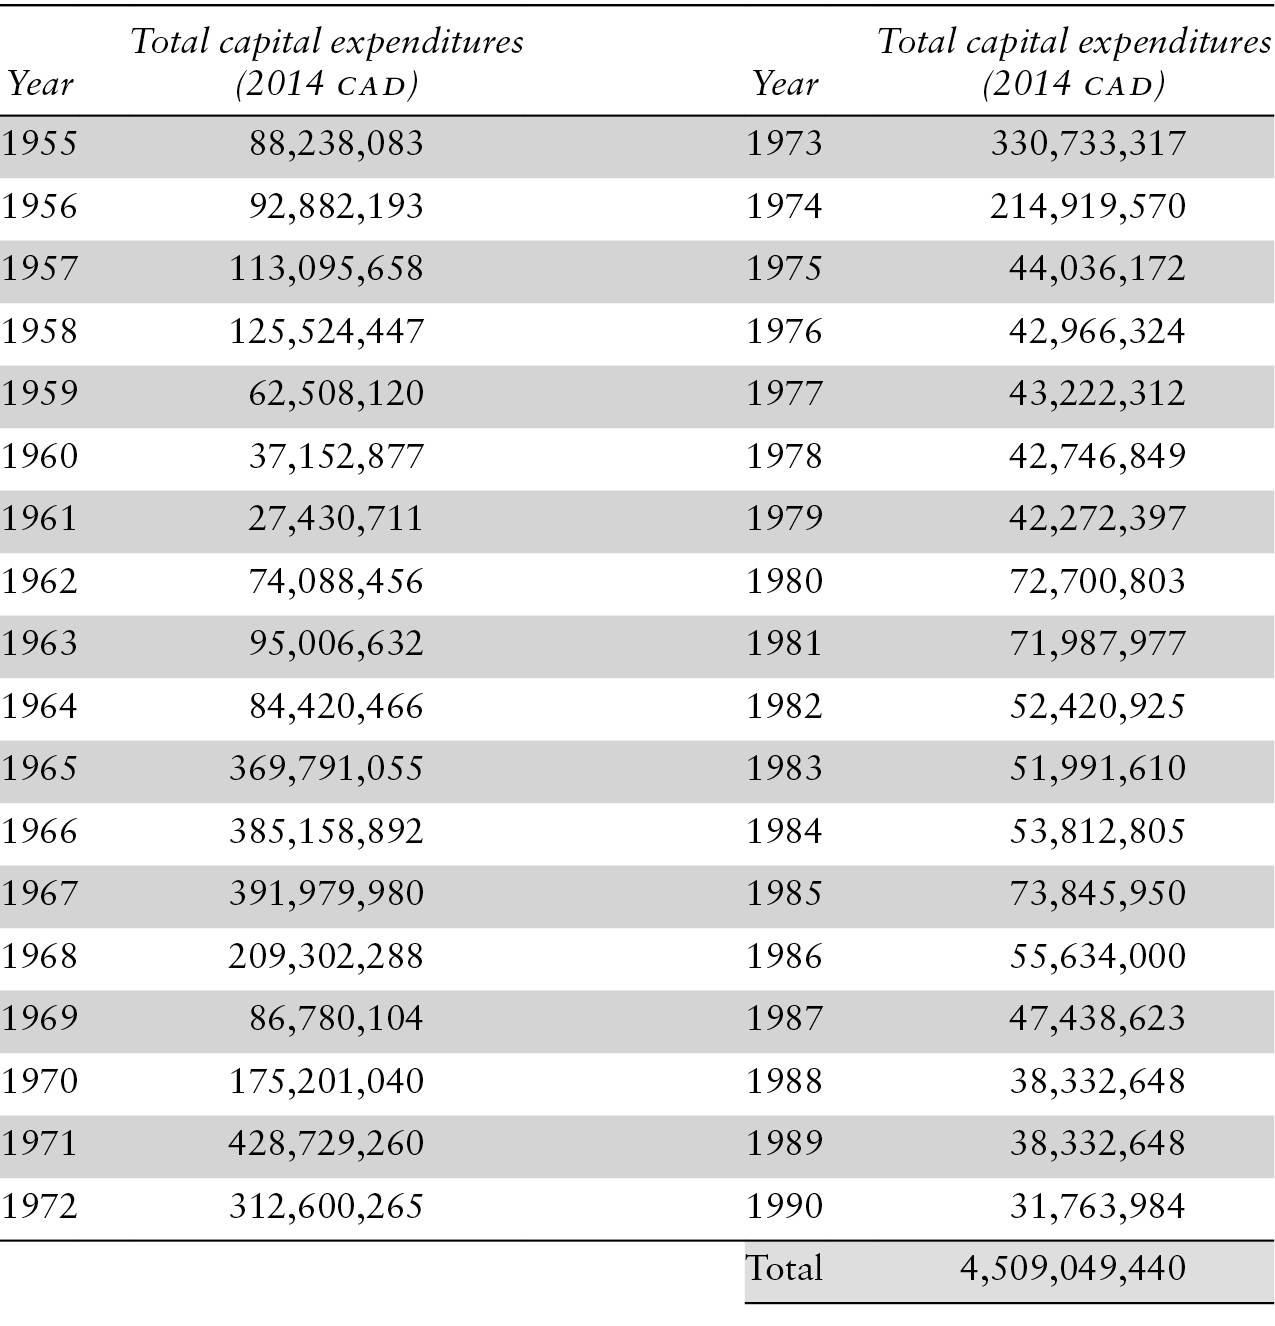
Capital Expenditures, 1955–90
RAPID TRANSIT
Measurements
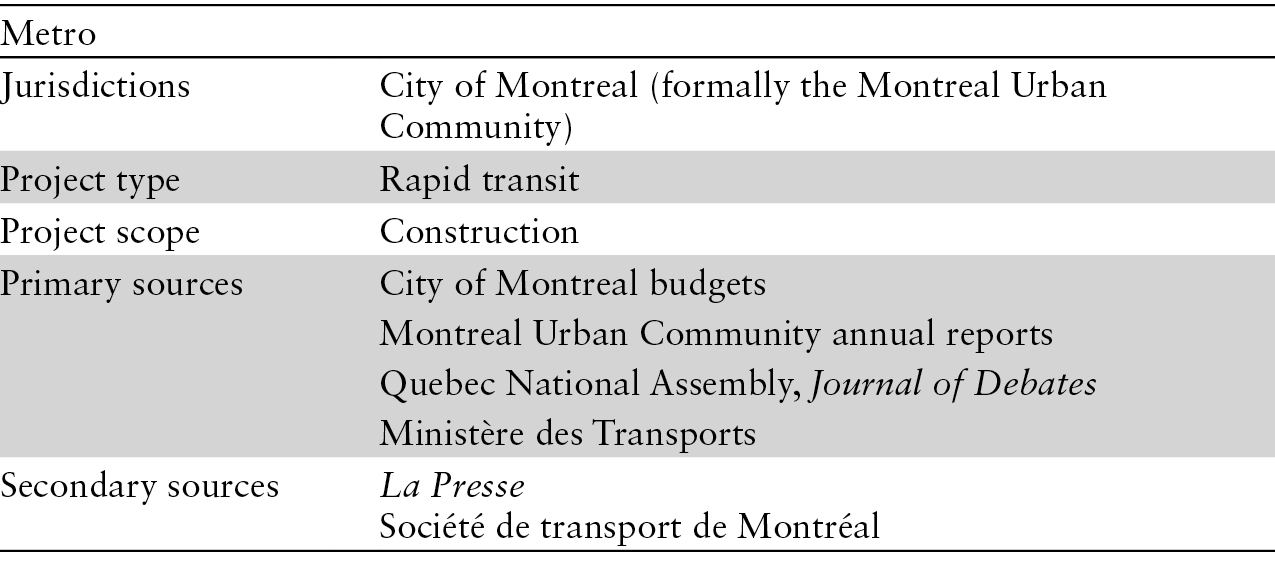
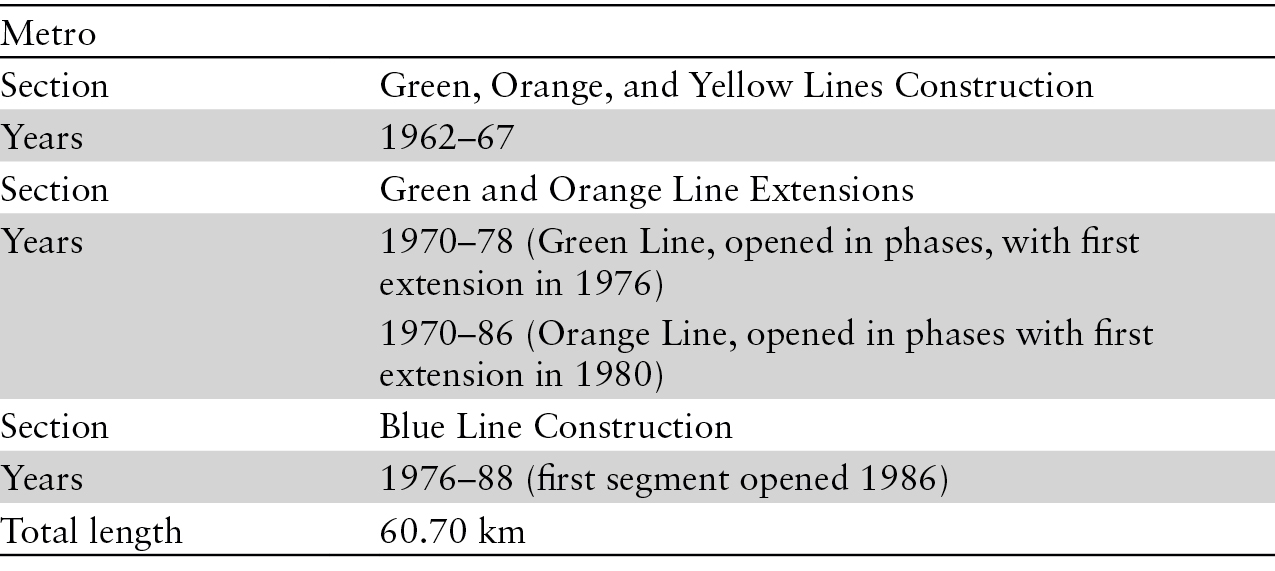
Measurements for the Montreal Metro system were taken in two steps. First, the City of Montreal’s Énoncé de l’intérêt patrimonial du Métro de Montréal was used to gather the overall length of each line. Next, station-to-station distances were calculated using Google Maps.
Limits, Gaps, and Notes
There has been considerable change in the funding sources of Metro construction over time. The Metro began in 1962 under a municipal financing, but within two decades this infrastructure was entirely funded by the Province. The fiscal shift occurred incrementally and on an ad hoc basis, with no consolidated record of capital investment as a result.
Starting in 1971, the Province supported capital spending on Metro construction through transfers and credits to the MUC, but the MUC remained responsible for building the Metro until the late 1980s. After amalgamation in 2002–3, the Province designated AMT as the agency responsible for building the Orange Line extension to Laval.
In 1976, Quebec’s Liberal government imposed a moratorium on Metro construction. The same government soon lifted the moratorium with a new cost-sharing agreement in place between Montreal and the Province. In this agreement the Province agreed to refund 60% of previously incurred construction costs and to fund 60% of future construction costs. Shortly after the election of the Parti Québécois in 1976, the Province increased its commitment for future Metro construction costs to 100%.
Overview
Physical Characteristics
Expenditure

Capital Expenditures, 1955–90
Even though MUC has reported capital expenditure on rapid-transit infrastructure yearly through at least 2011, we have opted to include only the yearly expenditures through 1990 in our data set because the last linear extension of the Blue Line rapid transit occurred in 1988. Given the fluidity of intergovernmental financing of urban mobility infrastructure in Quebec, it is possible that capital funding up to 1990 was used to pay for this linear extension. Subsequent capital expenditures can be deemed to have not contributed to the linear expansion of rapid-transit infrastructure until the Orange Line’s extension to Laval in 2002.

Toronto
POPULATION
Population data for the Municipality of Metropolitan Toronto between 1951 and 1966 were obtained from Internet Archive (2014a) by aggregating the populations for each municipality within Metropolitan Toronto. From 1966 to 1976, population figures were obtained from Internet Archive (2014b) for both incorporated and unincorporated municipalities within Metropolitan Toronto. From 1976 to 1985, data were obtained from CANSIM, table 051-0030 (Statistics Canada 2000), which uses 1981 census boundaries. For 1986 to 2002, CANSIM, table 051-0016 (Statistics Canada 2003), was used. This table uses 1996 census boundaries. For the years 2003 to 2013, CANSIM, table 051-0052 (Statistics Canada 2013c), was used.
MUNICIPAL BOUNDARIES
The Municipality of Metropolitan Toronto was established in 1953 and included “the City of Toronto, the townships of East York, Etobicoke, North York, Scarborough and York as well as seven villages and towns that had been separated from these townships over time.” In 1966, Metropolitan Toronto was reorganized from thirteen municipalities into six (Gartner 1991). In 1998, metropolitan government was abolished and replaced by the amalgamated City of Toronto (Government of Ontario 2015). The Municipality of Metropolitan Toronto’s boundaries were used for our data collection as they are identical to the current boundaries of the City of Toronto (Government of Ontario 2015).
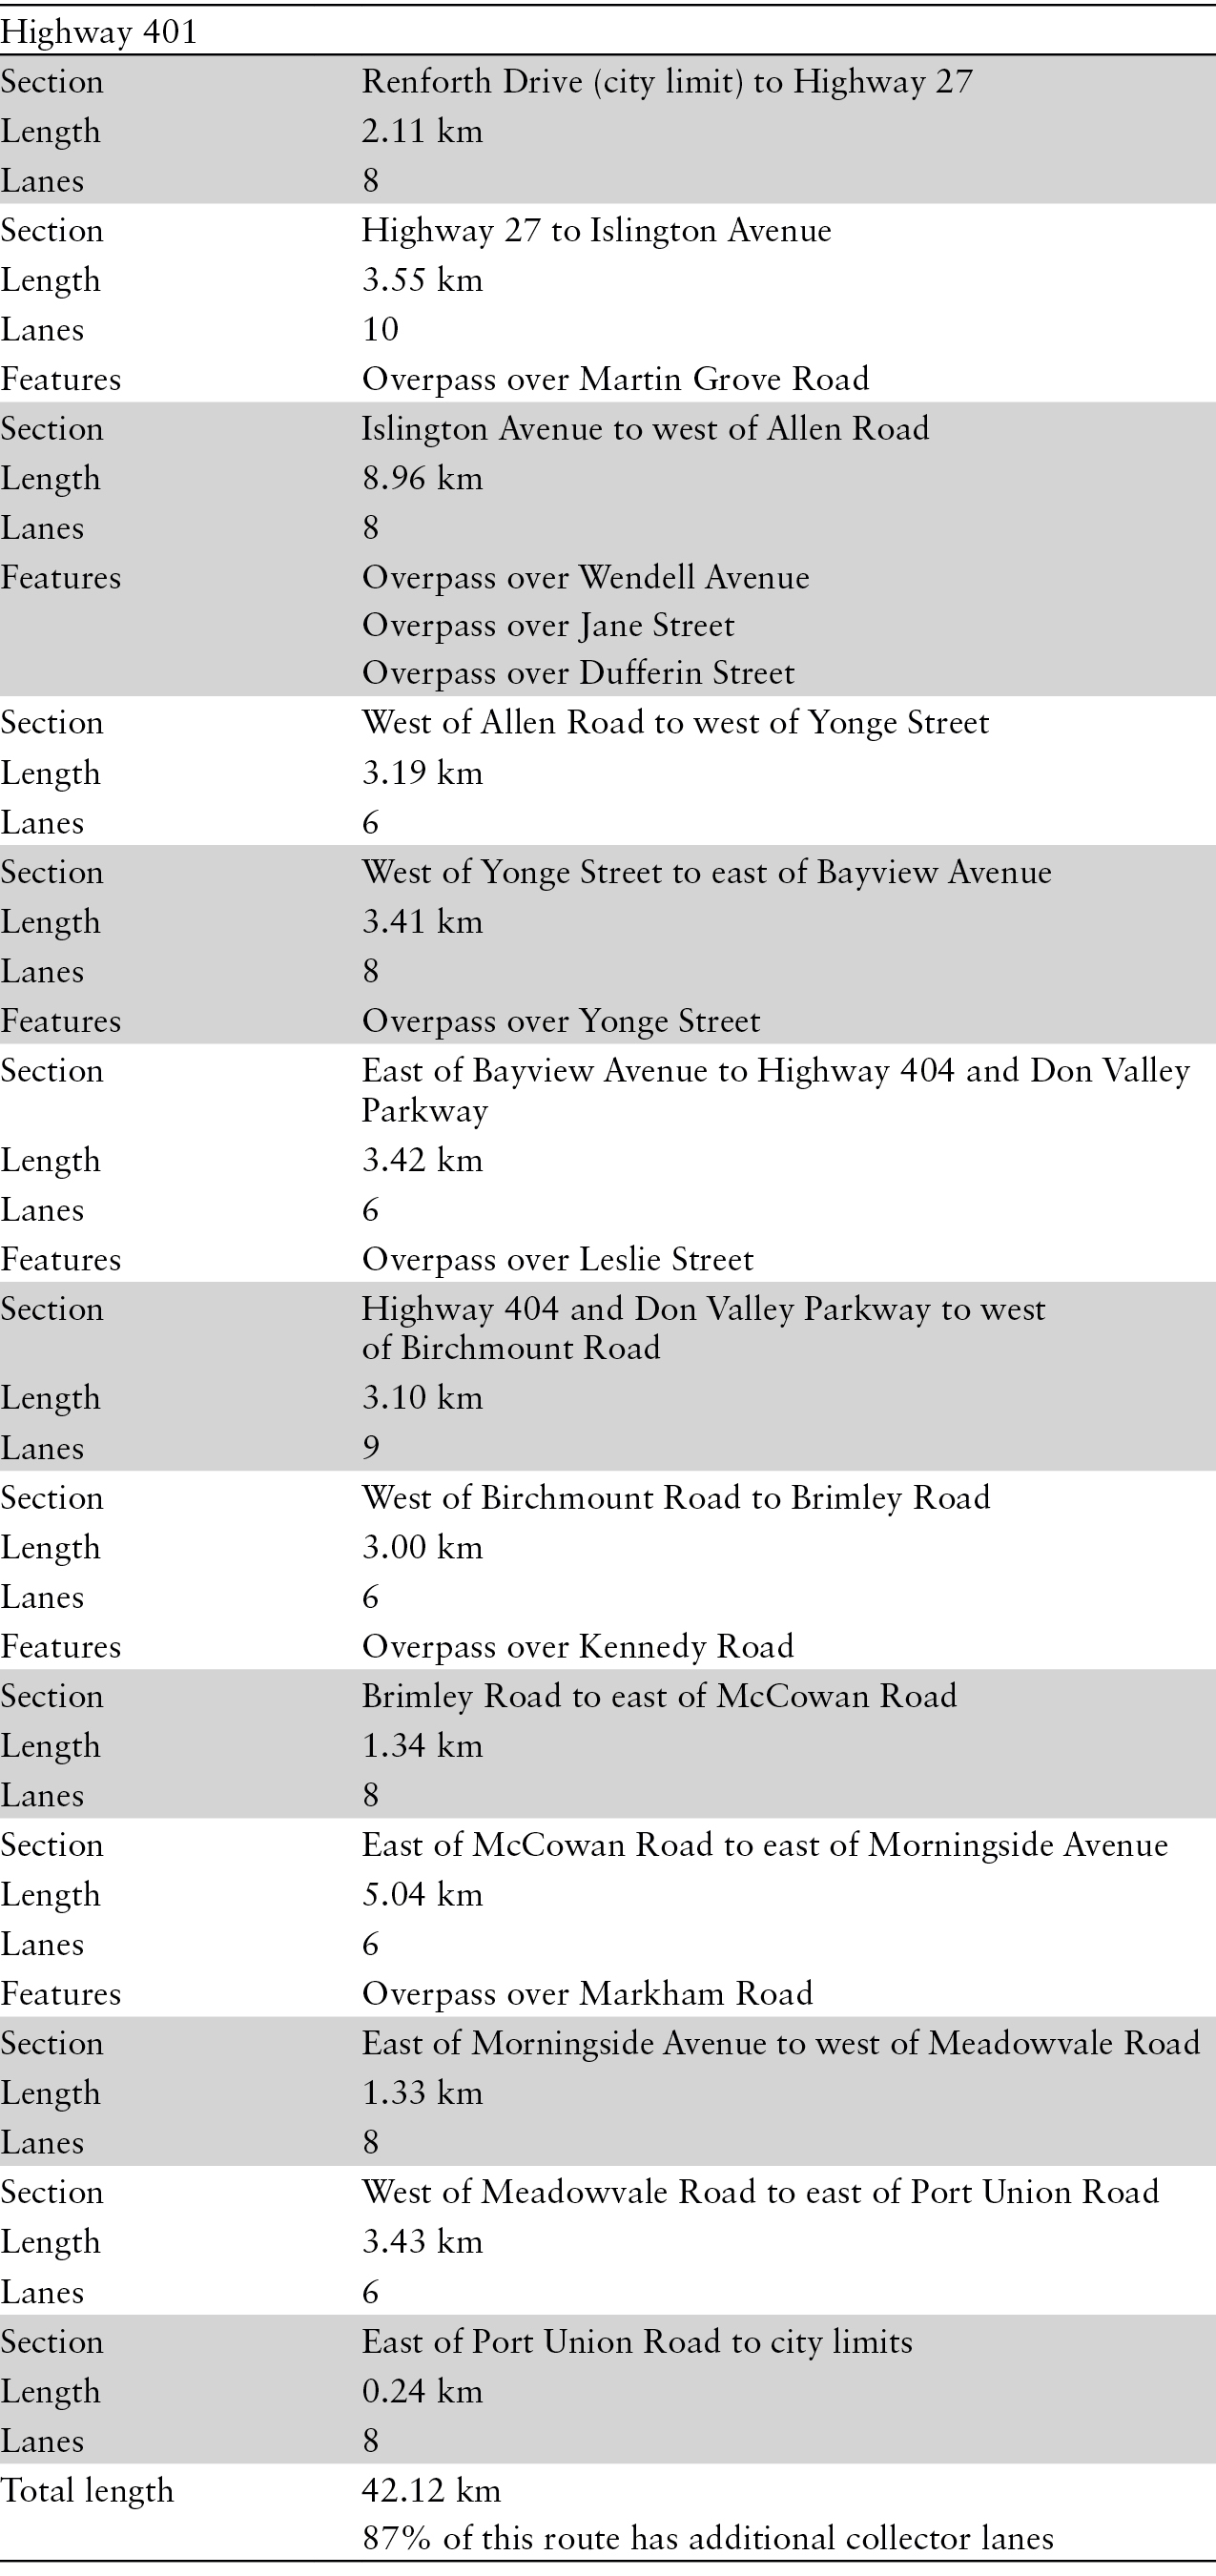
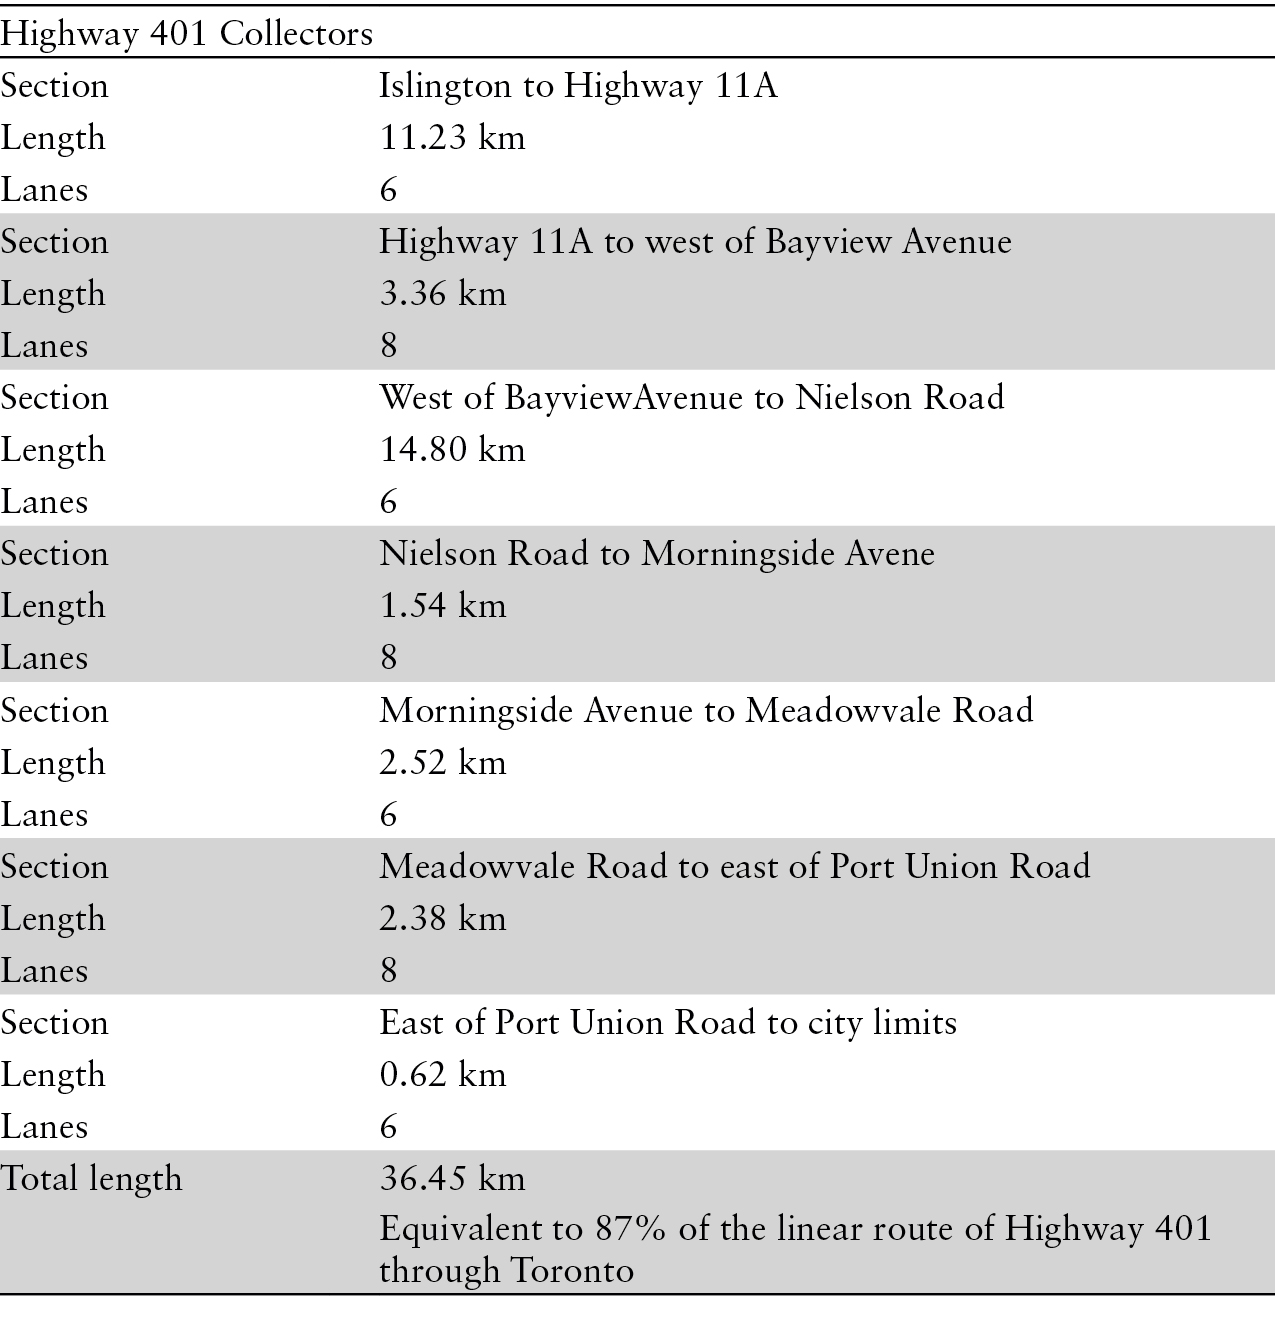
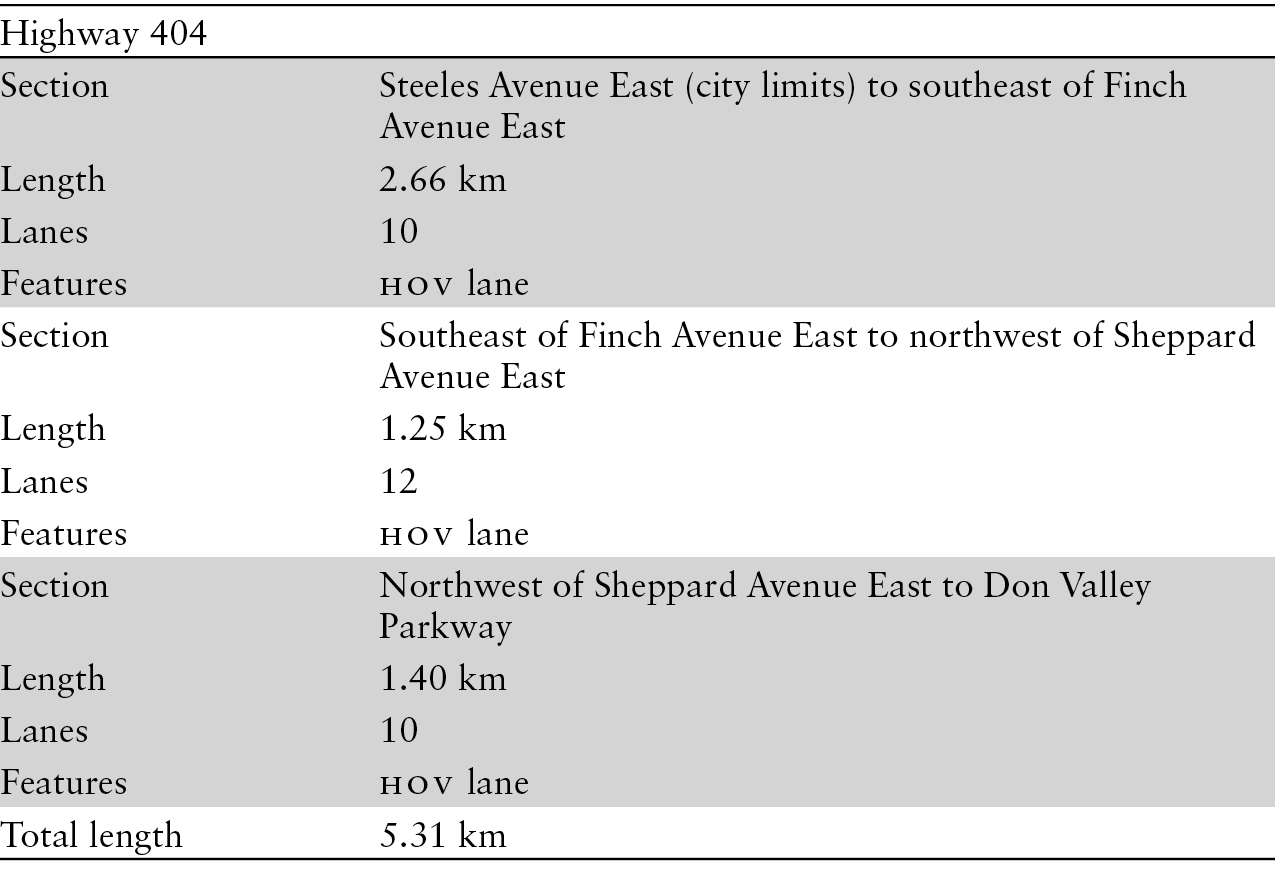
EXPRESSWAYS
Length Measurement
Expressway data were collected using Google Earth’s line tool. A line was overlaid on the expressways, following their routes through the study area. Start and end points for each expressway are identified in the listings.
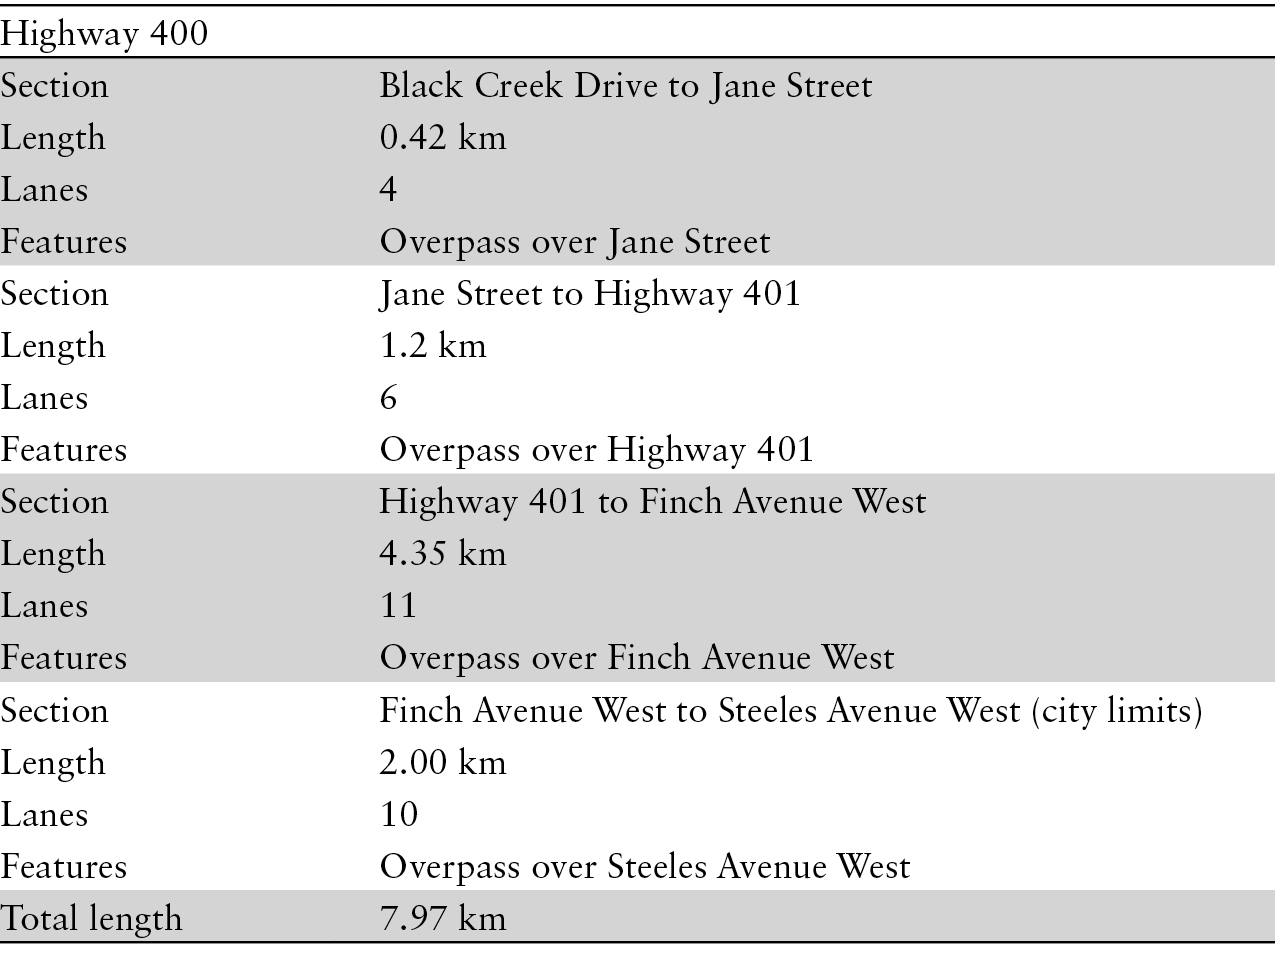
Each expressway was also divided into segments based upon width. These segments were used to identify the number of lanes present. Again, this was done using Google Earth. Merge lanes were not included in the lane calculations. The collector and feeder lanes on Highway 401 were measured separately from the highway proper, using the same techniques. If a new lane came into existence between intersections, the start and the end point of that lane was deemed to be the start and the end of the segment. For those lanes that began or ended at an intersection, the midpoint of the intersection was used to define the start or end of the segment. Determination of the number of lanes was completed by examining the satellite imagery provided within Google Earth, which shows the lanes in use and enabled the exclusion of shoulders. All Google Earth imagery used in these measurements was dated 2015.
Limits, Gaps, and Notes
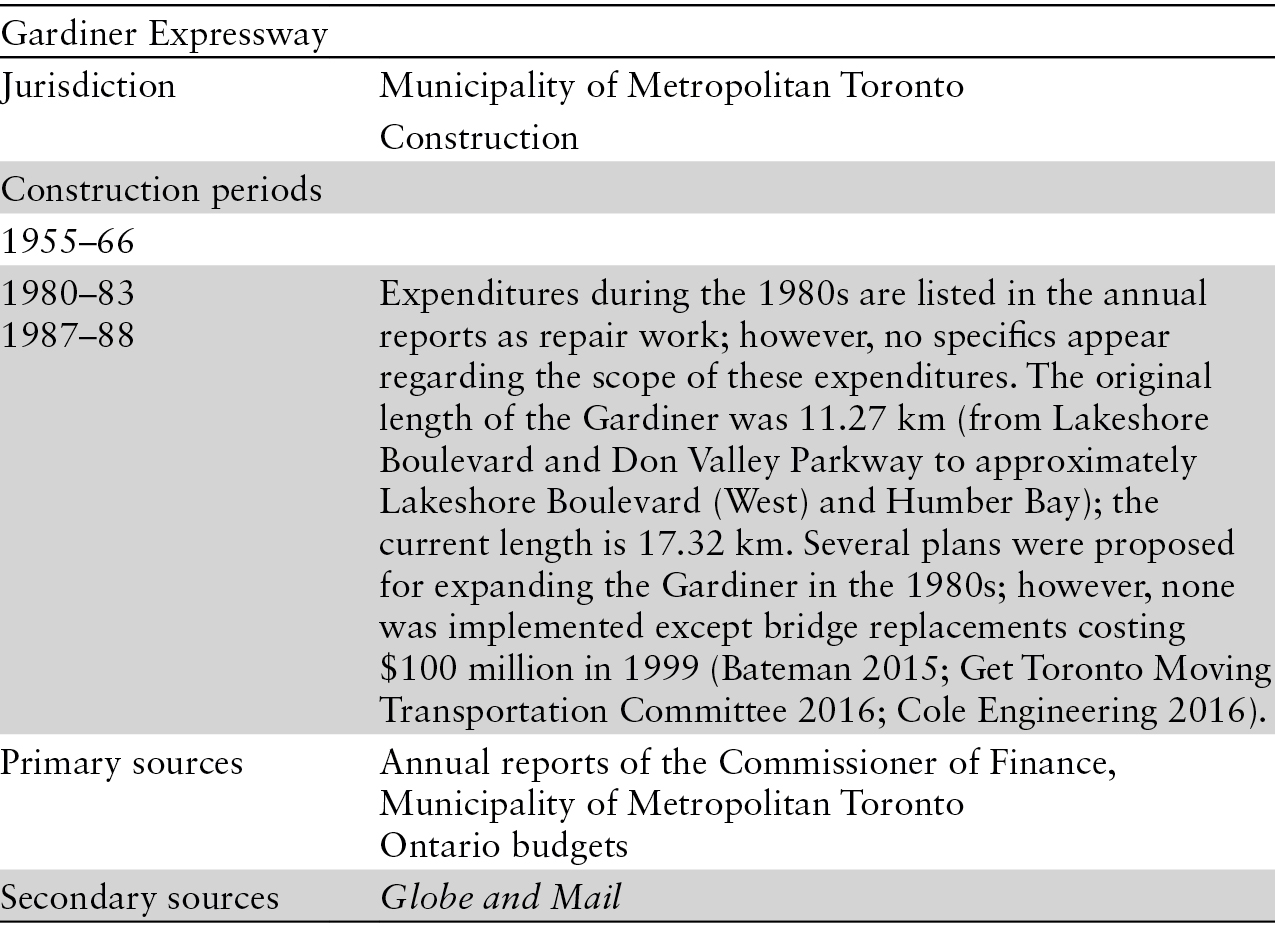
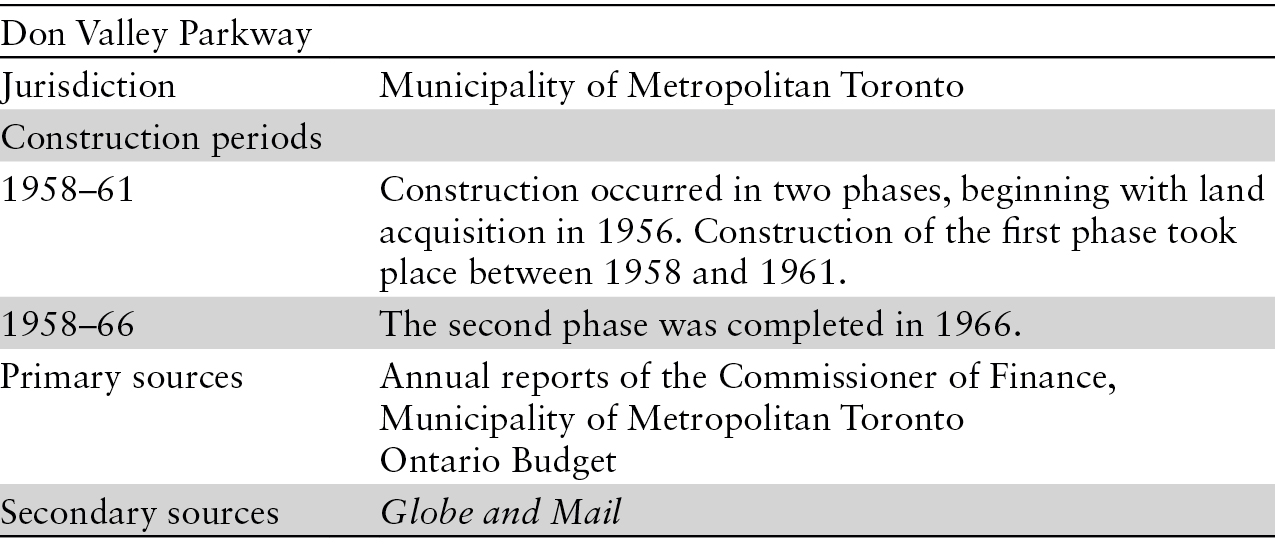
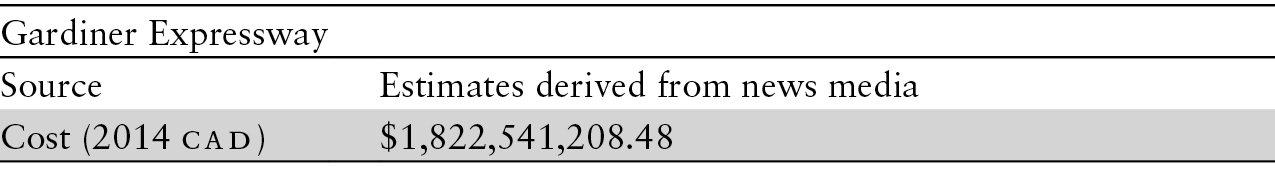
Expressway spending in the municipality of Metropolitan Toronto peaked in the 1960s, aligning with the construction of both the Gardiner Expressway and the Don Valley Parkway. Expressway spending was primarily funded through municipal and provincial contributions, with occasional and minor contributions from other entities. However, the contribution of each entity toward the total cost of infrastructure is not always clear.
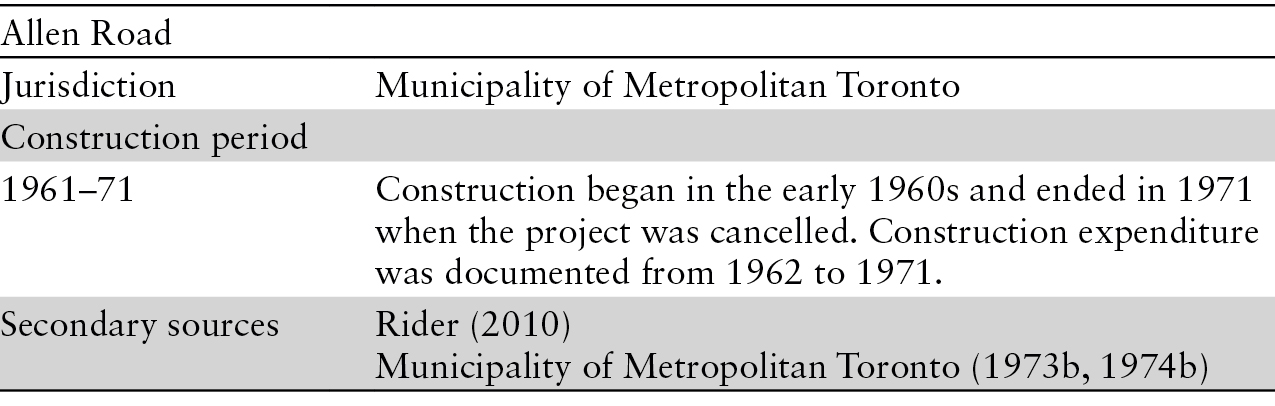
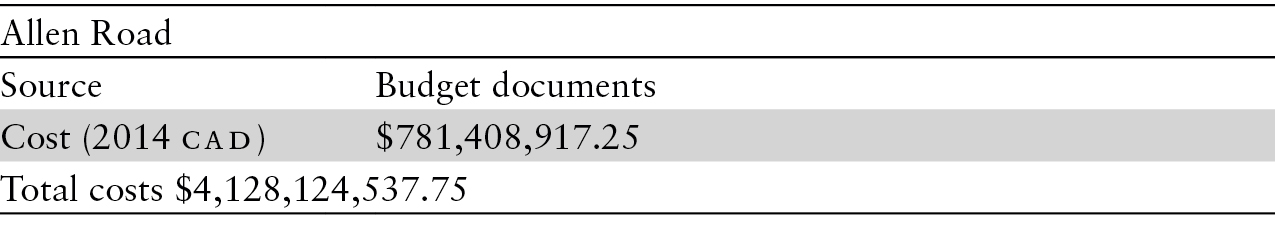
The 400 series of expressways were provincially planned and funded infrastructure projects, and the Gardiner Expressway, Don Valley Parkway, and the Allen Road expressway were planned and managed by municipal government. After 1984, capital spending on expressways was no longer itemized in annual reports of municipal government. However, no linear extension to Toronto expressways occurred following this date.
Overview

Physical Characteristics


Expenditure
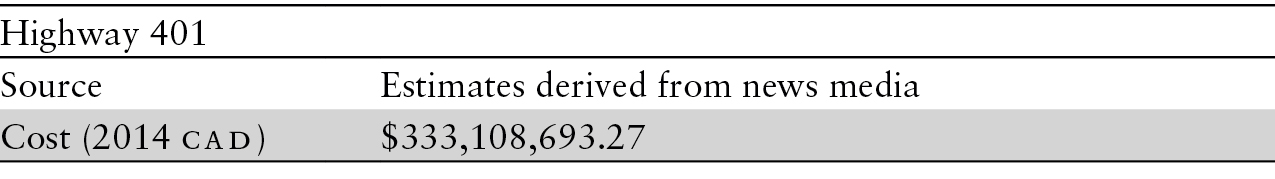
CALCULATIONS Expressway costs have been estimated, unless otherwise noted, due to incomplete information provided in annual reports and budgets on specific projects. The annual reports and budgets provided aggregated spending on capital programs for roads and expressways without giving the specific project details that would be needed to isolate the component that was allocated to funding expressway infrastructure extension. Therefore, local media, primarily the Globe and Mail, were used to inform project cost estimates based upon reports of expenditure at times of expressway construction and opening or expansion.
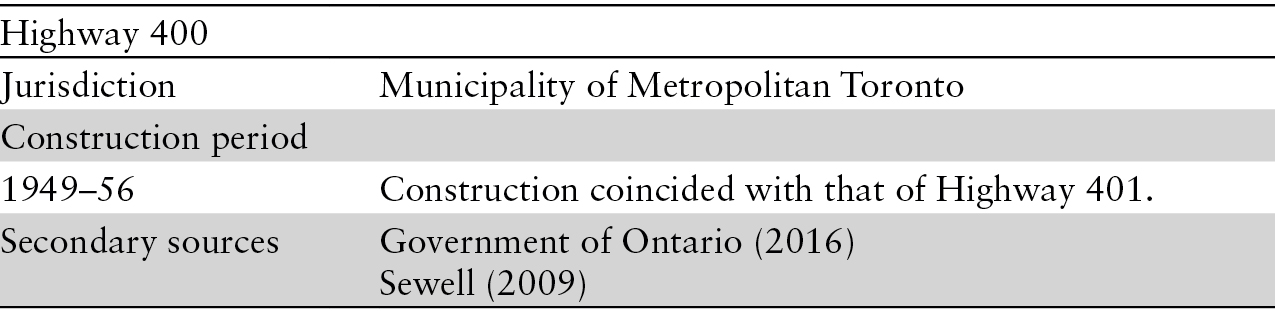
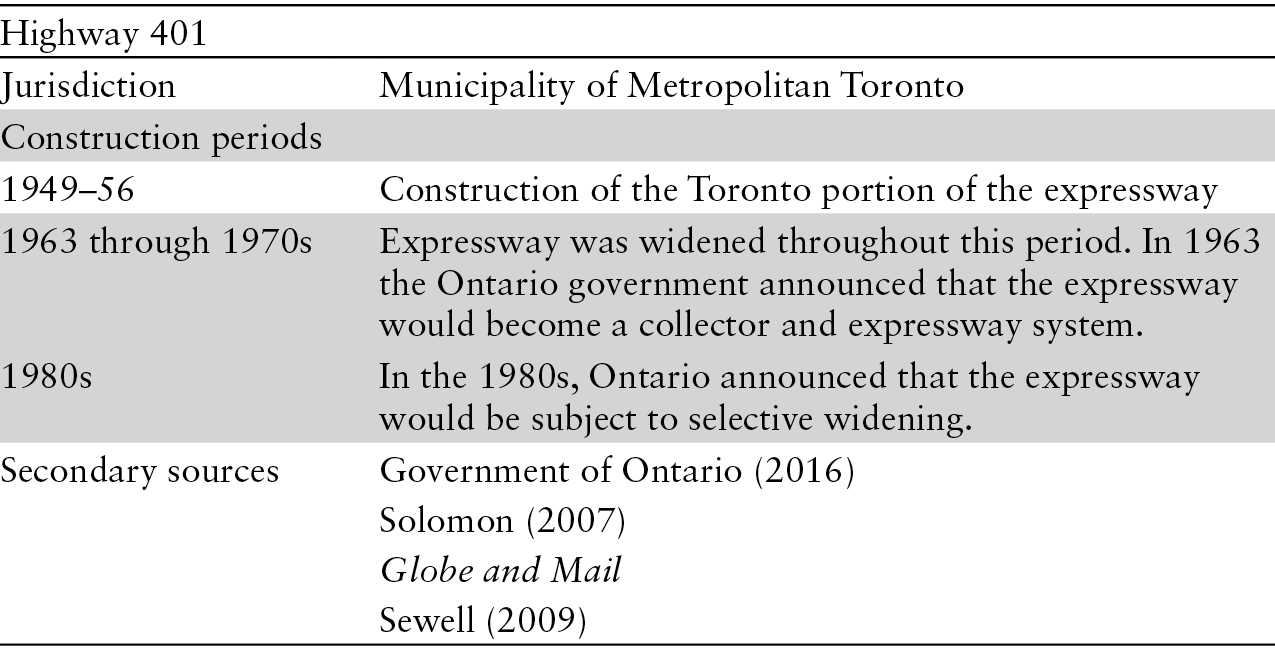
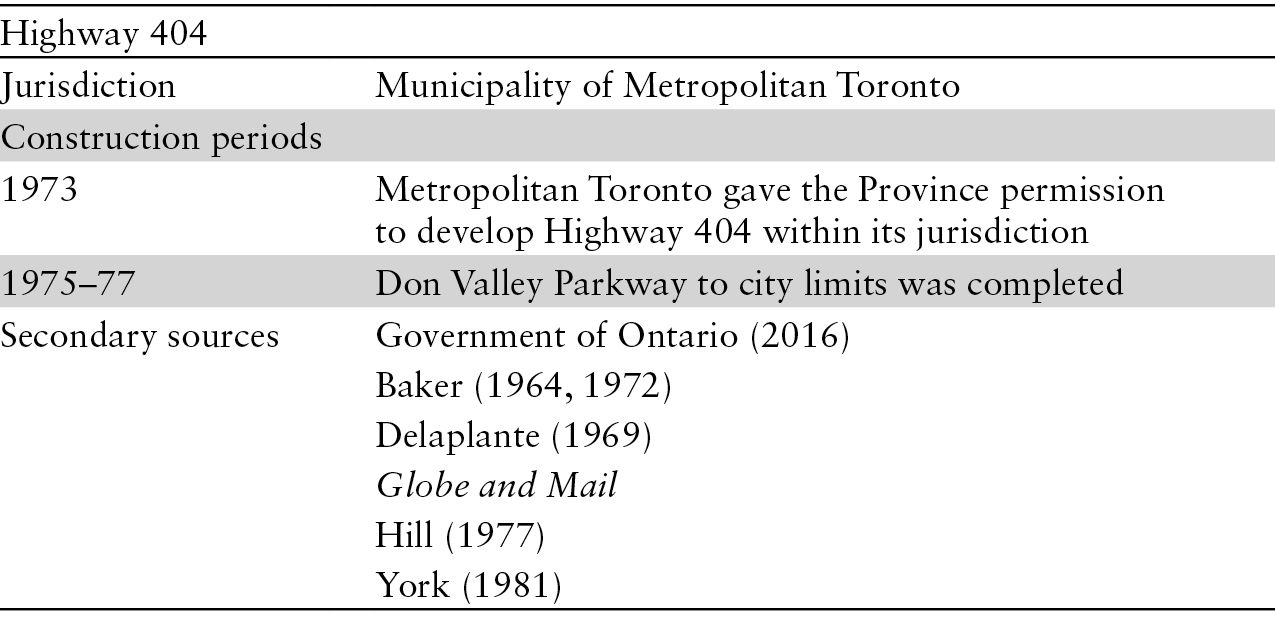
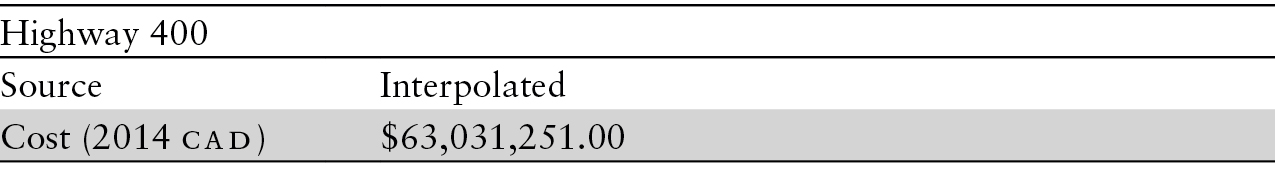
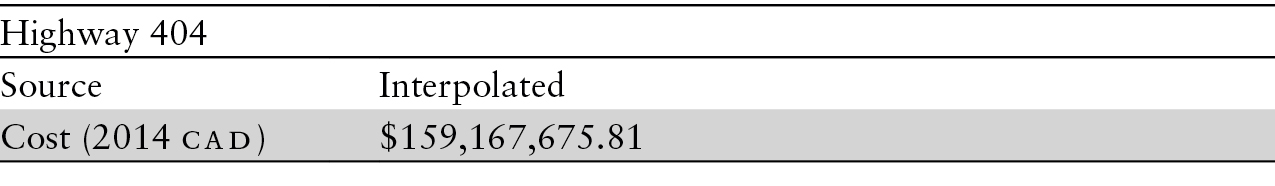
TIME FRAME The time frame for investment in new expressways (defined as those extending over a longer distance, rather than having their width or vehicular capacity enhanced) runs from 1949 to 1983. This period begins with the construction of Highways 400 and 401 and ends six years later following the completion of Highway 404 within the then boundary of Metropolitan Toronto.
FUNDING SOURCES Funding for Toronto’s expressways came from three sources. The first was the Government of Ontario. Second in total spending was the Municipality of Metropolitan Toronto, and the third and smallest funding source was the federal government’s Grade Crossing Fund and Canadian National Railways.

Capital Expenditures, 1949–77

The preceding figures represent yearly capital expenditure totals within the Municipality of Metropolitan Toronto on expressways. They are derived from three sources: the Province of Ontario, Metropolitan Toronto, and third parties.
Each year consists of the outlays derived from the annual reports of Metropolitan Toronto with the following exceptions:
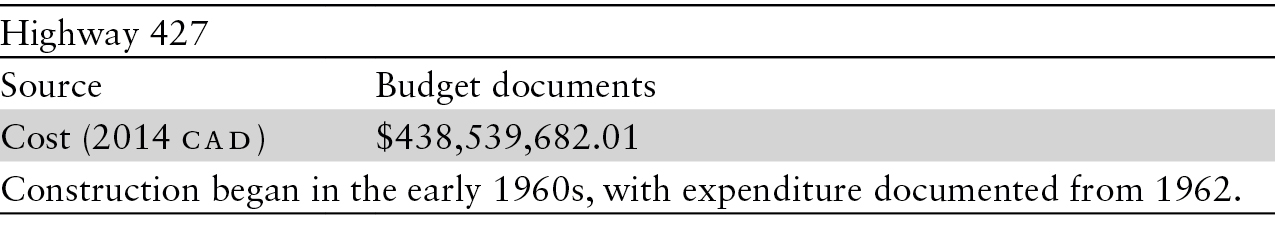
1 1949–55 figures are derived from interpolated spending on Highways 400, 401, and 427 (1955 only), Don Valley Parkway (1953–55), and the Gardiner Expressway (1950–55). For Highways 400 and 401 the yearly outlays were calculated by dividing the construction costs equally over the eight years of their construction.
2 1968–71 are derived from Metropolitan Toronto Transportation Plan Review: Transportation Finance, 1962–1981, and the Transportation Finance, part 2, History of Transportation Finance in Metro, 1961–1971. These reports indicate greater spending within the period than was identified in the annual reports of Metropolitan Toronto. To determine the share of funding coming from Ontario versus Metropolitan Toronto, we applied the ratio listed in the annual reports to the amounts in the finance reports of the planning and history of transportation.
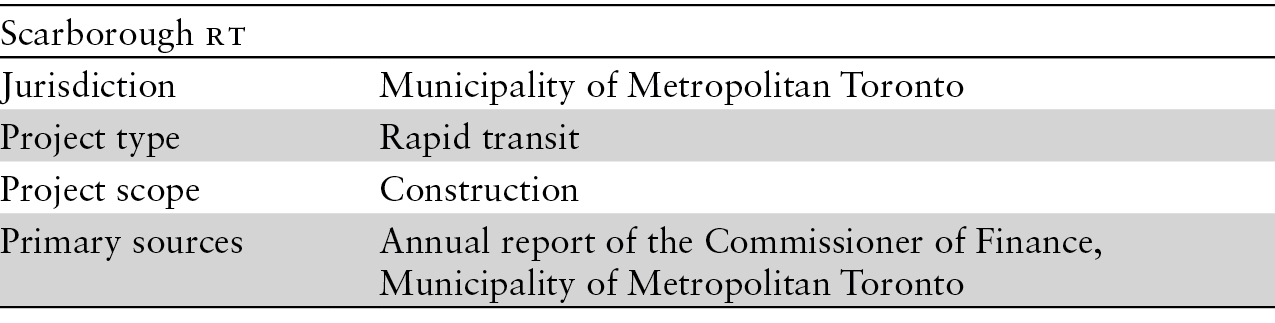
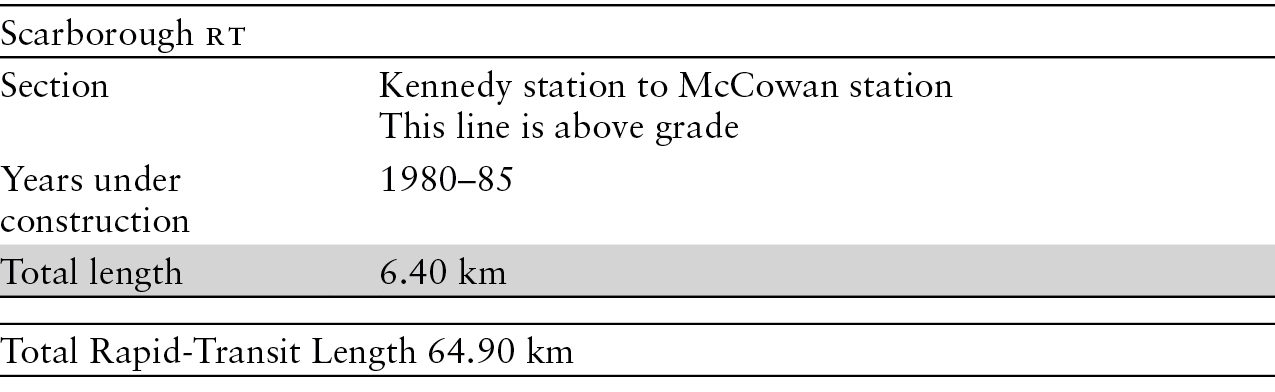
RAPID TRANSIT
Measurements
The length of most rapid-transit infrastructure was obtained from 2013 TTC Operating Statistics (Toronto Transit Commission 2016b). The originating and terminus stations for each linear extension of rapid transit was confirmed using Transit Toronto’s history of each line, in addition to news media. Opening dates of the subway lines and their subsequent extensions were confirmed on the TTC’s website (Toronto Transit Commission 2015b).
Limits, Gaps, and Notes
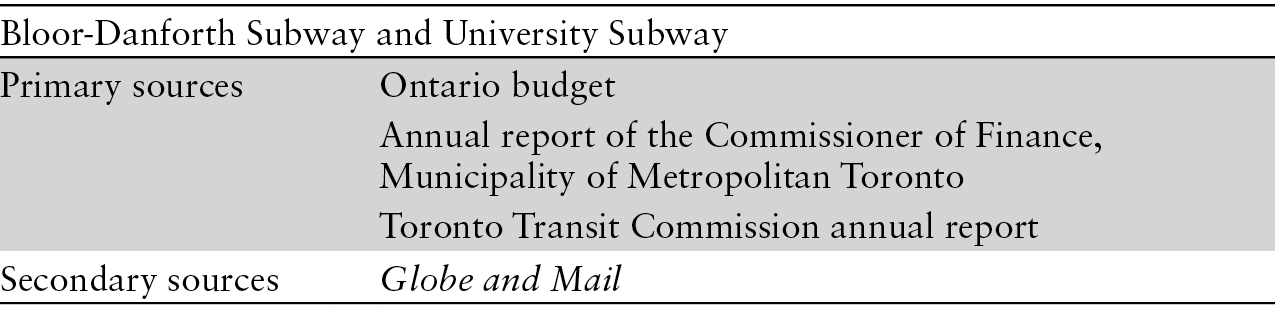
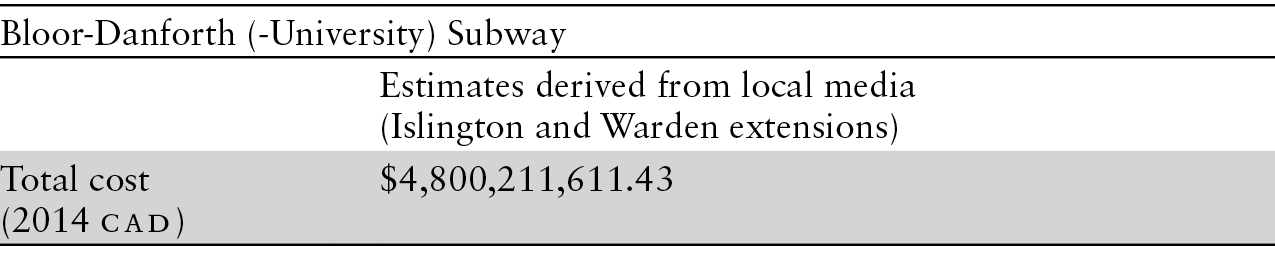
The Toronto Transit Commission issued debentures to fund certain segments of rapid-transit infrastructure. This was subsequently eliminated as a method of funding rapid-transit projects, and by 1992 the debt incurred through these debentures had been retired. In 1964 the level of TTC debenture debt dropped by $385,254,637.50 when right-of-way debt for the Bloor- Danforth subway route was transferred to Metropolitan Toronto.
After 1981 the TTC no longer made any capital expenditure to build rapid-transit infrastructure. All capital expenditure came from Metropolitan Toronto and the Ontario government. However, it is not always clear how much each entity provided toward the total project costs.
Metropolitan Toronto instituted a special levy, equating to 2%–3% on the property tax, to help fund rapid-transit projects between 1959 and 1981. Prior to 1962 this levy also provided capital for road construction.
Overview
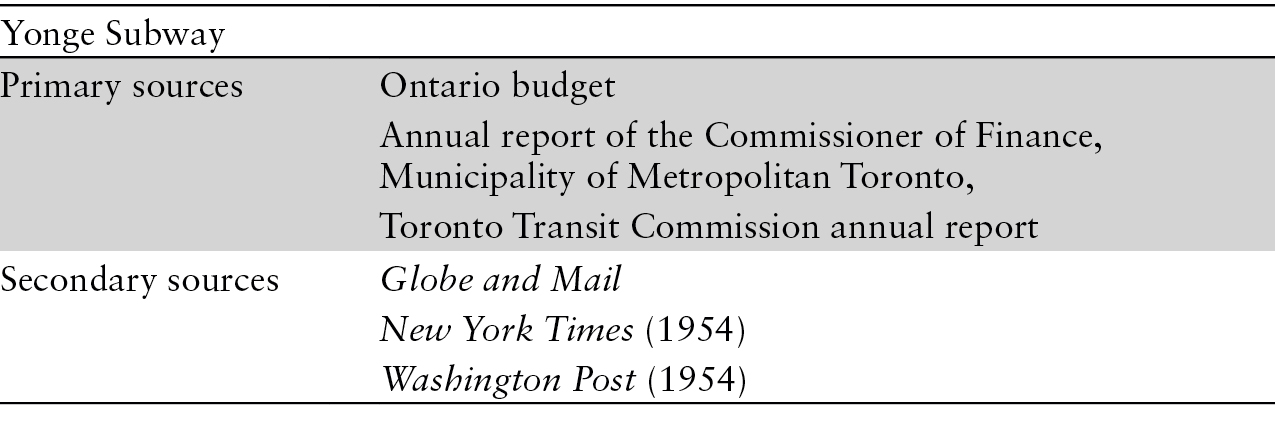
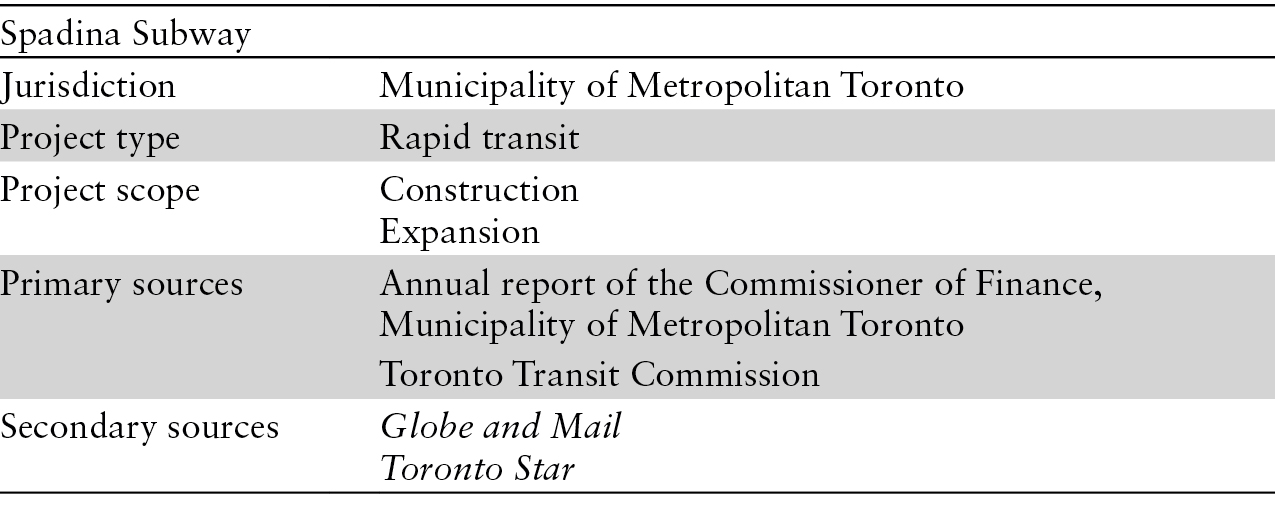
In yet another example of urban equivocation, the names of Toronto’s rapid-transit lines shifted multiple times during our data-collection period. As different segments were connected to one another, names were changed; for example, the University subway was built separately from both the Yonge and the Spadina subway segments, but these were eventually merged into one name. We identify the name of the rapid-transit line that was in use for the data being described or referenced in the listings. Currently Toronto’s rapid-transit lines are numbered, and the names are thus a historical artifact.
Physical Characteristics


Expenditure
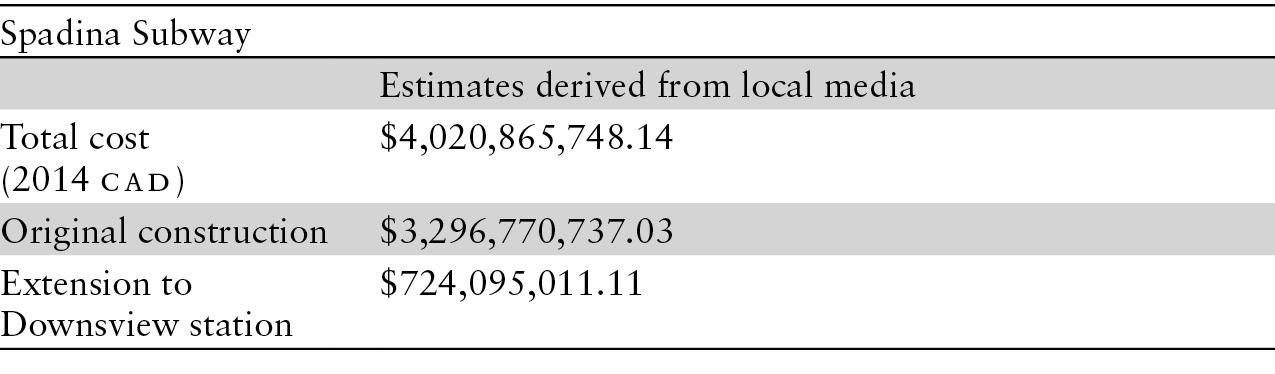
CALCULATIONS Specific capital costs for infrastructure are not identified in the annual reports; therefore, local media, primarily the Globe and Mail, were used to estimate the construction costs of these lines and their extensions, unless otherwise noted.
TIME FRAME Construction of the Yonge subway began in 1949. Rapid-transit extension continued through 2001, aligning with this study’s time frame. Outside of our analytical time frame, the Sheppard subway was opened in November 2002.
FUNDING SOURCES Toronto’s rapid-transit-infrastructure funding came primarily from the Municipality of Metropolitan Toronto and the TTC during the 1970s. After 1981, however, the TTC no longer contributed capital funding to infrastructure-construction projects, and the Municipality of Metropolitan Toronto became the primary funding source. The federal and provincial governments also funded specific rapid-transit-infrastructure projects from the 1970s onward.
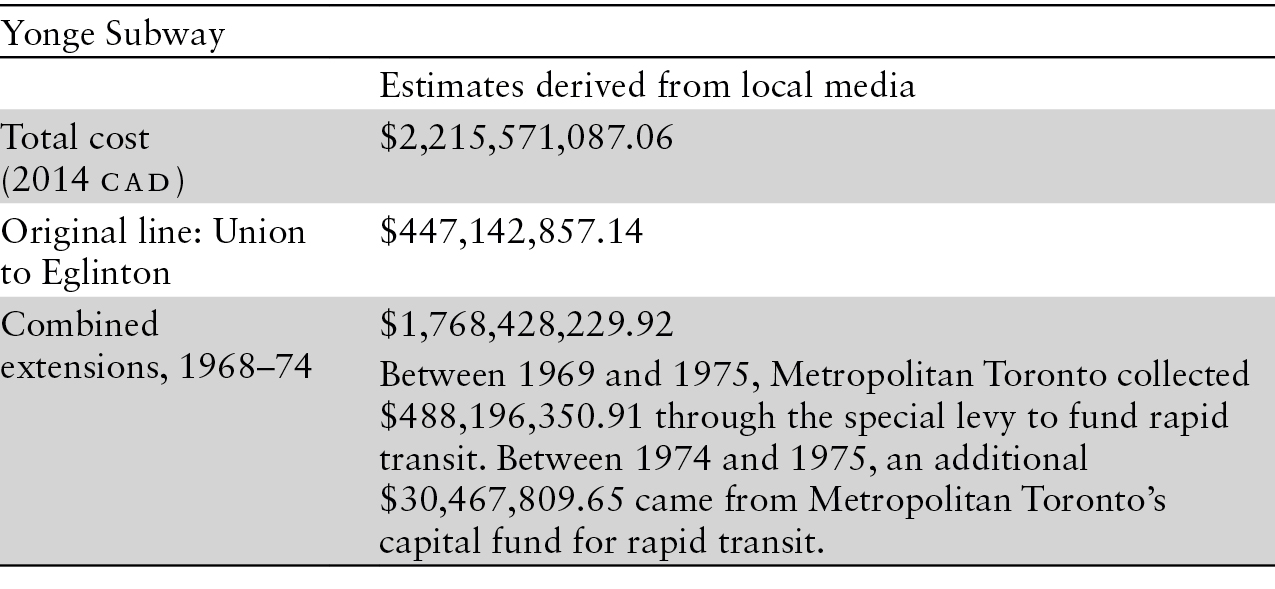


Capital Expenditures, 1949–96

Total capital expenditures on rapid transit were calculated from the annual reports of both the Municipality of Metropolitan Toronto and the TTC. For each year they reflect total expended by both funders with the following exceptions:
1 From 1949 to 1954 the cost of the original Yonge subway line was divided evenly over each year of construction.
2 Between 1993 and 1996, expenditure on the Spadina subway line extension to Downsview station was spread evenly over the project’s construction years.
Vancouver
POPULATION
The population of Vancouver was calculated for the years 1976–85 based upon the city’s 1981 census boundary within the Greater Vancouver Regional District (GVRD). For 1986 to 2014 the GVRD was defined on the BC Stats website and closely aligns with the Local Health Areas (Government of British Columbia, n.d.). The GVRD populations in 1956, 1961, and 1971 are for the metropolitan area definitions according to the respective census years.
The population of Vancouver city declined from 1971 to 1976. From 1986 to 2014 the figures for the City of Vancouver relate to the Vancouver Local Health Area, for which each year’s population is recorded. These data are all a little higher in the actual census year data for the city in 1986, 1991, 1996, 2001, 2006, and 2011. The official census populations between 1986 and 2014 for the City of Vancouver were obtained in census years. The growth rate in population from year to year relates to that of the Local Health Area to give a better estimate for the city in the inter-census years.
MUNICIPAL BOUNDARIES
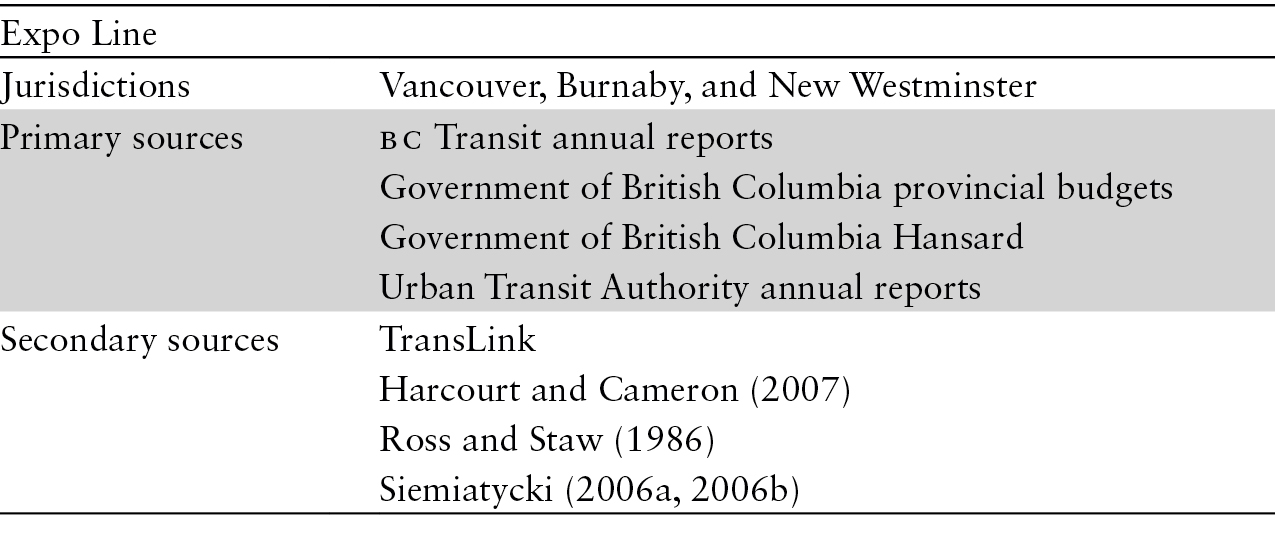
The study area for Vancouver’s urban mobility infrastructure comprises the combined municipalities of Vancouver, Burnaby, and New Westminster. In 2007 the GVRD was renamed Metro Vancouver and represents twenty-one municipalities (including Vancouver, Burnaby, and New Westminster) along with an Electoral Area and one Treaty First Nation (Metro Vancouver, n.d.). TransLink, Metro Vancouver’s transportation authority, was formed in 1998 and given responsibility for the major road network, public transit, and transportation planning within Metro Vancouver (including the three municipalities within this study (TransLink 2016b).
EXPRESSWAYS
Length Measurement
Expressways were measured using Google Earth’s line tool. A line was overlaid on the expressways, following their routes through the study area. Each expressway was also divided into segments based upon width. These segments were used to identify the number of lanes present. Again, this was done using Google Earth. Merge lanes were not included in the lane calculations. If a new lane came into existence between intersections, the start and end point of that lane was deemed to be the start and end of the segment. For those lanes that began or ended at an intersection, the midpoint of the intersection was used to define the start or end of the segment. Determination of the number of lanes was completed by examining the satellite imagery provided within Google Earth, which shows the lanes in use and allows for exclusion of the shoulders.
Primary measurements were taken from 23 to 27 May 2016, a second set of measurements was completed from 7 to 9 June, and a final measurement was taken on 14 June 2016. All Google Earth imagery is dated 2015.
Limits, Gaps, and Notes
Early spending on expressways in British Columbia is difficult to determine because the provincial government did not identify spending on specific sections of road-infrastructure projects. Capital expenditure is reported in aggregate for road construction across the province. For example, in 1949 the Government of Canada’s Trans-Canada Highway Act created a cost-share program between the federal and provincial governments to build the Trans-Canada Highway. Provincial governments began accessing this fund in 1950 (Government of Canada 2012). In the 1950 provincial budget this cost-sharing program appeared as a borrowing limit of $5 million of which British Columbia used approximately half to fund the Trans-Canada Highway infrastructure. However, specific infrastructure segments built with this funding were not identified (Government of British Columbia 1950). In 1990 the Government of British Columbia created the Freedom to Move special account, which provided $3.5 billion over five years to fund new mobility-infrastructure projects (Government of British Columbia 1990). Then in 1993 the BC Transportation Financing Authority was created to fund expressways, bridges, and roads (Government of British Columbia 1993). In 1998 the Government of British Columbia announced that it would be adding new HOV lanes to the Trans-Canada Highway in Burnaby (Government of British Columbia 1998).
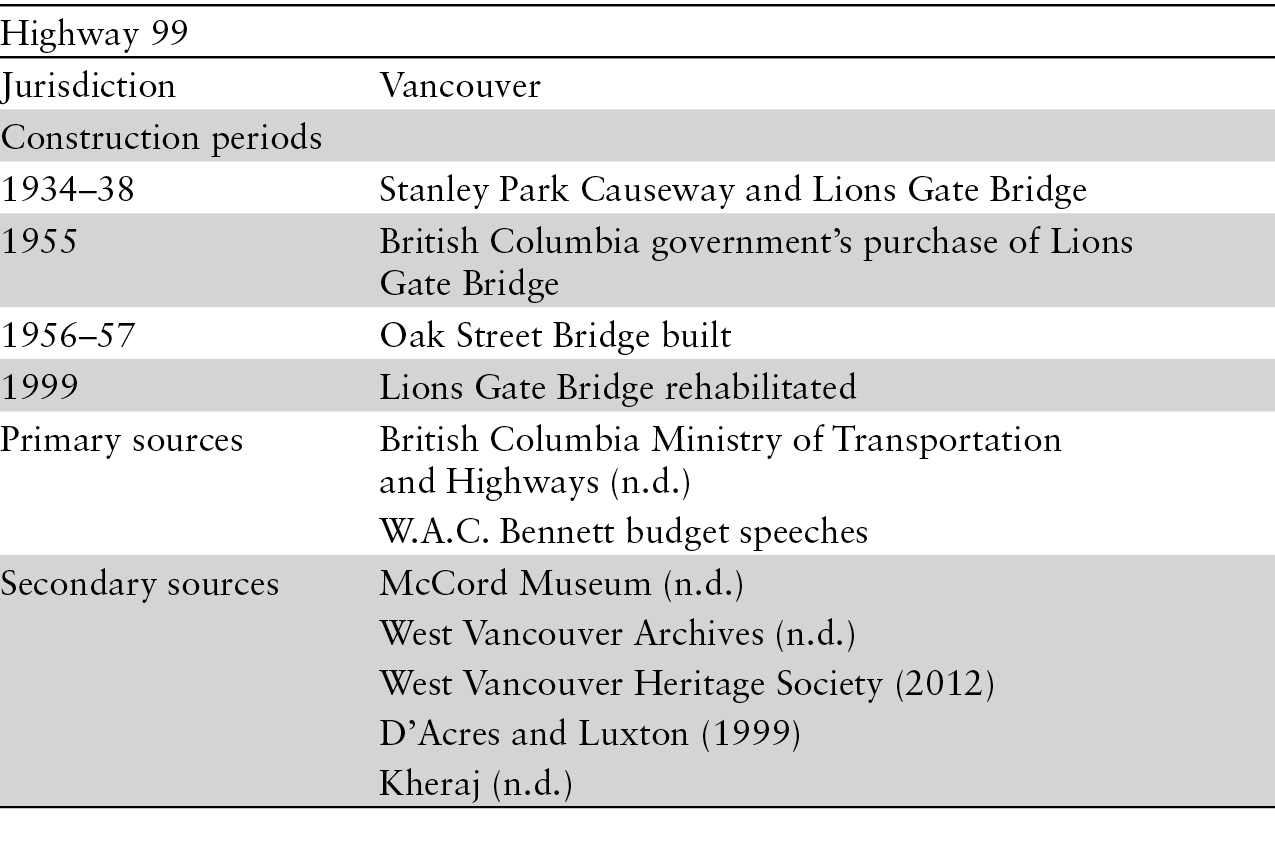
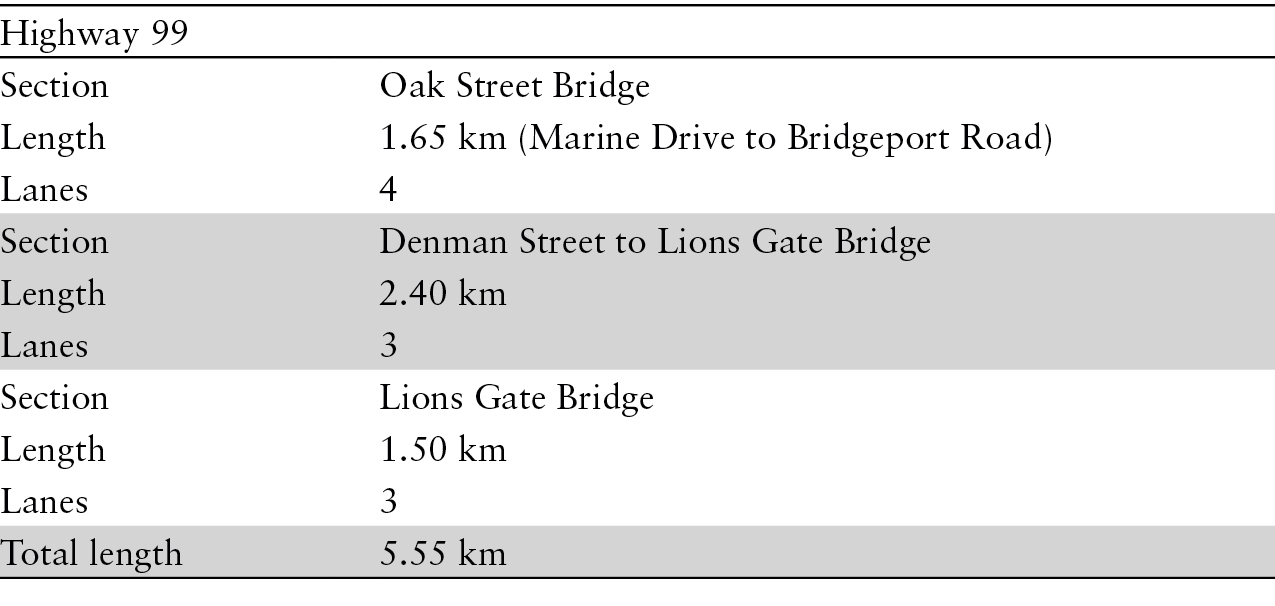
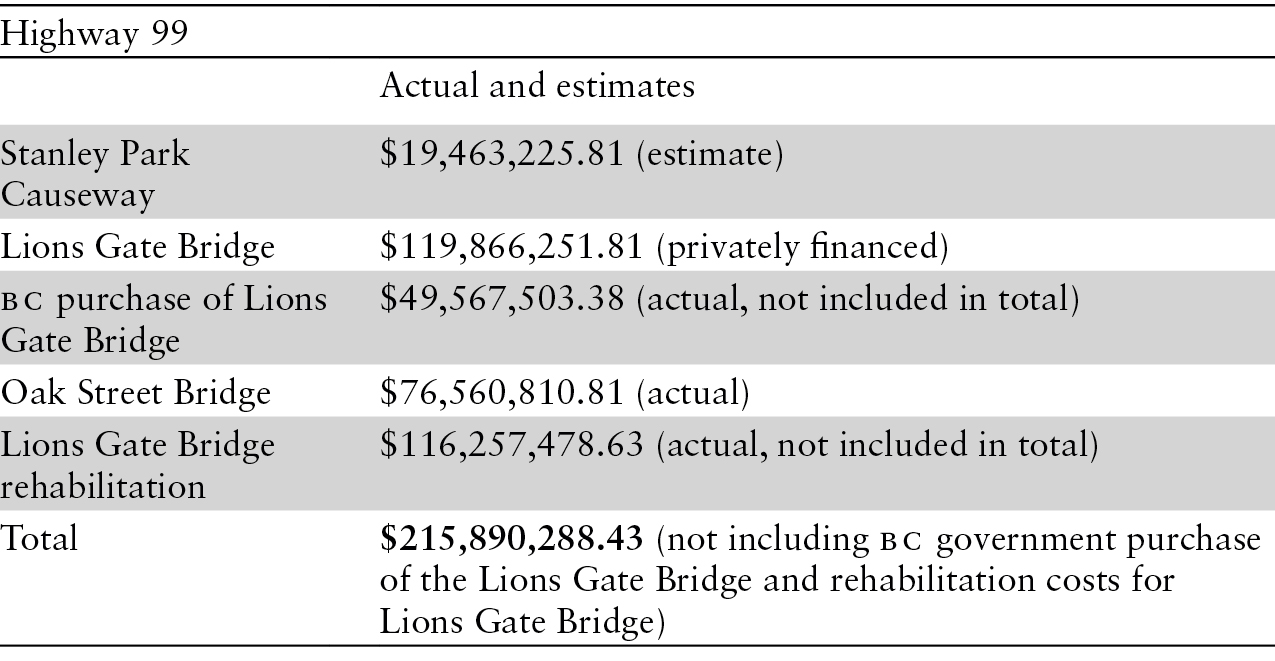
When private funding was used to build capital projects, such as the Lions Gate Bridge, it was difficult to trace the funding and yearly spending. Best estimations from historical documents have been made. Construction of the Stanley Park Causeway occurred only following a plebiscite in 1933 (McCord Museum, n.d.). When it purchased the Lions Gate Bridge, the Government of British Columbia bought 99% of the First Narrows Bridge Company’s shares (Bennett 1955).
British Columbia has used tolls to help recover the capital costs of bridges and expressways at times in its history. As such, the Lions Gate Bridge, Oak Street Bridge, and Second Narrows Bridge all had tolls in the past. In 1953 the Toll Highways and Bridges Authority was established to oversee future construction paid by these tolls. Then in 1963 the provincial government passed legislation to phase out tolls by 1964. By this time the cost of the Lions Gate Bridge and Second Narrows Bridge had been paid. This meant that the original Port Mann Bridge opened without toll collection (Bennett 1963, 1962, 1958). These tolls may have been forgone because the federal government had agreed to pay half of the costs for the first Port Mann Bridge (e.g., two lanes out of four). The provincial government paid the remaining costs of the bridge (Bennett 1963).
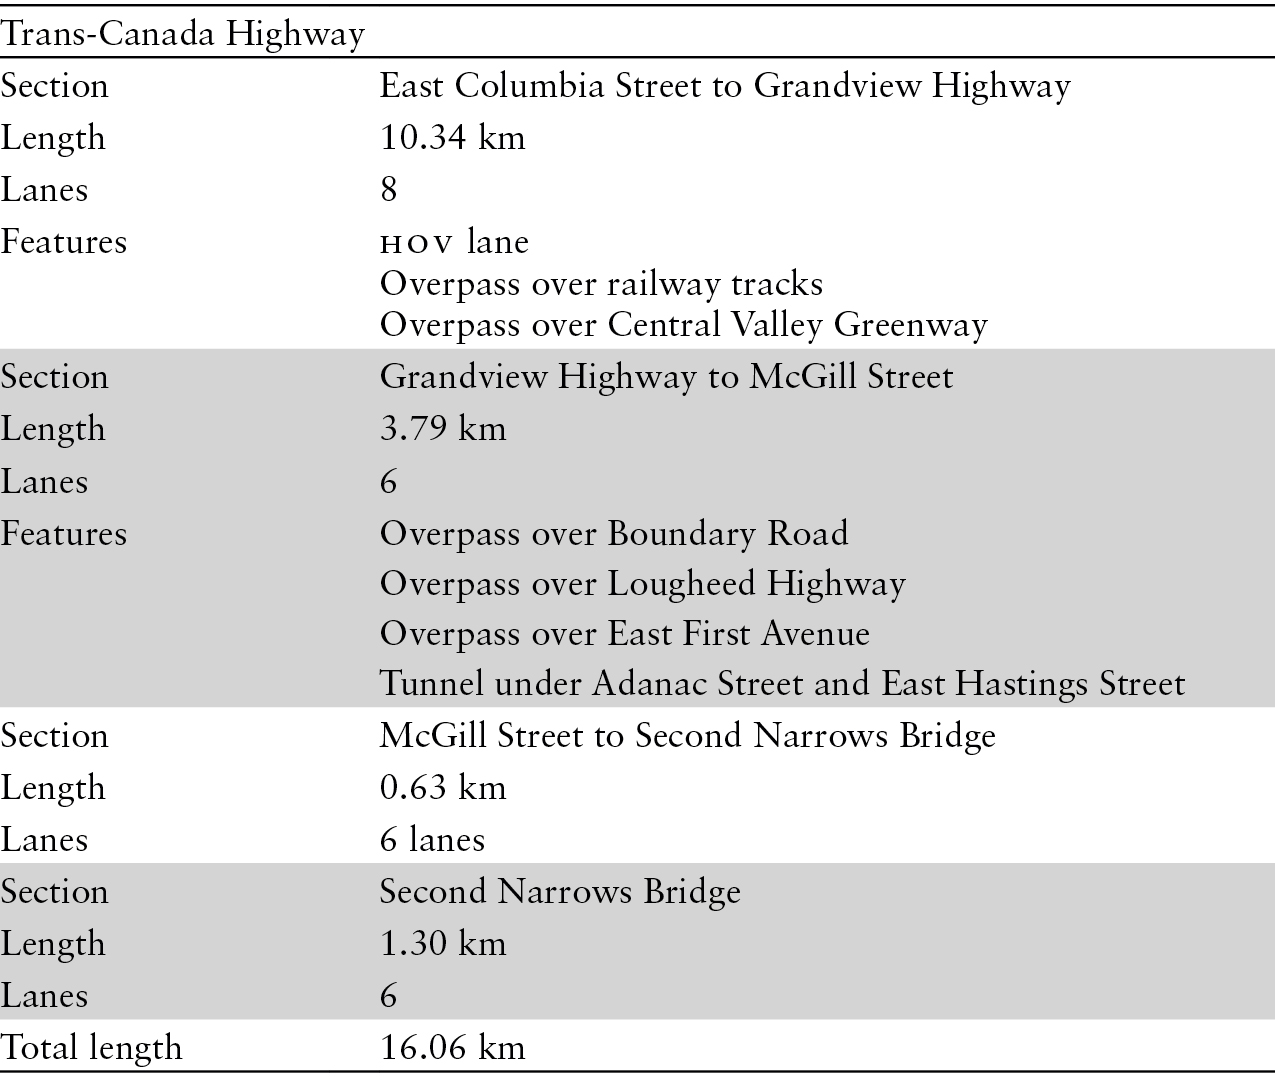
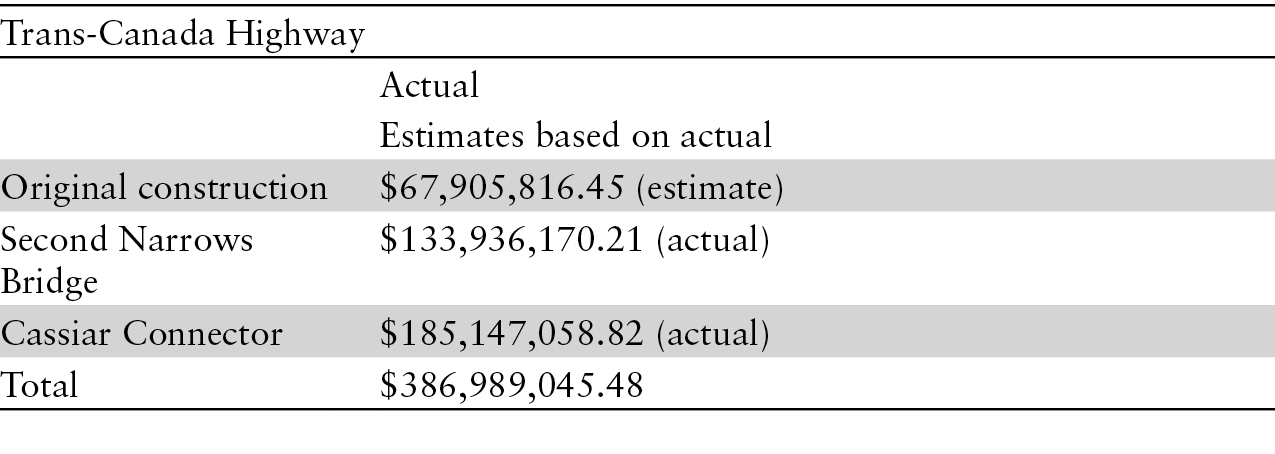
When the Trans-Canada Highway was built from 1957 to 1964, a small portion (2.3 km) was not built to full expressway standards. It was upgraded from 1990 to 1992 as the Cassiar Connector in Vancouver. Despite this upgrade, the stretch that became the Cassiar Connector was still part of the original construction costs and did not add length to the expressway. We have thus decided to include both rounds of capital expenditure for the original construction, plus the upgrade, because it was only after the second round of spending that the 2.3 km of this infrastructure could be classified as an expressway.
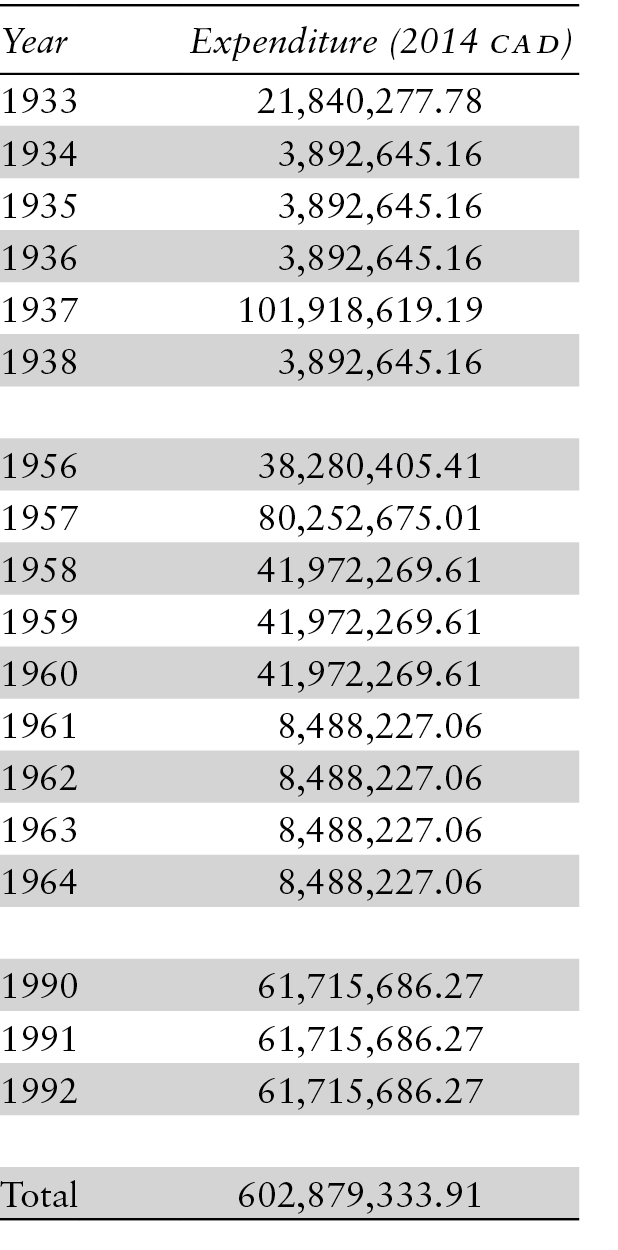
As yearly capital expenditures were not reported for the Trans-Canada Highway, they have been calculated using the same methodology as in Toronto; that is, known expenditures were evenly divided over known years of construction. A similar interpolation was used for the Stanley Park Causeway, using known costs from Highway 99. As contributions from different levels of government were unspecified, and expressways within British Columbia are entirely owned and built by the Province, except the Lions Gate Bridge and its approach through Stanley Park, expressway capital spending was assigned to the provincial government unless clear evidence of an alternative source was found.
Overview

Physical Characteristics

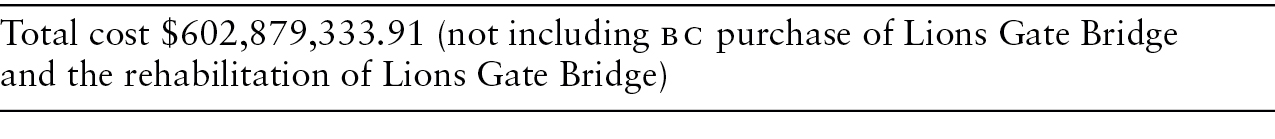
Capital Expenditures, 1933–99
RAPID TRANSIT
Measurements
Measurements were taken using Google Earth’s line tool. A line was overlaid on the SkyTrain routes. These measurements followed the routes to key stations (Waterfront, New Westminster, Columbia, Bridgeport, YVR Airport, and Brighouse) to assess the length of each line. Initial measurements were completed from 23 to 27 May 2016, a second set of measurements was completed from 7 to 9 June, and a final measurement was taken on 14 June 2016. All Google Earth imagery is dated 2015.
Limits, Gaps, and Notes
While multiple claims for funding the Expo Line can be found in the media, according to annual reports of BC Transit this agency was the sole contributor of capital to construct Vancouver’s first rapid-transit line, with the exception of a loan from the Government of British Columbia.
The Millennium Line shares some right-of-way with the Expo Line. During its construction some of the Expo Line infrastructure was upgraded to accommodate the additional capacity of the new line; these upgrades included improvements to the Metrotown and Main Street stations. Although TransLink expended the capital, these funds came entirely from the Province.
Overview
The Millennium Line opened on 7 January 2002. We include it in our data set because most of the capital had been expended before 2002, and the line was fully functional by the end of 2001, with a somewhat arbitrary decision to open for revenue service after the holiday season of 2001.

Physical Characteristics


Expenditure
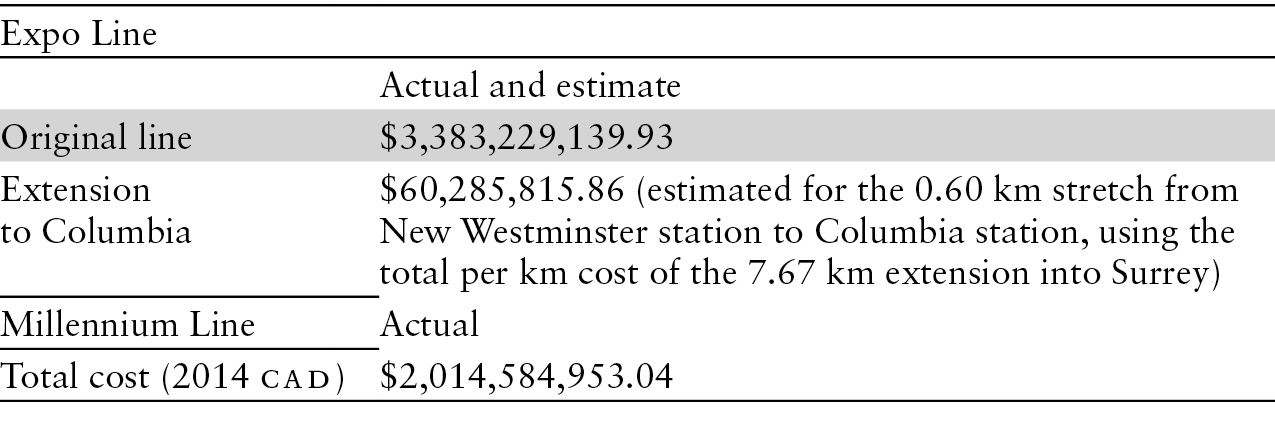

Capital Expenditures, 1981–2002

Expenditure for the extension to Columbia station is based upon the per km cost of the entire extension multiplied by the 0.60 km length of this extension and then distributed over the 1984–89 period.