THE UNITED STATES SENATE: A PLACE OF DECORUM AND history, of respect for centuries-old institutions, of heady debate and a solemn and weighty legislative process. And of half-assed snowball fights.
Senator James Inhofe, a Republican of Oklahoma, has long led the congressional climate denier caucus. This is an unofficial group, and one that over a decade or so went from the fringes to the mainstream of GOP legislators. Inhofe has made countless speeches claiming to expose the supposedly fraudulent world of climate science, helped kill bills that would have tried to put a dent in warming temperatures and rising seas, and even crashed international negotiations in an attempt to undermine progress.1 And on February 26, 2015, he brought a snowball—an actual ball of snow—onto the floor of the Senate.
“You know what this is?” he asked, sly grin on his face. “It’s a snowball. From outside here. So it’s very, very cold out. Very unseasonable.”2 He then tossed the snowball to the Senate president and urged him to catch it.
Again, it was February, in Washington, DC, so cold is essentially the definition of “seasonable,” but let’s ignore that for a moment. Whether or not the cold and snow were season-appropriate, the idea of using a single data point—in this case, one cold day, or one snowstorm or snowball itself—to supposedly prove a larger point is among the most fundamental of logical fallacies. This is also the error that may sound most familiar: the CHERRY-PICK, when you selectively pull out only those pieces of information that suit you, ignoring the larger body of evidence.
As we’ll see, the CHERRY-PICK takes a number of forms, and Inhofe’s snowball is only one example, sometimes referred to as a fallacy of anecdotal evidence. Inhofe’s argument was simple: it’s cold out, so the people who say the world is warming can’t possibly be correct. This is, of course, ridiculous. No climate scientist has ever said that global warming means there will be no more cold days, ever, in parts of the world where a season called “winter” happens. But it is a remarkably common refrain: every time a major snowstorm hits, or a cold snap freezes New York or Chicago for a few days, the deniers jump on their soapboxes and crow that global warming can’t possibly be happening.
They stay conspicuously quiet in the face of competing evidence, these doubters or deniers; in fact, because controversy has reigned in the media over what exactly to call these folks (“skeptic” is too kind, “denier” too narrow, “doubter” too vague),3 let’s coin a new term: climate “TOADS,” or Those who Oppose Action/Deniers/Skeptics. The TOADS don’t just ignore a particularly hot day in January, or even a few straight days over 100 degrees in Boston in July; there is plenty of real, non-anecdotal evidence to send Inhofe and his snowball home. If the climate were generally stable (that is, if it were not warming up dramatically), one would expect a similar number of daily record low temperatures and record high temperatures. After all, a daily record is just an aberration really; unlike the longer-term trends we call “climate,” the short-term “weather” is full of noise. The fact that one particular February 26 was very cold, or very warm, says nothing about the long-term trends.
In a warming world, though—the world we are, unfortunately, living in—the record highs would outpace the record lows. Basically, the deck would be stacked in favor of higher temperatures, meaning it’s simply more likely to achieve an aberrantly high mark than it is to set an aberrantly low mark. And that’s exactly what we observe.
During the first decade of the twenty-first century, record highs in the United States outpaced record lows by a ratio of 2.04 to 1, according to one study published in late 2009.4 That means for every record low temperature (for example, this particular November 12 was the coldest November 12 we have ever recorded in this particular location), more than two record highs were set. That beats out the ratios from the 1990s (1.36 to 1), the 1980s (1.14 to 1), and so on.
More recent data have shown that this trend is continuing. From 2010 to 2015, record highs were still outpacing lows by about 2 to 1.5 And that ratio is likely to skyrocket soon.
That same 2009 study projected what will happen with record temperatures over the rest of this century, and the results are striking. That 2-to-1 ratio, remarkable enough on its own, will be a thing of the past. By the middle of the century, record highs will beat out record lows by a ratio of 20 to 1. By 2100, every record low will be matched by 50 record highs.
Inhofe didn’t even pick a particularly cold day to make his CHERRY-PICKED point. Even in a warming world, there will be plenty of winter days in Washington and elsewhere that, yes, have snow on the ground. Lobbing a snowball in the Senate doesn’t undercut the broader trend in any way.
INHOFE’S VERSION OF THE CHERRY-PICK is a simple one: a single, limited experience used to try to make a far broader point. But there are other, more clever ways of deploying this technique.
In March 2015, Texas senator Ted Cruz broke out another favorite talking point of climate TOADS: the so-called warming hiatus. Climate scientists had observed a slowing in the rate of warming from the late 1990s through the early to mid-2010s, and this was dubbed a slowdown or “hiatus.” Here’s how Cruz discussed it in an interview with the Texas Tribune:
The satellite data demonstrate that there has been no significant warming whatsoever for 17 years. Now that’s a real problem for the global warming alarmists because all of the computer models on which this whole issue is based predicted significant warming, and yet the satellite data show it ain’t happening.6
The first problem is that most people who cited this hiatus—Cruz included—actually described it incorrectly: it was a reduction in the rate of warming, not in warming itself. In other words, the planet got hotter slightly slower than it had managed in earlier years. But it still got hotter.
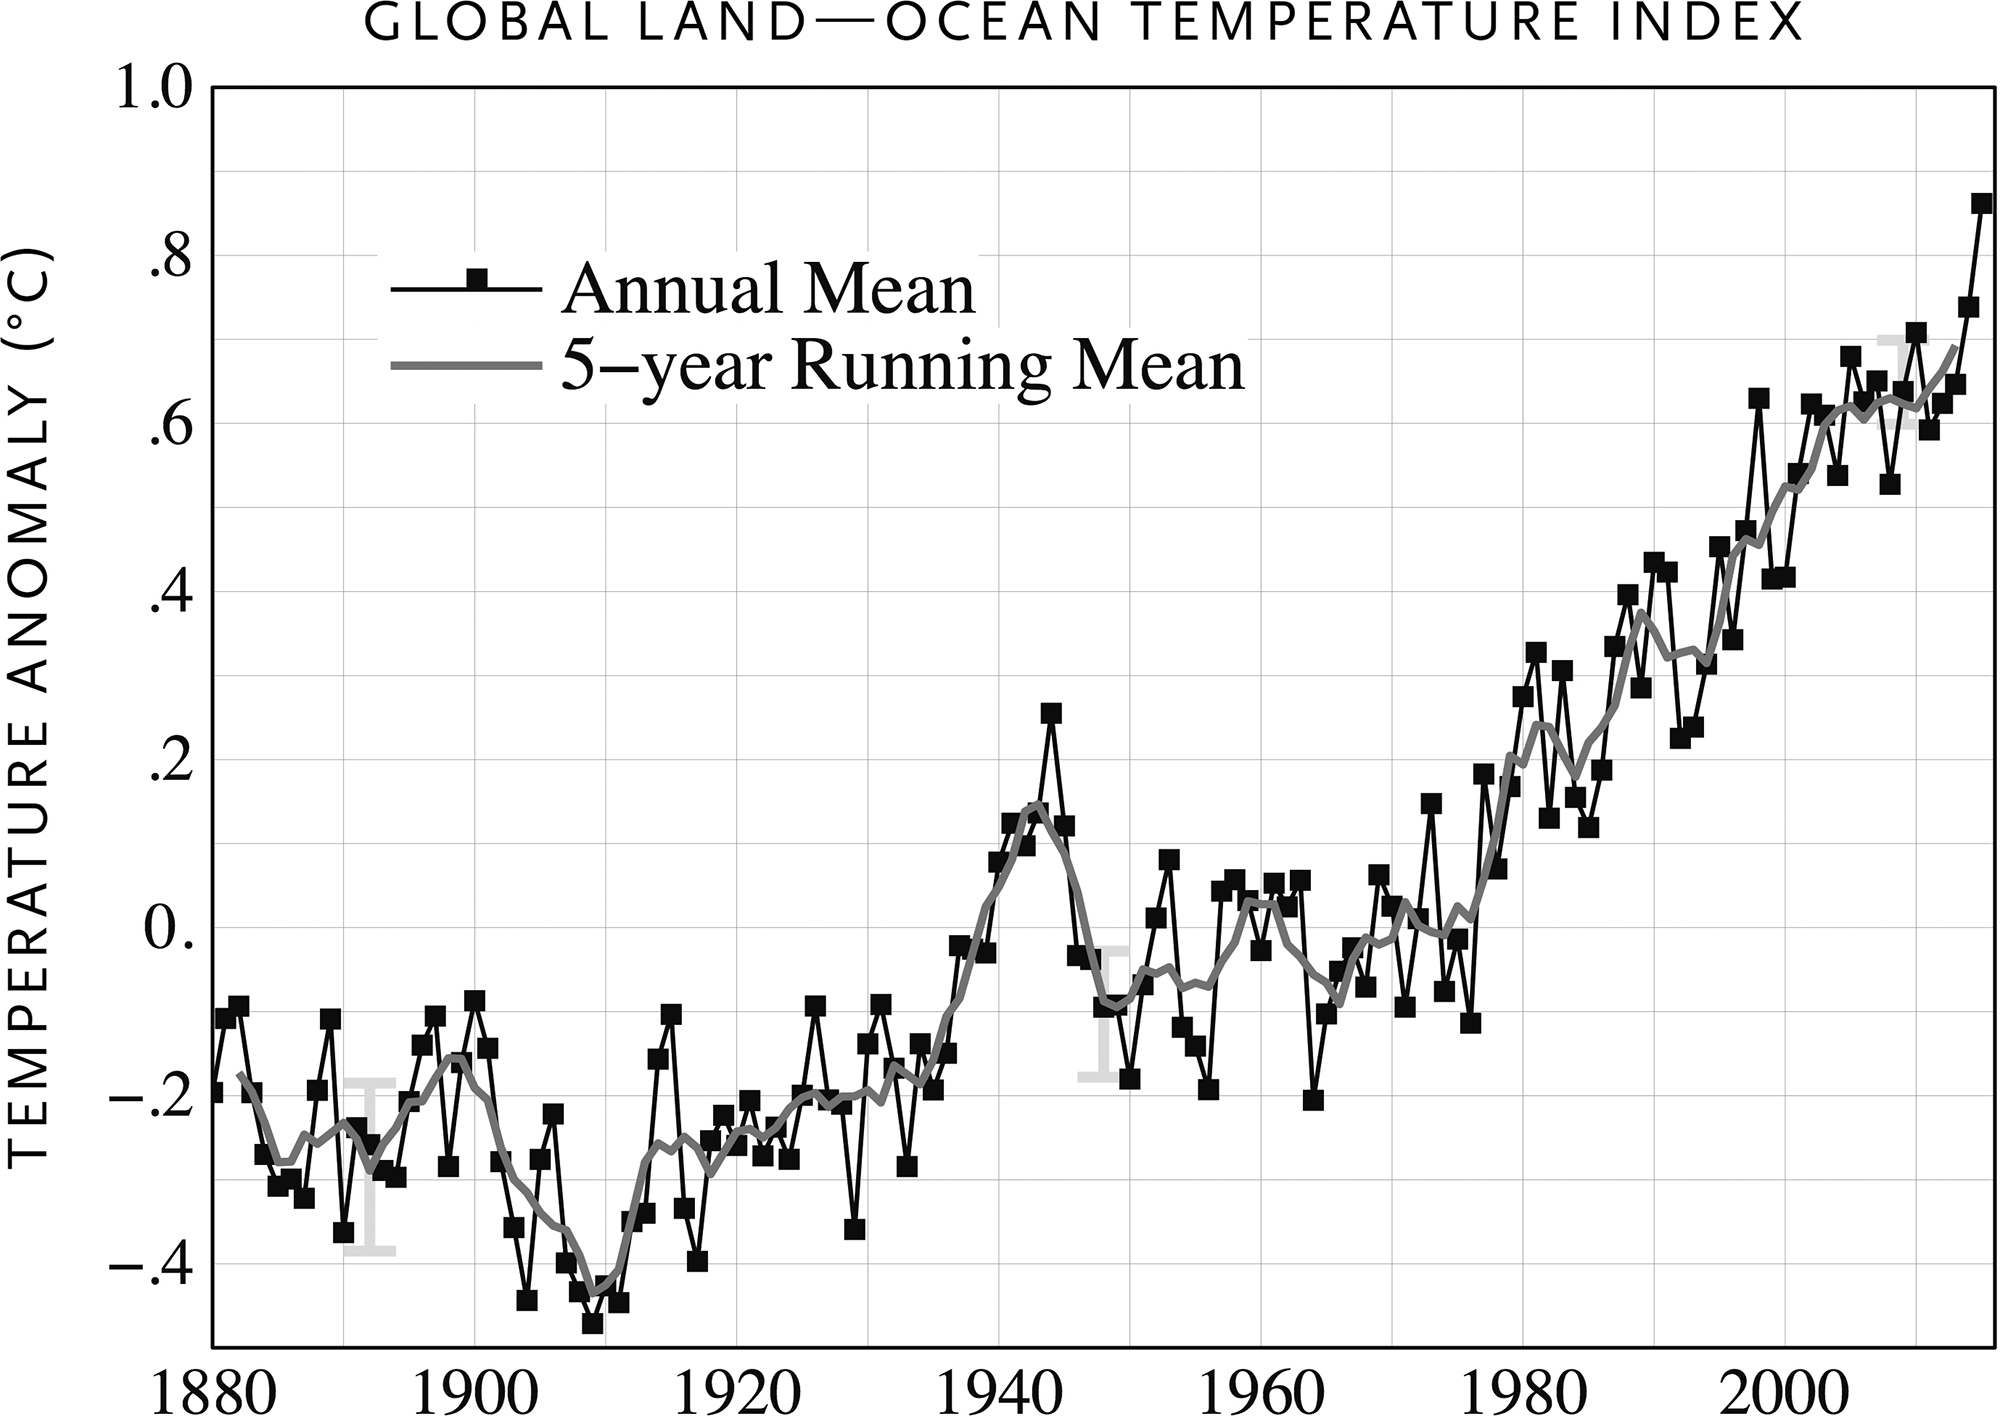
The second problem is that to claim that “no warming” happened, you have to engage in a serious bit of CHERRY-PICKING. It works like this: compare a particularly warm year from some time ago to a more recent year with a similar overall temperature, and you’ll see an essentially flat line. In general, the TOADS use 1998, a year marked by an exceptionally strong El Niño, the weather pattern characterized by warm Pacific Ocean waters that can raise global temperatures. That year, the temperature “anomaly”—the globe’s departure above or below the twentieth-century average—was +0.64 degrees Celsius (°C). In a more recent year, 2013, the anomaly was +0.66°C. If those were all the data points you had, wouldn’t it seem like temperatures have been largely flat over that particular period? Almost no change at all. No warming to speak of, no reason to dramatically cut carbon emissions or anything of the sort!
Let’s adjust the period we’re examining by just one year at the beginning: in 1999, the anomaly was +0.42°C. Suddenly, we see a warming trend of about one-fifth of a degree, a large amount in the context of a global average. If we extend the data out to 2014, the jump gets even bigger—to a full third of one degree.
That’s a dramatic difference! Suddenly, instead of no warming whatsoever, we have a huge increase in global temperature in just a few years.
But starting with 1999 is just as misleading. In both cases, we are CHERRY-PICKING start and end points for the series, when we should, in fact, be observing as long a trend as we possibly can. There will always be variation from year to year, just as there is variation in temperature, in precipitation, even in sea-level rise, from region to region. And the longer-term trend is unequivocal: the world has warmed by about 1°C over the last century. Here’s the full chart from NASA, showing all the data we have as of early 2016:
Credit : NASA Goddard Inst i tute for Space Studies
Not only was the seventeen-year issue CHERRY-PICKED, but some new research after Cruz made his claims actually called the entire idea of the hiatus into question. Scientists with NOAA and elsewhere published a report in the prestigious journal Science in the summer of 2015 that recalculated global temperatures using the most up-to-date methods, and found that the idea of a hiatus was “no longer valid.”7 The warming trend from 2000 to 2014 was 0.116°C per decade, which was “virtually indistinguishable” from the longer-term trend from 1950 through 1999. The study’s lead author told the Associated Press: “The reality is that there is no hiatus.”8 Of course, this revelation did not stop Cruz and other politicians from repeating the same claim throughout 2015, even after the Science paper was published. (Yet another paper in early 2016 found that there was, in fact, a slowdown in warming in the early 2000s9—an example of how honest and diligent scientists can disagree, work to understand a phenomenon, and eventually arrive at an answer. In this case, even though there may have been a slowdown, Cruz’s silly claims went well beyond what any reasonable scientist would say.)
Impressively, there is still one more way that Senator Cruz’s claim represented CHERRY-PICKED data. Did you notice how he specifically said the “satellite data”? That wasn’t by accident.
The world’s climate scientists have several ways to take the planet’s temperature. One of them is a network of thousands of land-based temperature stations, some composed of little more than a thermometer and some with more complicated instrumentation. Another is with ocean buoys, and thermometers housed inside the engine mechanisms of globe-trotting ships. And yet another is a network of satellites, high above the Earth. The satellites use complicated instruments to estimate temperatures at various altitudes, including in the troposphere—the lowest part of the atmosphere, where we all live. (Satellites run by NOAA and NASA take many other important measurements related to climate, such as ice thickness, but we’ll focus on temperatures here.)
All the different types of temperature measurements have different sources of error that require correction and adjustment. Skeptics have started homing in on the satellite data, because the various satellite temperature data sets don’t paint as clear a picture as the other sources do. Specifically, one particular source of satellite data stubbornly doesn’t show quite as much warming as the others. These data come from the University of Alabama at Huntsville.
The UAH record is managed by two professors, named John Christy and Roy Spencer. Both have ties to vocal climate-change-skeptic groups like the George C. Marshall Institute10 and have published numerous opinion pieces in the Wall Street Journal11 and elsewhere, downplaying the seriousness of the climate challenge and insisting that regulation of emissions isn’t necessary. They are, quite clearly, outside the mainstream of accepted climate science.
Other climate scientists have shown that Christy and Spencer’s data are not the most trustworthy, for various reasons. Here’s how eminent climate scientist Raymond Pierrehumbert, now at Oxford and previously at the University of Chicago, described the situation for the well-respected RealClimate blog back in 2008:
Spencer and Christy sat by for most of a decade allowing—indeed encouraging—the use of their data set as an icon for global warming skeptics. They committed serial errors in the data analysis, but insisted they were right and models and thermometers were wrong. They did little or nothing to root out possible sources of errors, and left it to others to clean up the mess.12
More recently, other climate scientists have applied some of the best available techniques to the same data that the UAH team uses, and have reached different conclusions.13 Essentially, satellites—like any other source of measurement—aren’t perfect. In a few different ways, they add slight bits of noise to the results; one of these ways is something called “diurnal drift.”
That means that the satellite’s orbit shifts slightly over its lifetime as it passes by overhead. In a study published in 2015 by University of Washington researchers, correcting for the diurnal drift in the UAH data set yielded a much stronger warming trend than Christy and Spencer report. This finding is borne out by the other satellite data sets, such as that from a company called Remote Sensing Systems and another by NOAA.
That the same raw data could yield differing outputs isn’t particularly surprising. Experts say that the satellite data have more potential for error and should probably not carry as much weight as other sources. Even the scientists who themselves collect and analyze the satellite data say so! Carl Mears, a senior research scientist for Remote Sensing Systems, told the Washington Post the following:
All datasets contain errors. In this case, I would trust the surface data a little more because the difference between the long term trends in the various surface datasets (NOAA, NASA GISS, HADCRUT, Berkeley, etc) are closer to each other than the long term trends from the different satellite datasets. This suggests that the satellite datasets contain more “structural uncertainty” than the surface dataset.14
By “structural uncertainty,” Mears meant that we don’t know as much about how the inputs—the actual readings taken by the satellites’ instrumentation—are influenced by various factors. We can be more confident that the reading of a thermometer on the ground is telling us the truth (with some important exceptions, which we’ll see in Chapter 5).
In a way, you can admire the thoroughness with which Senator Cruz crafted his talking point. He not only CHERRY-PICKED a starting year that enabled him to claim there has been no warming; he even CHERRY-PICKED the set of temperature records to armor himself against less-than-perfectly-informed criticism. Cruz seemed to love his satellite data idea: he mentioned it many times over the course of 2015, and even spent an extended period during a Senate committee hearing attempting to convince the president of the environmental group Sierra Club that no warming had occurred in seventeen years.15
But as we’ve seen, this isn’t a particularly difficult claim to debunk. When a politician makes what sounds like a very specific point—no warming for seventeen years, not sixteen or eighteen—be wary. Check the details of that specificity. Did he pick that number for a reason? What do the longer, more general trends or more wide-ranging data show us? Where are the data actually coming from? If you ask these questions, this type of CHERRY-PICKING won’t easily get past you.
THIS ERROR, THOUGH, is among the most expansive that this book will cover, with many types and versions available to a politician looking to throw a bit of murk over a scientific issue. All these adaptations of the technique seem ready-made for the world of climate science.
When it comes to global warming, the problem is as broad as any that the scientific world encounters; it literally encompasses the entire planet. With countless data points on specific topics ranging from temperature to ice loss to extreme weather, a politician who wants to question the need for action can CHERRY-PICK to her heart’s delight.
The ever-quotable Sarah Palin, former Alaska governor and 2008 GOP vice presidential nominee, used this tactic in criticizing President Obama’s trip to her home state in the summer of 2015. Appearing on CNN’s State of the Union, she suggested that Obama’s visit to a receding glacier wasn’t telling the whole story:
I take changes in the weather, the cyclical changes that the globe has undergone for—since the beginning of time, I take it seriously, but I’m not going to blame these changes in the weather on man’s footprint. Obama was up here looking at, say, the glaciers and pointing out a glacier that was receding. Well, there are other glaciers, though, that are growing up here. And he didn’t highlight that, but he used glaciers as an example.16
Let’s ignore her blithe dismissal of climate as “weather,” her repetition of the common talking point regarding cyclical, since-time-immemorial change, her easily debunked idea that man isn’t responsible (and it will be debunked in Chapter 9). Instead, we’ll focus on the claim regarding glaciers—that “other glaciers . . . are growing up here.”
As it happens, Palin was absolutely right about that; there certainly are glaciers that are gaining mass, even as temperatures warm. Palin used this point as a way to suggest that Obama is wrong to call for climate action: if some glaciers are actually gaining more ice, how could climate change possibly be a problem?
In accusing the president of CHERRY-PICKING his glacier, Palin actually was guilty of the CHERRY-PICK herself. She highlighted a certain glacier in Alaska, known as Hubbard Glacier, which has indeed been growing at a relatively steady pace since we began measuring it in 1895. Obama, meanwhile, visited Exit Glacier, which has receded a remarkable 1.25 miles over about two hundred years.17 Obama called Exit “as good of a signpost as any when it comes to the impacts of climate change.”18

Exit Glacier, Alaska, which has receded more than
a mile since we began measuring it.
Credit : National Park Service/Fiona Ritter
Is this just a he-said-she-said kind of issue? They each have a glacier, one receding and one advancing, and neither is right about the more fundamental point?
Not even close. The fact is that the vast majority of glaciers both in Alaska and around the world are losing ice mass at remarkable rates. Some buck this trend and are gaining ice; that doesn’t disprove global warming in any sense. In fact, in some cases it does the opposite, providing support for certain predictions about the effects of climate change. Here’s how.
Glaciers, as you probably know, are essentially large blocks of ice. They gain mass, generally during winter months, through accumulation of snow on their surfaces. As pressure on the layers of snow increases, those layers gradually turn into ice. In the summer months, glaciers often lose mass, in the form of meltwater. If less snow falls in the winter than ice melts in the summer, the glacier has a “mass imbalance” and will shrink and recede. If the opposite is true—more snow falls on the glacier than it loses in ice melt in the summer—the glacier will expand, often “flowing” down mountains and valleys and cutting scars and holes in the terrain as it goes.
In a warming world, one would expect most glaciers to melt more than they gain in snowfall, and that’s what we actually observe, as we’ll see shortly. But some glaciers actually gain mass thanks to the warming climate: warmer air can hold more moisture, which means that in some parts of the world (remember there will be regional variation in climate effects; it isn’t all one effect everywhere), precipitation rates will increase. If that precipitation takes the form of increased snowfall in an area where temperatures aren’t high enough to cause summer melts that outweigh the new mass, glaciers will expand.
That’s what’s happening to the Hubbard: because its “catchment basin”—the area in which snowfall will contribute to the glacier’s mass—extends over an enormous area, increases in precipitation in the region give the glacier a huge source of ice.19 Its front edge has been pushing forward at a rate of between 13 and 36 meters every year for more than a hundred years.20
So, Palin picked a glacier that is likely expanding because of global warming to suggest that global warming isn’t happening. Nice CHERRY-PICK! The more fundamental point, though, is that even if some are expanding, the vast majority of glaciers are shrinking.
A recent study on glaciers specifically in Alaska actually pinned a number on the ice loss: 75 gigatons per year. A gigaton, as silly as it might sound, is a no-joke amount of ice: 1 billion metric tons. If you’re trying to picture how much this is, imagine 100 million African elephants, or 6 million blue whales, or 3,000 whole Empire State Buildings.21
One scientist described a gigaton to the Washington Post in stark, visually arresting terms: take the National Mall in Washington, DC, from the Capitol steps down to the Lincoln Memorial (about 2 miles long and five football fields wide), and cover it in a giant block of ice four times as high as the Washington Monument.22
Have you managed to get a grip on that visualization? Now take seventy-five of those giant blocks of ice, chop them off of Alaska’s thousands of glaciers, and dump them into the ocean. Once you’ve done that, we can start thinking about the rest of the world’s glaciers as well.
Yes, it’s not just Alaska, of course. The vast majority of glaciers around the entire globe, from the Alps to the Greenland ice sheet, are shrinking in this rapidly warming world. The World Glacier Monitoring Service, a United Nations program that keeps tabs on a number of “reference” glaciers, has found in recent years that between 80 and 90 percent of them are losing mass.23 The National Snow and Ice Data Center at the University of Colorado at Boulder has said that over 90 percent of all alpine glaciers—which excludes ice sheets but includes the bulk of other glaciers around the world—are also retreating and losing mass.24 The Greenland ice sheet itself has lost more than 9,000 gigatons, or 9 trillion tons, since 1900.25
Even if you forget that warming temperatures are actively helping some glaciers gain mass, those stark numbers reveal Palin’s claim as the CHERRY-PICK that it is. To the less well informed, though, she may sound like she has a point: Shouldn’t warming temperatures make every glacier lose ice? And if one isn’t, then why should I believe any of this climate change nonsense?
When a politician cites a singular example as a means of refuting a larger trend, take note; this is the hallmark of bad science. Ask yourself if that one counterexample really refutes the entire idea, or if there’s more to the science than our leaders might say. Indeed, Obama’s claim regarding Exit Glacier deserves the exact same scrutiny—but once scrutinized, it becomes clear that his example really is representative of the broader trend.
As we’ve seen, there are a number of ways to use the CHERRY-PICK that have subtle differences. You can take only a single data point, like the glacier example; you can zoom in on a particular section of a much bigger graph, as in the “seventeen years of no warming” claim; or you can focus on only a certain data source when the other sources disagree with your basic point. In any of these cases, the end result is the same: a small piece of a big puzzle is used to confuse anyone listening, and to undermine scientific and political progress at once.