Chapter 15
Gathering Important Information about Your Company
IN THIS CHAPTER
 Focusing your data team on the business vision
 Inventorying your company’s data technologies and resources
 Mapping out the people and data skill set requirements
 Preempting and preventing data science project failures
The success of prospective data science projects heavily depends on whether those projects represent an implementation of your company’s lowest-hanging-fruit use case — in other words, the most promising data science use case for your company, given its current capabilities with respect to data resources, technology, and skillsets. To ensure that your data science use case is the lowest-hanging fruit, though, you need to make sure that it offers the quickest and biggest bang for your company’s buck — especially when you and your company are novices when it comes to leading profit-forming data science initiatives. For a new data science initiative to offer a solid return on investment in a short period, it should be something that your company can implement using its existing resources.
To make maximum use of existing resources, you first need to uncover what those resources are, as well as any hidden risks within them. In this chapter, you see the different types of information you should collect about your company so that you can assess that information and make an informed decision about which data science use case truly represents your lowest-hanging-fruit data science use case. Do not skip the last section of this chapter, because that’s where you can find out the single most efficient way to collect the massive amount of information you need about your company before you can even begin trying to select a true lowest-hanging-fruit use case.
Unifying Your Data Science Team Under a Single Business Vision
One thing that new-and-aspiring data science leaders notice pretty quickly is that data implementation folks can sometimes struggle to see the forest for the trees. And, if you’re doing data science implementation work, you’ve likely been frustrated to realize that nobody gives you a map of the forest — yet everyone expects you to find your way through it. If either of these two frustrations rings a bell, let me tell you that most companies' data teams face these frustrations every day! Figure 15-1 depicts the classic everyday struggle of most data teams.
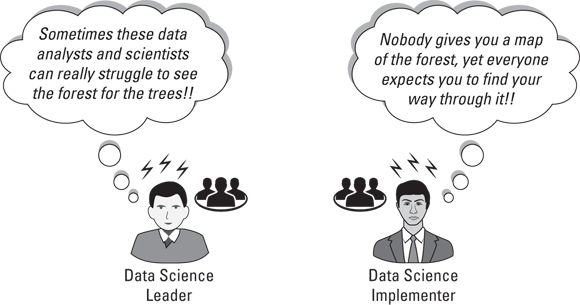
FIGURE 15-1: The classic power dynamic within a data science team.
In Chapter 1, I spend some time clarifying the difference between data leaders, data implementers, and data entrepreneurs. Though it's true that my discussion there was meant to help you more quickly find your affinity within a wide variety of data science roles, there's more to it than that. From a business perspective, it's unrealistic to expect someone to act as both a data leader and a data implementer. Sometimes, smaller companies do have periods of overlap while they’re still growing and lack the resources for separate dedicated team members for these roles — but the quicker you can segregate and delineate chains of responsibility between these two data science functions, the better.
If you're a data leader, you know that you're responsible for making sure that deliverables are managed effectively, to specification, on time, and within budget. Providing your data scientists, data analysts, and other data implementation workers with ample support is a huge part of making that happen. Though data science implementers are responsible for building data science solutions to business problems, they also have to be sure to communicate their progress, obstacles, and occasional misgivings. Data scientists don’t have to worry much about how to pull it all together, or whether team members are completing their tasks on time, but everyone on the team needs to work together to help everyone along. This is how happy and efficient data science teams function.
A healthy dynamic between data science team members is essential, but there’s more to leading successful data science projects than just that. You also need to understand where the data science team, as a whole, fits within the business (and I’m not talking about the organizational chart here!). The truth of the matter is that if your data science team members aren’t supporting one another, or if the team itself isn’t properly attuned to your business vision, it's entirely possible for the team to spend all its time tending to one lonely sapling of a data project — completely oblivious to whether that project actually moves the needle in terms of revenues or business vision.
I tend to talk a lot about how data leaders need to use data science to generate new or improved profit for their companies. I do that because earning money is the primary purpose of a business, though a business wouldn’t be successful if all it did was focus on ways to make money.
Framing Data Science around the Company’s Vision, Mission, and Values
A business needs a higher purpose that defines why it operates, and that purpose should not be solely to make money. A business that lacks a clear purpose (beyond just making money for its owners) might as well be called a parasite rather than a business. As shown in Figure 15-2, an equal exchange of money should take place for something of measurable, meaningful value to customers.
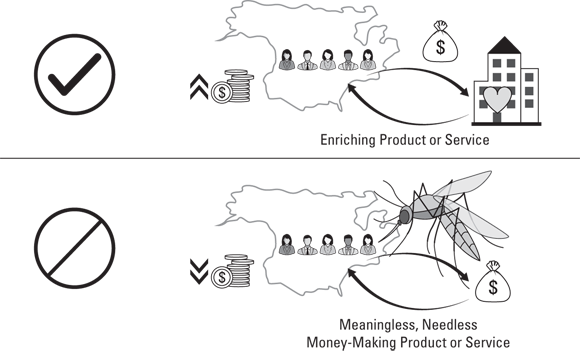
FIGURE 15-2: The need for business vision, mission, and values.
I don’t care how much your company generates in revenue — if it’s just a money extraction machine, it's not successful. True business success occurs whenever a company sells something that improves the lives or businesses of its customers, and the company, in exchange, makes a profit. One way to know whether a company sells products and services that truly enrich society is by looking at how people use the products or services. Are people able to use the products they purchased to help produce an increase in the net value of their communities? If the answer is yes, the products or services are enriching. The ultimate goal of a company should be to grow by enriching lives and societies.
On the other hand, if a company sells meaningless swag, in the long run its customers will see a net decrease in wealth and nothing of lasting value to show for it. If all businesses were run in this manner, societies would run dry of resources as companies grow richer and people become poorer. If you think of it on a large scale like this, I’m sure you’ll agree that no one should support businesses like these. Enter the need for a clear business vision, mission, and values.
A business vision is a statement of a company’s goals and aspirations for the future. A mission statement is an action-based description of a company’s purpose for being in business, in terms of who it helps, how it helps them, and why it seeks to provide this type of support. A company's values are the moralistic principles that guide its initiatives. Getting back to data science, the goal of a data science project should be in direct support of your company in helping it reach its business vision. Because the company is a business, the goal of your project should be to improve revenues for the company, but only in ways that are aligned with the company’s vision, mission, and values.
How do you know what your company’s vision, mission and values are? These are the types of details that the folks in human resources usually indoctrinate you with when you first start as an employee. You can also check the company's website for these types of public-facing statements.
If you’ve read Part 3, you’ve completed the Survey phase of the STAR framework. In those chapters, I describe a wide variety of data science use cases that are applicable to multiple industries and that can support businesses in a wide variety of ways. By now, you should feel “stocked up” when it comes to ideas for new data science projects! The next phase of the STAR framework is where you take stock of your company and inventory its current data science capabilities. You can see how to do that throughout the rest of this chapter. Then, in the rest of Part 4, you can see how to work through the Access and Recommend phases of the STAR framework.

FIGURE 15-3: My STAR framework, for managing profit-forming data science projects.
Taking Stock of Data Technologies
Before you can pick a lowest-hanging fruit use case, you need to inventory all the data technologies that are already available at your company. You can get started on this task by first requesting your company’s enterprise IT architecture — the low-level blueprint of the current state of your company’s IT technology infrastructure. It describes the technologies your company owns and how they’re utilized together to support the business requirements of your company. Also, be sure to request any data infrastructure architecture — the blueprint that details the technology architecture for the data solutions your company has in place, like the example shown in Figure 15-4.
You should be able to request an up-to-date copy of both the data/IT infrastructure architecture and the associated architecture standards from an IT manager or any relevant data architects. Architecture standards provide the metamodel and definitions around which the architecture is designed.
From the architecture artifacts, make a list of the data technologies that are in use at your company, and then conduct surveys and interviews of relevant personnel to fill in any gaps and uncover other data technologies. The purpose of this process is to unearth any “hidden” data technologies that are used within the business units of your company, but that may not be shown within the official architecture. As far as how to use surveys and interviews to collect the necessary information, I cover that topic in the last section of this chapter. As far as what data technology questions you may want to ask, they might include these:
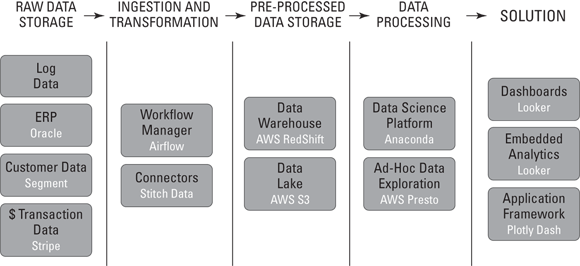
FIGURE 15-4: An example of data architecture.
- What data technologies and tools do you use throughout the course of your work?
- What other data technologies and tools do you know of that are being used by colleagues at the company?
- In terms of file sizes, what are the biggest data sets you’re working with?
- How do you access the data you need to do your job?
- Where are your data sets being stored?
- How is data distributed across your company, and which data access issues are you aware of?
When interviewing and surveying personnel about data technologies they’re using, map out a list of potential technologies. You can start with the ones shown in Figure 15-5 and add to it. Having a list like this one may help jog people’s memories and capture the gist of what you’re asking them to provide to you.
Beyond inventorying your company’s data technologies, you also need to inventory all of its data resources to see how you might be able to utilize them in a lowest-hanging-fruit use case.
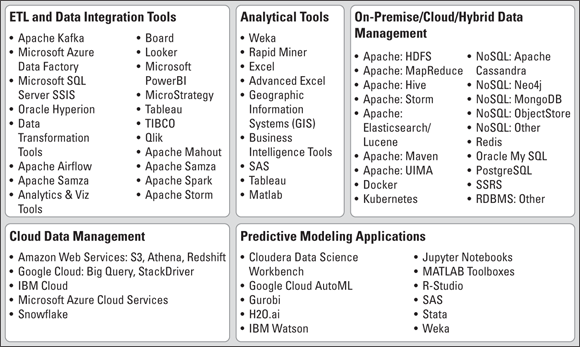
FIGURE 15-5: A list of popular data technologies, broken down according to function.
Inventorying Your Company’s Data Resources
It's a safe bet to say that, if your company doesn’t already own the data that’s required in order to implement a data science use case, that use case isn’t a lowest-hanging-fruit use case. That’s why you need to make sure you’re familiar with the data resources your company owns as well as with any known issues related to specific data sets within those resources. Only after you’ve collected and reviewed this information are you in a position to judge which potential data science use case truly represents the lowest-hanging fruit. In this section, you learn how to go about collecting the important information you need in order to leverage your company’s data resources effectively.
Requesting your data dictionary and inventory
To wrap your head around the data resources your company is now storing, start by requesting a data dictionary and an inventory. A data dictionary is a central reference source that describes the company’s data resources. Essentially, it's data that describes your company’s data resources. Pretty meta, right? Well, actually, it is meta. It’s metadata — the data that describes data sets. As shown in Figure 15-6, a data dictionary has a similar structure to the Merriam-Webster dictionary.
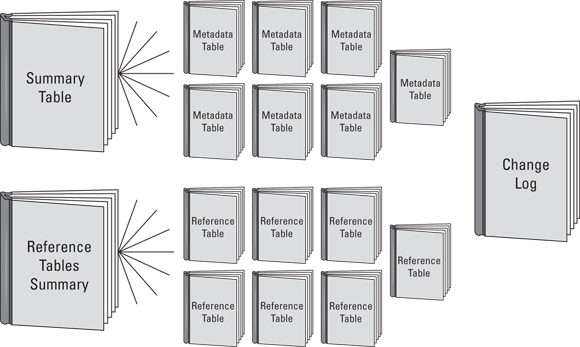
FIGURE 15-6: The structure of a data dictionary.
Metadata tables provide detailed descriptions of the company’s data in terms of the properties of each of the data elements. A reference table is a data table within the data dictionary that details the metadata describing the classification and description domains of the data defined within the data dictionary. Figure 15-7 shows how a data dictionary relates to the data sets it defines.

FIGURE 15-7: The relationship between a dataset and the data dictionary that describes it.
Once you get your hands on the data dictionary, give it a good once-over so that you gain a fundamental idea of which data sets to expect to hear about when you conduct surveys and interviews. This way, you can recognize when reported answers don’t align with what’s in the official file.
Confirming what’s officially on file
After collecting your data dictionary and giving it a cursory overview, the next thing you need to do is confirm what’s on file by conducting surveys and interviews. Here are some questions you can ask:
- What data do you have access to?
- Of the data sets to which you have access, which do you use regularly? Name and describe the data set.
- Does your work involve the utilization of any moving, streaming, or real-time data sources?
- Does your work involve any unstructured data sources? This might involve building analytics or insights from PDF files, Word files, video files, audio files, or HTML web pages, for example.
- Does your work involve using semistructured data sources? This might involve building analytics or insights from comma-separated values (.csv) files, tab-delimited files, log files, eXtensible Markup Language (XML) files, or JavaScript Object Notation (JSON) files.
- Does your work involve the utilization of sensor data?
- Is your work ever impeded by a lack of data access?
- Do you know of data within other business units that you could use to create more value, if you only had access to it?
- Do you have a clear record of how your data sets were captured, and when?
- What data quality issues have you encountered? How have you worked to resolve or address them?
- Does your work involve the use of data that stores personally identifiable information?
Unearthing data silos and data quality issues
There are a few sources of huge inherent risk to the success of any data science product. If the people who work at your company don’t trust your data solution, they will be hesitant to rely on it. You may face user adoption issues, where you spend months building a solution that, once complete, seldom gets used. Even if you deploy a top-down approach to try to force personnel to use a solution, if they don’t trust the results it generates, they may secretly waste time doing data analysis and processing manually to double-check that what the solution says is indeed correct.
Though lack of trust isn’t the only reason that technology adoption suffers, it can be a big one. When it comes to trust and reliability with respect to data resources, the lack of data quality can be a huge contributing factor. Data silos, the data storage practice where a company stores its data in separate, unique repositories for each business unit, only aggravate this issue.
Let me illustrate this problem with a fictitious example, illustrated in Figure 15-8.
Back in May 2017, your company stored a data set in its central repository (the source data set shown in Figure 15-8). Unfortunately, the data within that data set had formatting errors as well as some missing values. User A, from Marketing, came along in June 2017 and cleaned up the formatting issues with the data set. He stored a copy of the formatted data set on his desktop and also on the repository for his business unit (which isn’t the same central repository from whence he originally made a copy of the source data set). So now he has created two new versions of the file and saved them in two places that are known and understood only by him.

FIGURE 15-8: An example of data quality and silo issues.
User B, from Customer Service, comes along in June 2019. She finds the source data set on the central repository, and she, too, makes a copy of it. She reformats the data set (again), and then she goes one step further by using estimation techniques to fill in missing values. She’s totally unaware of the reformatting work that User A did, so she reformats according to her own standards, which happen to be quite different from the ones chosen by User A. User B stores two versions of the file on her desktop, and two versions of the file on the repository for her business unit. Those two versions correspond to the reformatted version and the filled-in version. So now she has created four versions of the file, saved in two places that are known and understood only by her.
User C’s situation is more mysterious. Also from Marketing, he originally made a copy of the source data set in 2018. Over time, he played with it, messed it up, tried to back out of his errors, reformatted it, and saved it in a heaping mess over on his desktop. That last time stamp on the data set says 2020, but he is sure that he has made no changes to it since 2018.
Is the problem clear yet? The source data set wasn’t clean, and it had missing values, so it wasn’t inherently trustworthy. Then three different employees from various business units come along and try to create value from it, thus creating duplicate versions of the data set — all with varying contents.
One big problem here is that, where possible, all the business units that access the data set should be able to use one another’s efforts. If everything were centralized, standardized, and well-documented, User B and C could have just used Users A’s reformatted version, without creating more file versions and without reinvesting more person-hours into a task that was already completed. This would solve the problem known as duplication of effort.
Here’s another glaring issue: After Users A, B, and C are done, the company has eight versions of the same file saved in six locations, spread across two business units and the central repository. Versions span two years. The source data set is of mediocre quality. User A’s reformatting is the best quality, but User B has filled in the missing values. No one knows which version of the data set is correct — if any of them is in fact correct. So, employees just keep taking the original source data and making their own versions. Eventually, no one knows exactly where the data actually came from, or whether it was ever any good in the first place. The data set and all the time and effort (and versions) that are wasted — no one trusts the data or wants to use it — and for this reason, no one can create value from it. The data set represents nothing but wasted effort for the company in terms of both employee-hours and operational expenses.
People-Mapping
When I talk about people-mapping, I’m talking about mapping out the structure of influential relationships, reach, and data skillset resources that are available within your company to help ensure that your data science project is a success. Resources aren’t just your company’s datasets, software packages, and hardware — resources are also measured by the level of expertise your people can bring to solving a problem.
Requesting organizational charts
Understanding organizational structure is an important part of understanding the people dynamic surrounding your future data science project. Be sure to ask for organizational charts. Get an executive-level organizational chart and an organizational chart for your particular business unit. (For one example of an organizational chart, see Figure 15-9.) After you’ve selected a use case — as discussed in Chapter 16 — be sure to also collect an organizational chart for the business units that your data science project will impact.
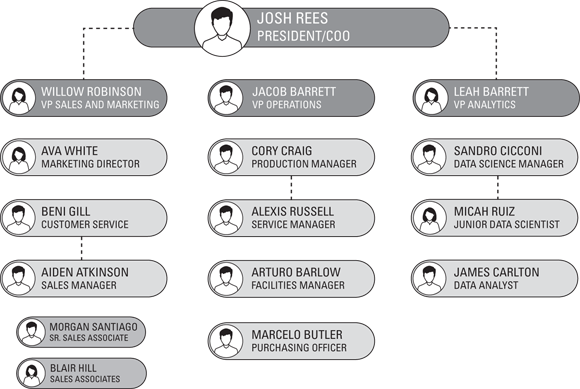
FIGURE 15-9: An organizational chart.
Surveying the skillsets of relevant personnel
To make maximum use of the data skillsets your company already has on hand, be sure to survey relevant existing employees.
When you survey personnel, you want to get a grasp on their data aptitudes and skills levels. You should ask questions about their formal education, which classes they took at university, and which technology skills they’ve utilized throughout the course of their careers. In terms of which exact skills and courses you can ask about, Figure 15-10 shows some good starter options.
For a closer look at the means and methodologies of surveys and interviews, check out the section “Making Information-Gathering Efficient,” later in this chapter.
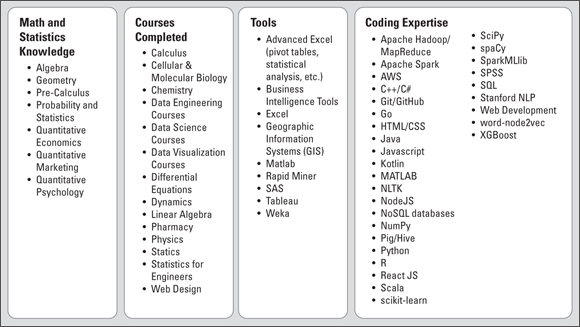
FIGURE 15-10: Some foundations from which great data professionals emerge.
Avoiding Classic Data Science Project Pitfalls
Two classic data science project pitfalls stem from (a) focusing too much on the data and technology and forgetting about the business and (b) failing to plan for the worst-case scenario.
Staying focused on the business, not on the tech
In the spirit of putting the business before the tech, let’s look at how you can uncover business problems that you can readily solve with data science. To do this, you would again want to use surveys and interviews — this time, to collect feedback from the following individuals:
- Employees and contractors whose work has been directly affected by an inability to obtain or utilize data in a timely manner: Get details about how the lack of data access has undermined their ability to get results.
- Organizational decision-makers and potential stakeholders: Request details about the sort of data-driven improvements they’d like to see in an ideal future. Ask about their decision-support needs and how well those are being met. Inquire into their level of data literacy,
- Data professionals: Ask them for their ideas on how the organization can make more effective use of data.
- HR managers: Ask about how employee attrition may be adversely affecting the organization and what key factors they think are driving this attrition. Ask about talent sourcing, any problems in talent management, and how they think it could be improved.
- Sales and marketing professionals: Ask for their thoughts on areas of opportunity with respect to marketing channels, sales optimization, and churn reduction.
- Business managers: Ask about how a lack of data availability or predictive capabilities may be adversely affecting team member productivity or team outcomes. Also, look for ways that business process inefficiencies are adversely affecting business unit performance.
- IT professionals: Collect documentation around security protocols, privacy policies, and current best practices that document the processes your company uses to ensure it meets General Data Protection Regulation (GDPR) requirements. More on GDPR in Chapter 16.
Drafting best practices to protect your data science project
Best practices are guidelines based on past experiences that, when put into practice, help protect and safeguard the success of future projects. To create best practices, you need to sit down with other personnel who have been part of past data and IT projects at your company. Speak with them about stumbling blocks that caused delays or failures in the past and why they believe these situations occurred. Ask them about what they think could have been done to avoid those setbacks in the first place. Ask them what people problems came up and how those problems adversely impacted the project. Ask them what technology components introduced the most risk to the overall success of their project. Make a list of these war stories.
After you’ve spoken to ten or so people about their experiences and opinions, compile their reports into one cohesive body of evidence. Review your findings and develop a set of best practices for your organization. How can you make your future data science project as efficient and effective as possible? Consider this from the perspective of both data skillsets and technology requirements. List at least three ways you can avoid implementation problems and delays. Describe which technology components are most likely to cause problems, and why. Describe three “people problems” that are likely to arise. Make sure your best practices are designed to help you preempt and prevent these potential problems. If you were to create at least ten rules to future-proof your future data science project, what would those rules be? Let those be your best practices.
Tuning In to Your Company’s Data Ethos
The last, but not least, important type of information you’ll want to collect about your company relates to its data ethics. When I say data ethics, I’m referring to both data privacy rights and AI ethics. Although data privacy laws are still nebulous and ever-changing, the data privacy industry is considerably more mature than the industry that is growing up around the need for greater oversight into AI ethics. Let’s have a look at data privacy first.
Collecting the official data privacy policy
During the information gathering mission across your company, be sure to collect any data privacy policies. Suffice it to say that your company’s data privacy policy should fall on the side of full disclosure and affirmative consent. These policies should be complete, equitable, and enforceable. Not only should they be enforceable, but your company should also have the apparatus in place to enforce them. If that isn’t the case, at this point it’s a good idea to collect information about what is causing data privacy enforcement gaps. For now, just collect all this information and set it aside. In Chapter 16, I have you look at how to get started assessing your company’s data privacy program.
Taking AI ethics into account
Obviously, if your project is the first-ever data science project at your company, you won’t need to collect information about AI ethics. In that case, your company would have no AI project around which you could evaluate past ethical behavior. In Chapter 16, I talk about what it means for a company’s AI to be ethical, and how to go about assessing the ethics of AI products and projects. For now, let’s look at what sort of information you need to collect about your company's AI projects in order to ascertain the ethical standard of those projects.
For AI to be ethical, it should be accountable, explainable, and unbiased. To assess the accountability of your company’s AI, start first by collecting the documentation that was published by the developers of the AI solution. Each solution should come with a report that documents the machine learning methodologies that the system deploys. Within that report, there should be model metadata that describes the models. This report should be open for all users to examine and evaluate. Snag that report and set it aside for now. I’ll tell you what to do with it in Chapter 16. If this report doesn’t exist, make note of that because this could become a serious problem one day.
Next collect the documentation that explains your AI solution in plain language. All AI solutions need a manual that explains how the predictions are actually generated by the machine. This manual needs to be in plain English, so all users and personnel can understand it without having to take a course in data literacy. Again, if this documentation doesn’t exist, jot that down.
Moving into the last characteristic of ethical AI, your AI solutions need to produce unbiased outcomes. This can be tough to assess. For now, just look out for any documentation within your company (probably in the form of emails or meeting minutes) that details any concerns with a bias implicitly built into your company’s AI solutions. If your AI solutions are provided by vendors, you can also do web research to track down any reports of biased outputs from the AI, as is common in AI domain applications, like healthcare.
Making Information-Gathering Efficient
Throughout this chapter, I talk a considerable amount about all the types of information you should collect about your company before looking into which data science use case might qualify as a low-hanging fruit. If not approached strategically, this type of information-gathering quest can go on for months and months, further extending your company’s time-to-value on the future data science project that will be born of these efforts. It doesn’t have to be that way. You can collect all the information you need by investing just in one or two weeks of effort.
It’s a little easier done than said, actually. Essentially, the process is to brainstorm, categorize, group, request, and receive the information in the form of email and/or survey responses.
All you need to do is plot out all the questions you need answered as well as the assets you need to collect in order to complete the information gathering process. Then, next to the question or asset request, detail from whom you need to request this information. (For an example of how this would work, see Figure 15-11.)
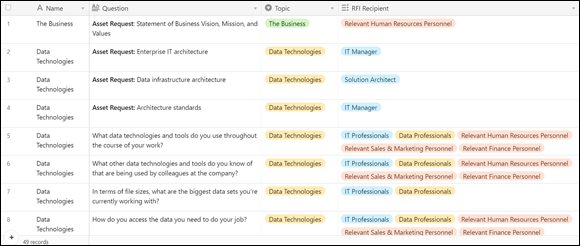
FIGURE 15-11: Questions and recipients inside my question-and-asset request database.
After you have all your questions and requests mapped out against the most appropriate recipients of those requests, you then filter the table by recipient to see who you need to send which questions to. Figure 15-12 shows the questions you may consider asking of relevant personnel in your finance department.
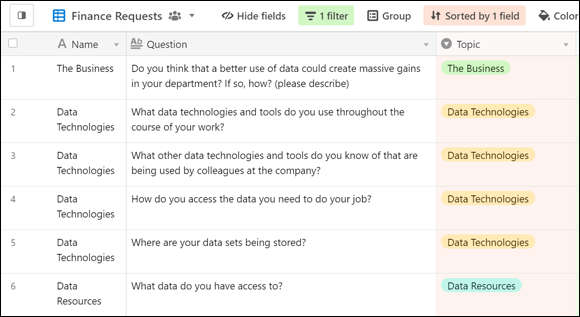
FIGURE 15-12: Some filtered questions, ready to send to relevant finance personnel.
You can then go in and, for each unique recipient group, just copy the appropriate questions and paste them into a survey tool. Proof them, and then send out a group email so that all appropriate members of that small recipient group receive a survey with the questions that are relevant to their specific role.
The questions in the following list are examples of what you might send to potential stakeholders and business unit managers:
- Do you feel confident that you're getting the data and analytics you need to support you in making the best-informed decision on behalf of the company? If not, what would you like improved?
- What sort of data-driven improvements would you like to see in an ideal future?
- How is the lack of data availability and/or predictive capabilities adversely affecting your team members' productivity or team outcomes?
- How are business process inefficiencies adversely affecting your business unit?
- On a scale from 1 to 10 (where 1 is completely uncomfortable), how comfortable do you feel with your current level of data literacy?
- Which data quality issues have you encountered? How have you worked to resolve or address those issues?
Once responses have been returned, start reviewing them. Look for some interesting responses and take note. These individuals may be people you should interview when you move into the assessment phase, which I talk about in Chapter 17.
 Anytime your company has to make new investments into data technologies, skillsets, or resources, financial risk is introduced in the case that the project fails to deliver its estimated ROI. Decrease this risk by seeking to make maximum use of the resources your company already has on hand.
 A business needs a mission and a vision. In this chapter, I take you one step further in the data science value chain by helping you ensure that your data science projects are profit-forming and, of equal importance, that these projects directly support your company's business vision.
 Some people call a data dictionary a metadata repository. No need for confusion! These terms mean the same thing.