Chapter 15: Using the VBA Debugging Tools
Access database applications prepared by even the very best developers have problems. By their very nature, database applications tend to be pretty complicated—especially by the time you consider table and query design, forms design and implementation, and all that VBA code that needs to be written for most databases. Something inevitably goes wrong and causes problems. If you’re lucky, the problem and its cause are obvious and easily fixed. A somewhat worse condition exists when you know there’s a problem but its source is not immediately apparent. The worst situation for all concerned are those bugs that silently and perniciously damage data or the representation of the data in an application without warning.
This chapter takes a look at the types of problems you’ll encounter in Access applications and some of the steps you can take to uncover and repair these critters. This chapter largely ignores the errors caused by poor design: misrepresentation of data caused by ill-designed queries, update and insert anomalies causes by inappropriate application of referential integrity rules, and so on. For the most part, these problems occur because of failing to conform to proper design disciplines, misunderstanding Access query design, and so on. We can’t do much to help you avoid these problems other than to encourage you to read—and reread—the chapters in Part I of this book.
What we can help you with, however, are the bugs that creep into your VBA code, particularly those bugs that cause noticeable problems with the data or user interface in your applications. Debugging Access VBA code is the focus of this chapter. This chapter assumes that you’re comfortable designing and implementing the data structures in your applications and that the tables, queries, and other structural components of your databases are not a source of problems.

This chapter is a departure from the other example files you’ve used in the book. The sample database file (Chapter15.accdb) contains the basic example code shown throughout this chapter. The code in Chapter15.accdb does not necessarily do anything useful. It’s provided mostly as a “test bench” for practicing with the Access debugging tools, rather than as good examples of practical VBA code.
Many of the statements in the examples have been commented out because they contain syntax errors and other types of problems. You may have to remove the single quotes in front of some of the example statements to experience the error or view the assistance already built into Microsoft Access.
There are many more examples in Chapter15.accdb than are described in the text of this chapter. After you read the chapter, go back through all of the examples and try them. You’ll learn more about debugging than you probably ever wanted to know, but the experience will serve you well as you develop and debug your programs.
It’s no secret that testing and debugging VBA programming statements takes quite a bit of time. Good developers easily spend a third of their time designing a program, another third writing code, and another third testing and debugging. Very often, it’s a good idea to have someone other than the developer test a program’s operation. A person who is unfamiliar with an application will often do something the developer never expected, leading to new and surprising bugs.
Testing and Debugging Your Applications
Testing Access applications is an ongoing process. Each time you switch a form or report from design view to normal view, or leave the VBA Editor to run a bit of code, you’re testing your application. Every time you write a line of code and move to another line, the VBA syntax parser checks the code you just wrote. Each time you change a property in a form or report and move your cursor to another property or another control, you’re testing the form or report.
Testing is the time to see if your application runs the way you intend, or even if it runs at all. When you run an application and it doesn’t work, you’ve found a bug. Fixing problems is most often referred to as debugging. This term dates back to the earliest electron tube computers. Legend has it that a moth shorted out an electrical circuit. The late Admiral Grace Hopper, an early pioneer in computing, coined the term debugging to describe the process of removing the moth.
You’ve already learned a lot about testing and debugging. When you run a report and no data appears, you’ve had to check the report’s RecordSource property to ensure that the report is pulling the correct data. You may have viewed the data in a query or table to see if the data source is the problem. If you run a form and you see #Name or #Error in individual controls, you’ve learned to check the control’s ControlSource property. Perhaps you have an incorrect reference to a table field or you spelled something wrong, and Access is unable to evaluate the reference.
Maybe you have too many parentheses in an expression, or you’ve used a control name in a formula that conflicts with an Access keyword. Each time you had this problem, you may have asked someone with more experience than you what the problem was, or perhaps you looked it up online or in a book, or you researched the syntax of the formula.
Most problems with query, form, and report design are pretty obvious. You know you have a problem when a query returns the wrong data, or a form or report fails to open or displays an error message as it opens. Behind the scenes, Access does a great deal to help you notice and rectify problems with your application’s design. When you run forms and reports, Access often reports an error if it finds something seriously, and obviously, wrong.
It’s much more difficult for Access to help you with incorrectly written code. Very often a problem in VBA code exists for months or even years before a user notices it. Even very poorly written code often runs without throwing errors or exhibiting obvious problems. However, determining exactly where a bug exists in VBA code, and figuring out what to do to repair the bug, can be very challenging. When you create VBA code, you’re pretty much on your own when it comes to detecting and resolving problems. Fortunately, there are a wide variety of tools built into the editor to help you.
Understanding the Sources of Errors
Generally speaking, VBA errors fall into two broad categories. Syntactical errors are usually easily fixed by consulting the online language reference or a good book (such as this one!). Logical errors are another issue altogether. Logical errors occur when code does not do what is intended, yet does not cause overt problems like crashing or displaying error messages. Most of the time that you spend debugging Access applications involves uncovering the causes and resolving the logical errors that inevitably creep into VBA code. A third category of error (runtime errors) can often be avoided through proper end-user training, building defensive routines into your code, and so on.
Syntactical errors
Syntax errors are caused by using the VBA language incorrectly, much like mispronouncing a sentence in a foreign language. By far the most common bug in Access VBA code is the simple syntactical error caused by misspelling a keyword or a variable name; or misusing a procedure, property, or method. These errors are so easy to detect and correct that Access includes an option to automatically check for syntax errors. Figure 15-1 shows the Options dialog box (Tools⇒Options while the VBA code editor window is open) open to the Editor tab. The Code Settings area in the upper-left quadrant of this dialog box contains a number of important options that help you write and debug the VBA code in your applications.
Notice the Auto Syntax Check check box in the Code Settings area. This option causes Access to check your code for syntax errors line by line as you type it into the code editor window. Figure 15-2 illustrates automatic syntax checking. In this figure, the MsgBox statement contains an error. Do you see it?
Figure 15-1
The Modules tab of the Options dialog box contains a number of important VBA coding options.
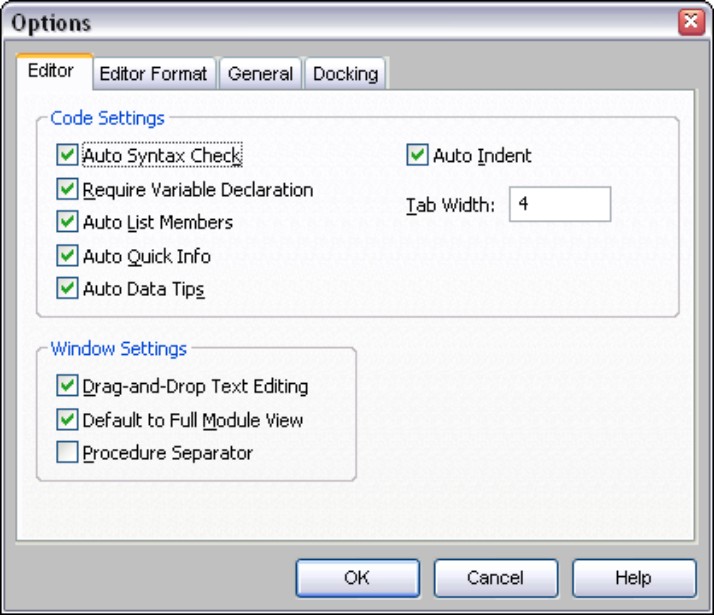
Figure 15-2
Automatic syntax checking can save you from simple bugs.
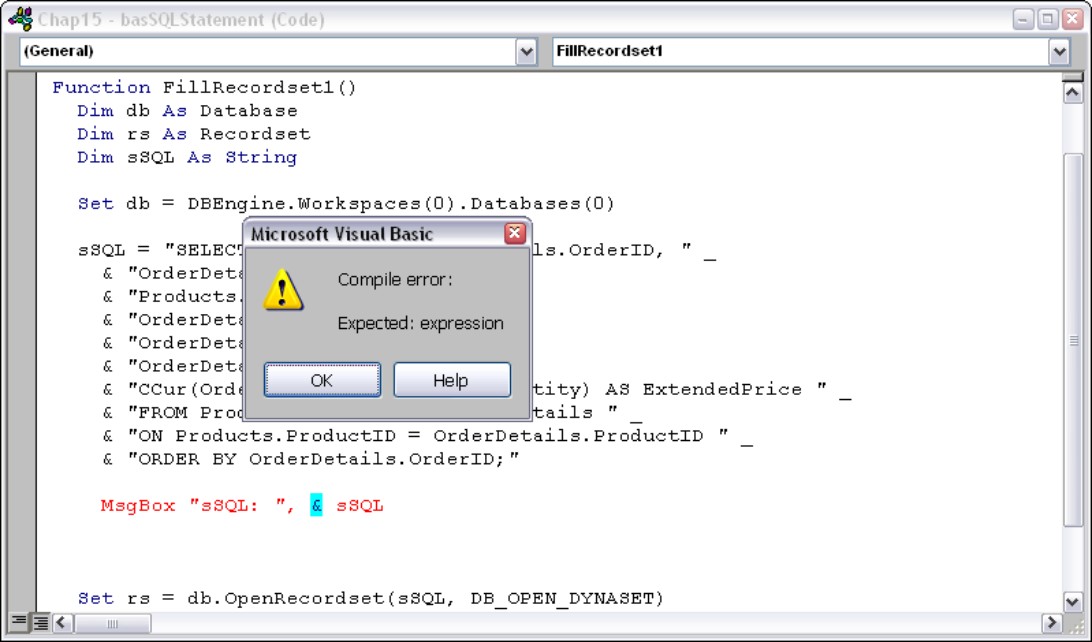
Notice the stray comma right after the “sSQL: “ portion of the MsgBox line. No comma is needed here because the arguments to the MsgBox statement are not separated with commas. (The arguments to the MsgBox function, however, are separated with commas!) Access detects the stray comma and displays the statement in a red typeface to tell you there’s a problem on that line. (If you don’t like red, you can change the color of Syntax Error Text in the Code Colors area of the Editor Format tab of the Options dialog box).
Fixing syntax errors is straightforward: Simply examine the line for a misspelling, stray character, missing quotation marks, and so on. Very often, syntax errors are introduced by using parentheses where they aren’t needed (or omitting them when they are necessary!), improperly placing square brackets, and so on.

Many syntax errors can be avoided by adhering to the naming conventions frequently mentioned in this book: avoid spaces in object names, use mixed-case names to make them easier to read, and so on. Anything you can do to make your code easier to understand goes a long way toward avoiding silly syntax errors.
Logical errors
Logical errors can be somewhat more difficult to detect and remove. A logical bug occurs because of some mathematical error, misuse of the data in a record set, or other problem dealing with the data or program flow in the application.
Logical errors can be extremely dangerous and expensive if they go undetected for very long. Consider an application that calculates sales tax and adds the sales tax amount to invoices. Obviously, the sales tax must be calculated correctly or the customer will pay the wrong sales tax amount. The tax collector expects to collect the correct amount, even for customers who underpaid sales taxes on every sale during the fiscal year. Such an error can be very costly to a company in terms of extra expenses, fines, interest, and other penalties.
Here’s another example of a logical error: Consider a situation in which a patient management program assumes that the user has entered both the first name and last name of the patient. After all, the patient data-entry form contains text boxes for both these values, so the user will certainly make sure both values are filled in, right? For perfectly valid reasons (for instance, an patient too young to know her own name or an elderly patient who can’t recall his last name) either of these values may be missing from the data. A text box left empty contains a null value unless a default value has been provided. A logical error is generated when the application then tries to use the patient’s first name in a find or sorting operation. If you’re lucky, the logical error will be noticed by the user (perhaps through a pop-up dialog box or error message) and corrected before the data is committed to the database.
Other logical errors are created when an application incorrectly calculates the days between dates, uses the wrong value in a division or multiplication operation, and so on. Virtually any time data is mishandled or inappropriately used in your application, a logical error results.
Logical errors often require extensive debugging effort to correct. It goes without saying that debugging a complex application with many different forms and reports is more difficult than debugging a simple, straightforward desktop application.
Runtime errors
Runtime errors are usually traceable to some hardware failure. A hard-drive crash, of course, is an easily recognized runtime failure. Other runtime errors may be more subtle and difficult to deal with. For instance, a network glitch may cause data loss or make lookup data temporarily unavailable. Running out of swap disk space makes Windows run erratically or crash. Many computers are equipped with marginal memory, making it difficult or impossible to run large queries or use the built-in Access wizards.

Avoiding and dealing with runtime errors is difficult. There are many Windows application program interface (API) calls for performing system tests such as reporting free disk space, and checking the network. Chapter 30 discusses how to add Windows API function calls to your applications, including things like checking for available disk space. The examples in Chapter 30 are easily added to any Access application and may help you determine when the user’s computer has run out of disk space or encountered other hardware failures.
A second approach to avoiding runtime errors is to keep the database’s .data file (mdb or accdb) well-maintained. Compact the data file frequently, particularly if data is frequently deleted or modified. The built-in repair utility is also useful for ensuring the physical integrity of the data file on the hard drive. Both the Compact and Repair commands are available by choosing the Manage tab on the Office menu (opened by clicking the large, round button in the upper-left corner of the main Access screen).
Avoiding errors
It shouldn’t come as any surprise that your coding habits have a lot to do with the errors you encounter in your applications. Very often, the adoption of simple coding conventions eliminate all but the toughest syntax and logical errors in VBA code.
One coding suggestion is to put but a single variable declaration on a line of code. Consider the code you see in Figure 15-3. Although it’s perfectly permissible to put all nine variable declarations together as a single Dim statement, you must scan the entire line to find the declaration of each of the variables.
Figure 15-3
Multiple declarations on a line make finding a variable’s Dim statement difficult.
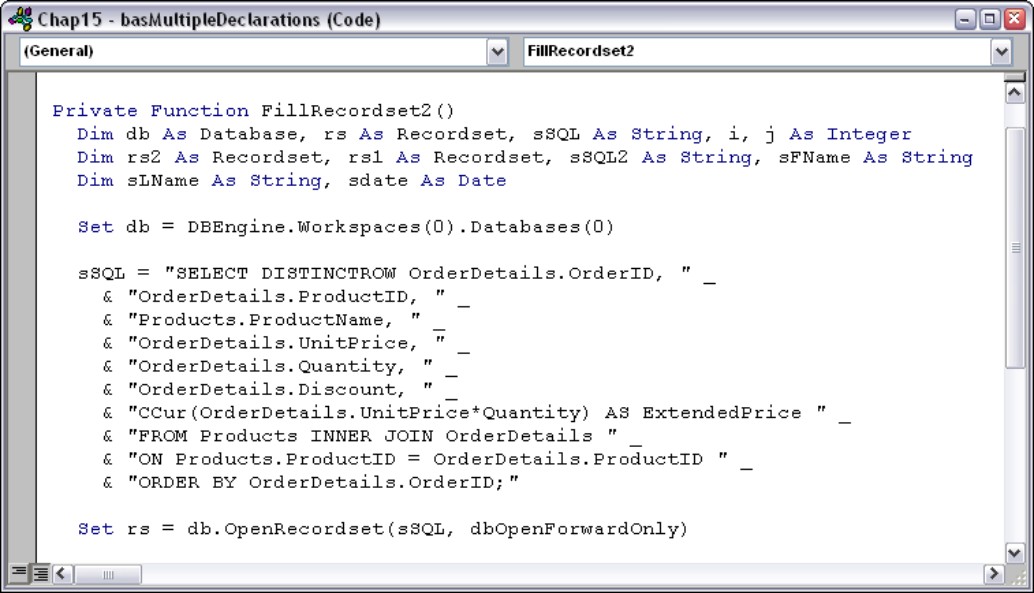
The problem in Figure 15-3 is that it’s far too easy to overlook a variable or to misunderstand the data type assigned to a variable. It’s quite easy to create a bug by assigning a variable an incorrect value. Other errors are caused by using a variable in an inappropriate context, such as using a string variable in a mathematical expression. In this particular case, VBA will use a numeric value stored in the string variable without throwing an error, but a runtime error is thrown if the string variable contains a text value (such as a person’s name).
The long declaration in Figure 15-3 contains another, more subtle error. Notice that the declaration contains i, j As Integer at the end of the statement. Apparently the programmer intended that both i and j are declared as the Integer data type, but this is not what actually happens. VBA requires the As <DataType> clause for each variable declaration. If the As <DataType> is omitted, the variable is established as a Variant data type. Although the code you see in Figure 15-3 runs without errors, because the i variable is a variant, the code runs somewhat more slowly than it would if i were an Integer.
Figure 15-4 shows the same declarations reconfigured as multiple Dim statements. It’s much easier to see the data type of the rs1 variable in Figure 15-4. Let your eye run down the list of variable names until you reach rs1 and see that it’s a Recordset type variable. This is another reason why short, descriptive variable names are preferred over long descriptive names.
Figure 15-4
Single-variable Dim statements are easier to work with than declaring several variables as a single VBA statement.

A second, less obvious change in Figure 15-4 is the fact that variables are grouped by data type. All of the Recordset variables are grouped together as are the Integer variables. You could carry this grouping one step farther by sorting the variables alphabetically by data type.
Spreading out your variable declarations does not appreciably affect compile times or runtimes. There is no difference in code module size once the code has been reduced to a binary format by the Access VBA compiler. In other words, there is nothing to be gained by condensing variable declarations into a few lines of code. Spreading out variable declarations makes them much easier to read without sacrificing execution or compilation speed.
Using the Module Options
The Editor tab in the Options dialog box (refer to Figure 15-1) contains a number of options that are important to the integrity of your VBA code. These options are summarized in the following sections.
The only drawback to the auto help built into Access 2007 is that the popup messages and help is sometimes obtrusive. But you can easily turn off these help features in the Modules tab. Also, on slow computers there can be a noticeable delay while Access retrieves the auto help. If you discover that the help you receive is not worth the wait, consider turning off the auto help features.
Auto Syntax Check
When you select the Auto Syntax Check option, Access checks each line of code for syntax errors as you enter it in the code editor. Most of the syntax errors caught by Auto Syntax Check are the most obvious spelling errors, missing commas, and so on. It will not catch more subtle errors such as data type mismatch, and, of course, it won’t catch logical errors.
Most Access developers leave Auto Syntax Check unselected. This option causes a message box to pop up over your code whenever Access detects a syntax error in your VBA statements. Access also turns the erroneous statement to red to indicate a problem whether or not Auto Syntax Check is selected. Most developers find that turning the statement to red is enough indication of a problem, and they don’t want to be interrupted by the message box.
Break on All Errors
Break on All Errors forces Access stops at each and every error (regardless of the error handling you may have added to your application) to allow you to debug the statement generating the error. During the development process, you’ll want to see errors as they occur instead of relying on the error handling you built into your code to make sure you understand what’s generating the errors.

Be sure to turn this option off before distributing the application to its end users.
Require Variable Declaration
The Require Variable Declaration setting automatically inserts the Option Explicit directive into all VBA modules in your Access application. This means, of course, that all variables must be explicitly declared (with the Dim, Private, Public, or Static keyword) before they’re used. This option is selected by default and is preferred by most experienced Access developers.
Compile on Demand
Compile on Demand instructs Access to compile modules only when their functions are required somewhere else in the database. When this option is unchecked, all modules are compiled any time any function is called. Unchecking this option makes sure that you see all errors that are detected by the compiler each time you make changes to the modules in your application. If you leave this option selected, the Access compiler will not recompile all of the code in the application, which means that some errors may slip through.
Auto List Members
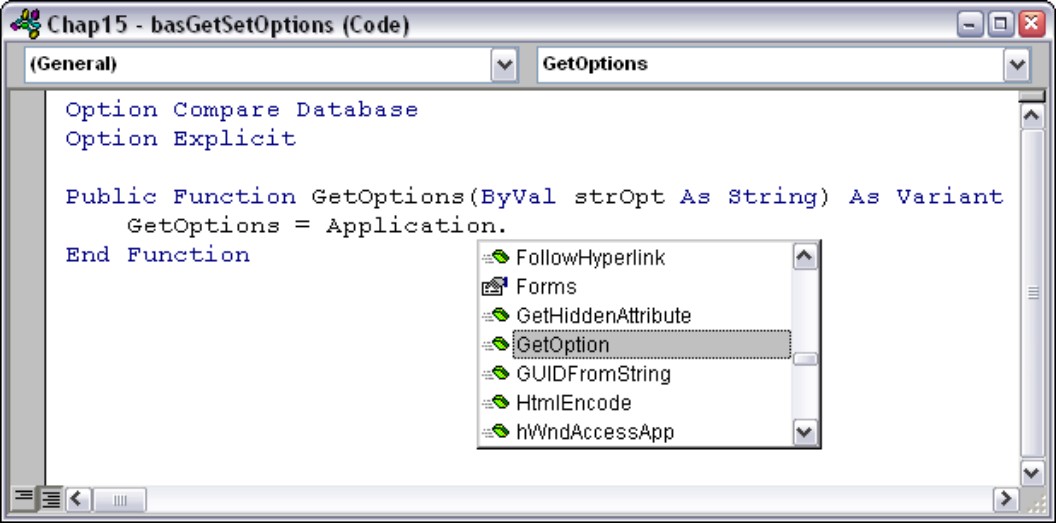
This option pops up a list box containing the members of an object’s object hierarchy in the code window. In Figure 15-5, you can see the list of Application objects that appeared as soon as I typed the period following Application in the VBA statement. It’s your choice to locate an item in this list and select it or to continue typing in the object reference.
Figure 15-5
Auto List Members makes it easy to recall the members of an object’s object hierarchy.
Auto Quick Info
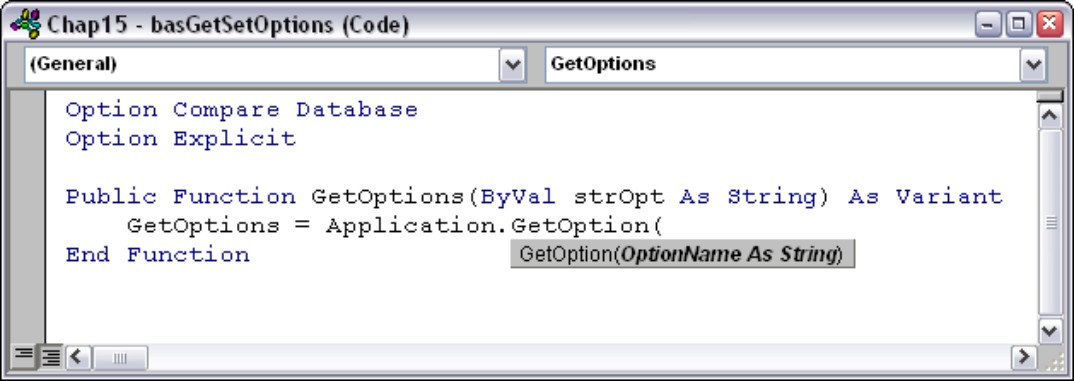
When you select Auto Quick Info, Access pops up syntax help (see Figure 15-6) when you enter the name of a procedure (function, subroutine, or method) followed by a period, space, or opening parenthesis. The procedure can be a built-in function or subroutine or one that you’ve written yourself in Access VBA. This option helps you learn and understand the proper syntax of each command and method.
Figure 15-6
Auto Quick Info provides syntax reminders in the module window.
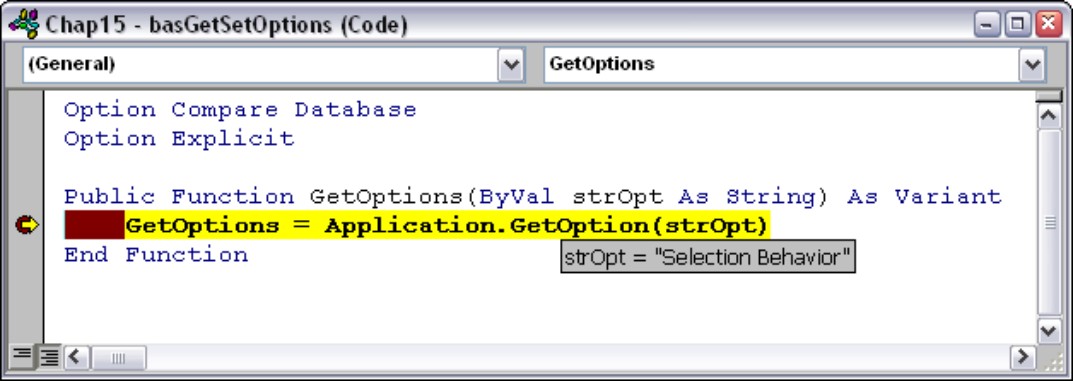
Auto Data Tips
Figure 15-7 shows Auto Data Tips in action. This option displays the value of variables when you hold the mouse cursor over a variable with the module in break mode. Auto Data Tips is an alternative to setting a watch on the variable and flipping to the Immediate window when Access reaches the break point. (You can find out more about watches in the “Setting watches” section, later in this chapter.)
Figure 15-7
Auto List Members makes it easy to recall the members of an object’s object hierarchy.
Compiling VBA Code
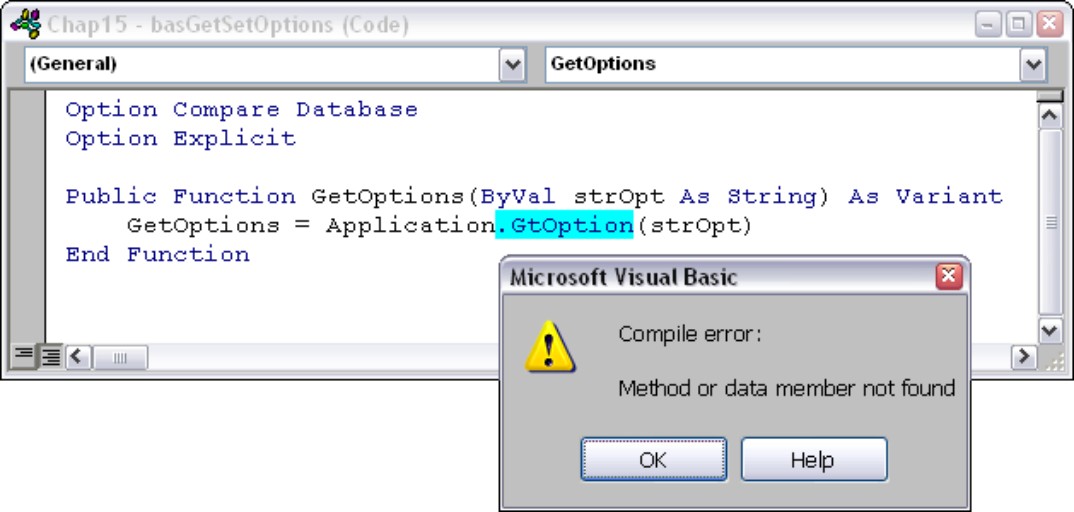
After you create a subprocedure or function and want to make sure that all of your syntax is correct, you should compile your procedures by choosing Debug⇒Compile <Project Name> from the VBA code editor window menu (where <Project Name> is the name of the project set in the Tools⇒Project dialog box). This action checks your code for errors and also converts the programs to a form that your computer can understand. If the compile operation is not successful, an error window appears, as shown in Figure 15-8.
This level of checking is more stringent than the single-line syntax checker. Variables are checked for proper references and type. Each statement is checked for all proper parameters. All text strings are checked for proper delimiters such as the quote marks surrounding text string. Figure 15-8 illustrates a typical compile-time error. In this case, the name of a method (GetOption) has been misspelled, and the compiler is unable to resolve the misspelled reference.
Figure 15-8
Viewing a compile error
Access compiles all currently uncompiled procedures, not just the one you’re currently viewing. If you receive a compilation error, you should immediately modify the code to rectify the problem. Then try to compile the procedure again. If there are further compile errors, you’ll see the next error.
Unfortunately, the VBA compiler reports compilation errors one at a time. Most other compilers (such as the compilers in Visual Studio .NET) show you as many errors as they find during compilation.
When your application is compiled, you can’t choose Debug⇒Compile. Before implementing an application at the customer’s site, you should make sure that your application is compiled.
Your database is named with a standard Windows name, such as Chapter15.accdb, but there is an internal project name that Microsoft Access uses to reference the VBA code in your application. You’ll see this name when you compile your database. When the database file is first created, the project name and the Windows filename will be the same. The project name is not changed when you change the Windows filename. You can change the project name by choosing Tools⇒<Project Name> Properties (where <Project Name> is the current internal project name).
Compiling your database only makes sure that you have no syntax errors. The compiler can only check for language problems by first recognizing the VBA statement and then checking to see that you specify the right number of options and in the right order. The VBA compiler cannot detect logical errors in your code, and certainly cannot help with runtime problems.
After you compile your program, you should also compact your database. Every time you make a change to your program, Access stores both the changes and the original version. When you compile your program, it may double in size as the compiled and uncompiled versions of your code are stored. Compacting the database will reduce the size of the database by as much as 80 to 90 percent, because it eliminates all previous versions internally.
Traditional Debugging Techniques
There are two widely used debugging techniques that have been available since Access 1.0. The first is to insert MsgBox statements to display the value of variables, procedure names, and so on. The second common technique is to insert Debug.Print statements to output messages to the Immediate window.
Using MsgBox
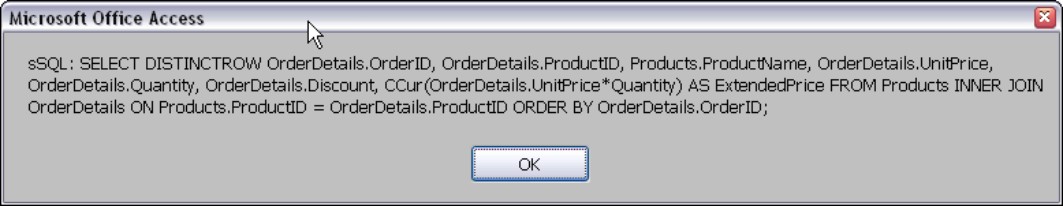
Figure 15-9 shows an example of a MsgBox statement and the message box produced by the statement. In this example a long SQL statement is displayed in a message box to enable the developer to verify the statement was properly composed by the application.
Figure 15-9
The MsgBox statement makes a satisfactory debugging tool (with some limitations).
The advantages of using the MsgBox statement are obvious. MsgBox is easy to use and can be used to output virtually any type of data. The message box itself pops up right on the user interface, and you don’t have to have the Immediate window open or flip to the Immediate window to view the message box. Also, the MsgBox statement is simple and easy to use and only occupies a single line of code.
There are also some problems associated with MsgBox statements. Never, ever forget to remove all MsgBox statements from your code before shipping to end users. There is nothing about the MsgBox statement to prevent it from popping up in front of an end user, causing all kinds of confusion and other problems. Also, message boxes are modal, which means you cannot flip to the code editor window or Immediate window to examine the value of variables or examine the code underlying the application. Using the MsgBox statement is an all-or-nothing proposition (with one exception described in the next section).
Using compiler directives
A refinement of the MsgBox technique is to use compiler directives to suppress the MsgBox statements unless a special type of constant has been set in the code or within the Access environment. Examine the code in Figure 15-10. Notice the #Const compiler directive above the MsgBox statement and the #If and #End If directives surrounding the MsgBox statement.
Figure 15-10
Compiler directives make it easy to include or exclude blocks of code from an application.
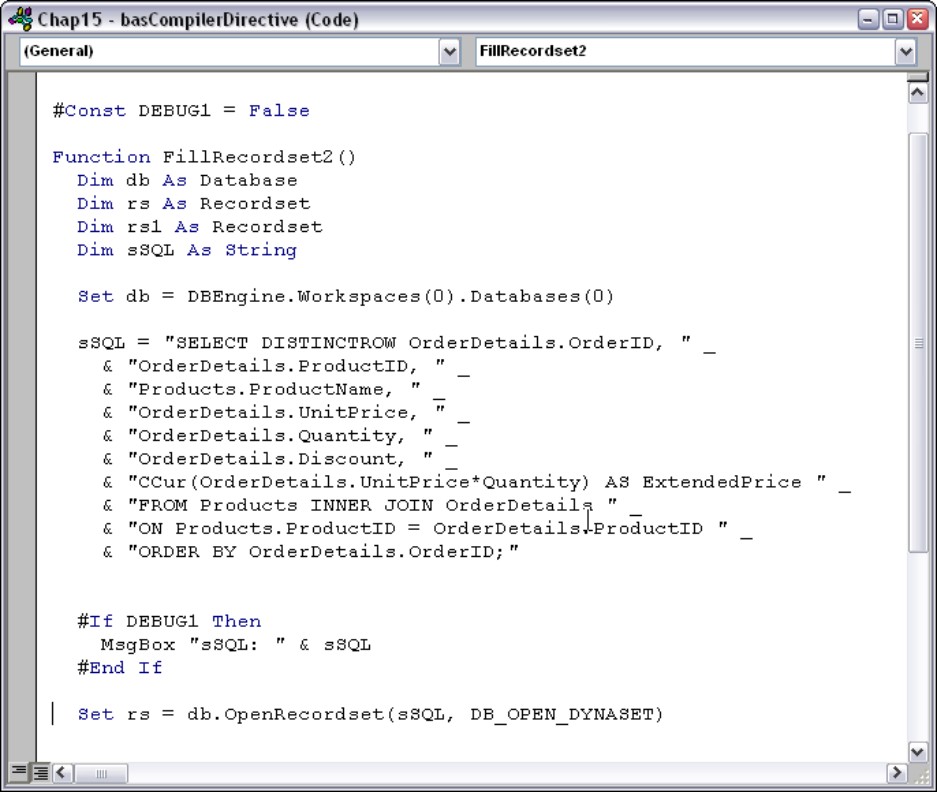
All of the keywords beginning with the pound sign (#) are seen only by the VBA compiler. These keywords (#Const, #If, #Else, and #End If) constitute directives to the VBA compiler to include (or exclude) certain statements in the compiled version of your project.
The #Const directive you see in Figure 15-10 can appear anywhere in the module as long as it is placed above the #If directive. The logical place for the #Const is in the module’s declaration section, since #Const values are global to the module. In Figure 15-10, the compiler constant is set to True, which means the statements between #If and #End If will be compiled into the application’s VBA project. In this case, the MsgBox statement is processed and appears in the user interface. Removing the #Const directive (perhaps by commenting it out) or setting its value to False suppresses the MsgBox statement.
Obviously, compiler directives are used for statements other than MsgBox. You could, for instance, use compiler directives to conditionally compile features, additional help, or other capabilities into an application. Compiler directives are particularly effective for suppressing MsgBox statements that are used for debugging purposes and must be squelched before giving the application to users.
Perhaps the biggest impediment to using compiler constants is that the #Const statement is module-level in scope. A compiler constant declared in one module is not seen by other modules in the application. This means that you must add the same compiler constants to every module you want to employ conditional compilation.
Access provides the Conditional Compilation Arguments option in the General tab of the application’s Project Properties dialog box (Tools⇒<Application Name> Properties) to get around this constraint. As shown in Figure 15-11, you use the Conditional Compilation Arguments section to specify any number of compiler constants that apply to the entire application. These settings make it very easy to toggle conditional compilation from a single location in the application, instead of changing the #Const statements in every module.
Figure 15-11
The Project Properties dialog provides a convenient way to set conditional compilation arguments for the entire application.
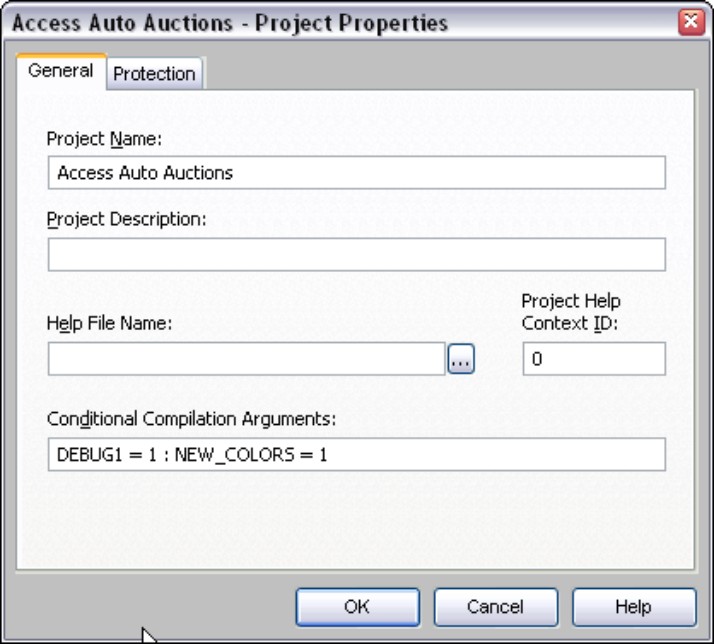
The Conditional Compilation Arguments and other settings set in the Project Properties dialog are relevant only to the current application. Unlike the options you set in the Tools⇒Options dialog, the Project Properties settings are not shared among multiple Access applications.
In Figure 15-11, notice that the values assigned to the Conditional Compilation Arguments are all numeric. Assigning zero to a Conditional Compilation Argument sets the argument’s logical value to False. Any nonzero value is interpreted as True. You cannot use the words “True” and “False” in the Conditional Compilation Arguments setting in the Project Properties dialog box.
If you’re confused about the conflicting terminologies applied to the VBA conditional compilation feature, you’re not alone. In a VBA code module, you assign conditional compilation constants using the #Const keyword, yet in the Project Properties dialog box you set Conditional Compilation Arguments. Also, you assign the True and False keywords to conditional compilation constants in a VBA module, but use 1 and 0 to assign True and False, respectively, to conditional compilation arguments. This is one place where the terminology and syntax used for the same purpose are quite different in different parts of an Access VBA project.
Using Debug.Print
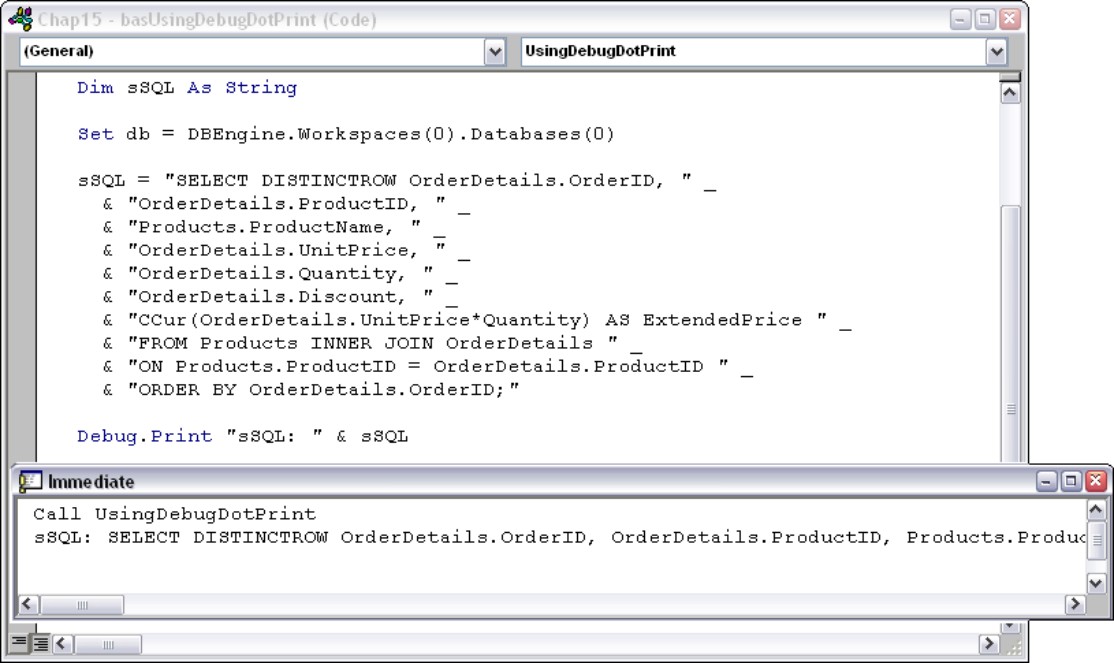
The second commonly used debugging statement is using Debug.Print to output messages to the Immediate window. (Print is actually a method of the Debug object.) Figure 15-12 shows how the sSQL variable appears in the Immediate window.
Figure 15-12
Use Debug.Print to output messages to the Immediate window.
Unlike the MsgBox statement, you don’t have to do anything special to suppress its output from the user interface. The output of Debug.Print only goes to the Immediate window, and because end users never see the Immediate window, you don’t have to worry about a user encountering debug messages.
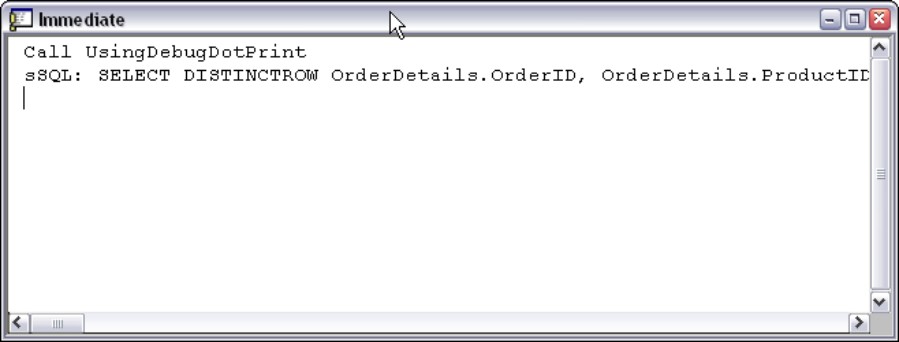
The problems with Debug.Print are obvious from Figure 15-12. Long strings do not wrap in the Immediate window. Also, the Immediate window must be brought to the top in order for you to view its output. But these limitations are relatively harmless and you’ll frequently use Debug.Print in your applications.
Some people have reported that excessive numbers of Debug.Print statements can slow an application. Even though the Immediate window is not visible, Access executes the Debug.Print statements it finds in its code. You might consider surrounding each Debug.Print statement with the compiler directives described in the preceding section to remove them from the end user’s copy of the application.
Using the Access Debugging Tools
Access 2007 features full debugging capabilities. Access 2007 includes a full complement of debugging tools and other capabilities.
Getting to know the Immediate window
Open the Immediate window (also called the Debug window) by choosing View⇒Immediate or by pressing Ctrl+G. You can open the Immediate window any time. (For instance, you can open the Immediate window while you’re working on a form’s design.) You’ll sometimes find it useful to test a line of code or run a procedure (both of which are supported by the Immediate window) while you’re working on a form or report.
The Immediate window is shown in Figure 15-13. The Immediate window permits certain interactivity with the code and provides an output area for Debug.Print statements.
Figure 15-13
Get to know the Immediate window! You’ll use it a lot in Access 2007.
The basic debugging procedures include stopping execution so that you can examine code and variables, dynamically watching variable values, and stepping through code.
Running code with the Immediate window
One of the most basic uses of the Immediate window is to run code, such as built-in functions, or subroutines and functions that you’ve written. Figure 15-14 shows several examples of code that has been run in the Immediate window.
Figure 15-14
Running code from the Immediate window is a common operation.
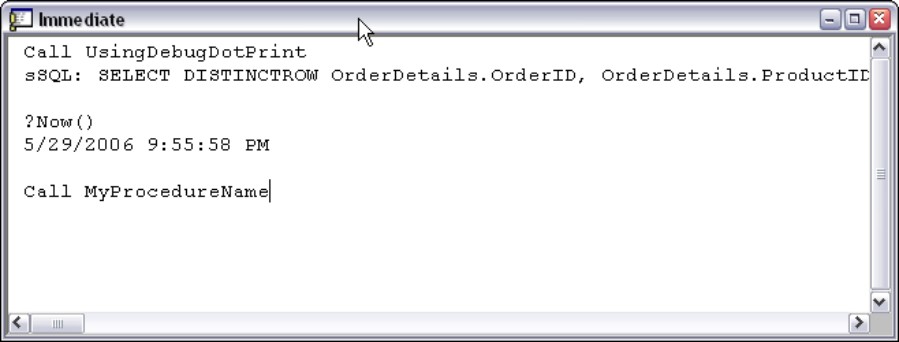
The Now() function has been run at the top of the Immediate window, returning the current date and time. The question mark (?) in front of the Now() function name is a directive to the Immediate window to display (or print) the value returned by Now(). The second example in Figure 15-14 shows the same convention used to run a function that’s been added to the VBA project. You see the result of the function’s execution, as long as the function is declared with the Public keyword, and any arguments required by the function are provided.
The third example in Figure 15-14 shows calling a subroutine from the Immediate window. Because subroutines do not return values, the question mark is not used. The Call keyword is optional when calling subroutines, but it’s often included for clarity.
Suspending execution with breakpoints
You suspend execution by setting a breakpoint in the code. When Access encounters a breakpoint, execution immediately stops, allowing you to switch to the Immediate window to set or examine the value of variables.
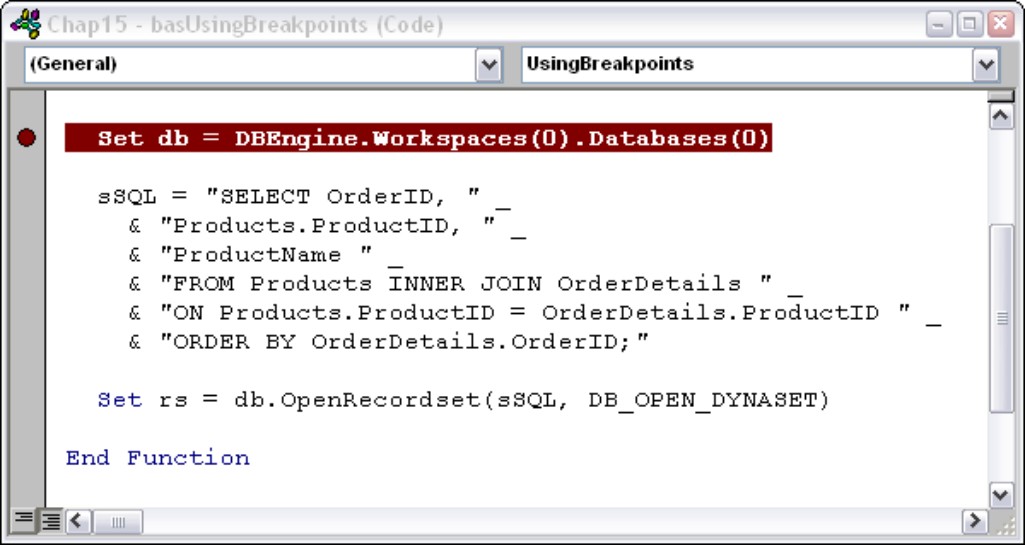
Setting a breakpoint is easy. Open the code window and click on the gray Margin Indicator bar to the left of the statement on which you want execution to stop (see Figure 15-15). Alternatively, position the cursor on the line and click on the Breakpoint button. The breakpoint itself appears as a large brown dot in the gray bar along the left edge of the code window and as a brown highlight behind the code. The text of the breakpoint statement appears in a bold font. (All of these colors and font characteristics can be changed in the Modules tab of the Options dialog box.)
Removing a breakpoint involves nothing more than clicking on the breakpoint indicator in the Margin Indicator bar. Breakpoints are also automatically removed when you close the module.
Figure 15-15
Setting a breakpoint is easy.

When execution reaches the breakpoint, Access halts execution and opens the module at the breakpoint (see Figure 15-16). You now use the Immediate window to examine the values of variables and perform other operations, or use any of the other debugging tools described in this section. Neither the code window nor the Immediate window are modal, so you still have full access to the development environment.
Figure 15-16
Execution stops on the breakpoint.
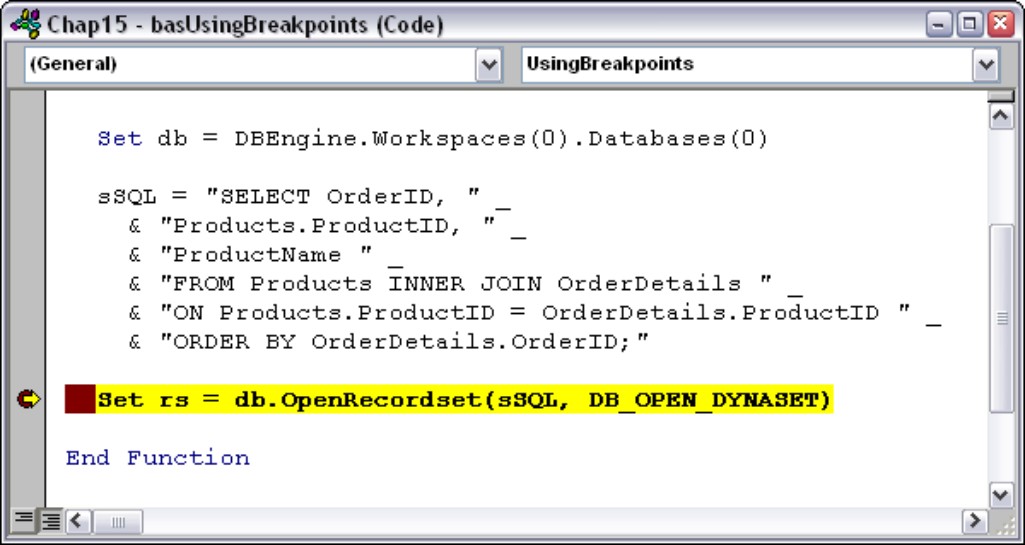
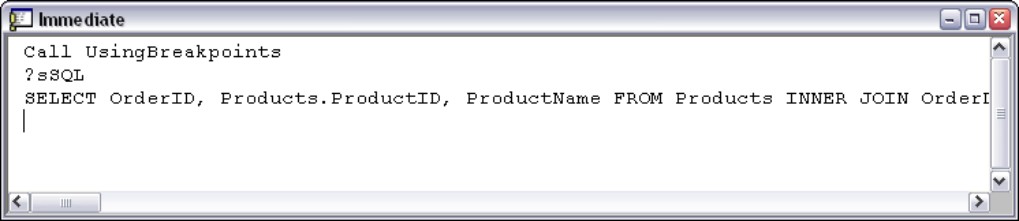
Figure 15-17 illustrates two techniques for viewing the values of variables while execution is stopped at a breakpoint. The Locals window contains the names and current values of all the variables in the current procedure. If you want to see the value of a variable in a slightly different format, use the Debug print command (?) to display the variable’s value in the Immediate window. In Figure 15-17, the value of sSQL is displayed in the Immediate window.
Figure 15-17
The Immediate window contains a lot of valuable information.
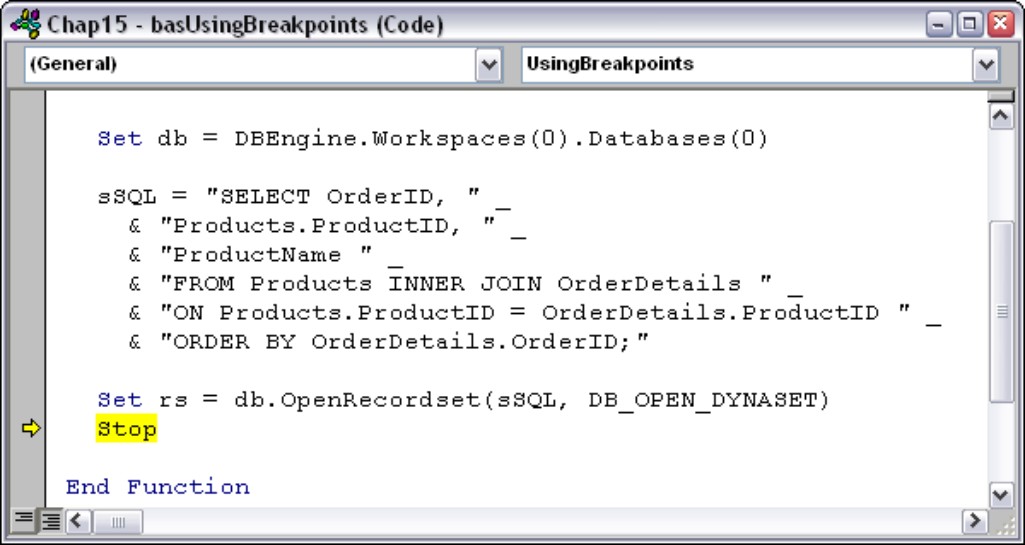
An alternative to setting breakpoints is to use Stop statements. The Stop statement halts execution but is more permanent than breakpoints. A Stop statement, like any other VBA statement, persists from session to session until explicitly removed. You can, however, surround the Stop statement with conditional compilation expressions and toggle their action by changing the value assigned to a conditional compilation constant. Figure 15-18 illustrates using the Stop statement.
Figure 15-18
Stop statements are a type of permanent breakpoint.
Stepping through statements
The most fundamental operation at a breakpoint is to walk through the code, one statement at a time, to view what’s happening to the application’s logic and variables. Once you’ve reached a breakpoint, you use a few keystroke combinations to control the execution of the application. You’re able to step through code one statement at a time, automatically walk through the local procedure, or step over the procedure and continue execution on the “other side” of the procedure.
In Figure 15-19, a breakpoint has been inserted near the top of the FillRecordset1() function. When execution reaches this point a break asserts itself, allowing us to take control of program execution.
Figure 15-19
Insert a breakpoint near the location of the code you want to step through.
In Figure 15-20, the break has occurred and we’ve clicked on the Step Into button (or pressed F8). The Step Into button executes the next statement in the program’s flow of execution. In this case, the SQL statement is composed and assigned to sSQL. If we wanted to view the value of sSQL at this point, we could flip to the Immediate window (Ctrl+G) and use ?sSQL to print its value in the Immediate window. We could also have a watch set on sSQL and view its value in the Watch window (described in the section titled “Setting watches,” later in this chapter).
Figure 15-20
Step Into executes one line at a time.
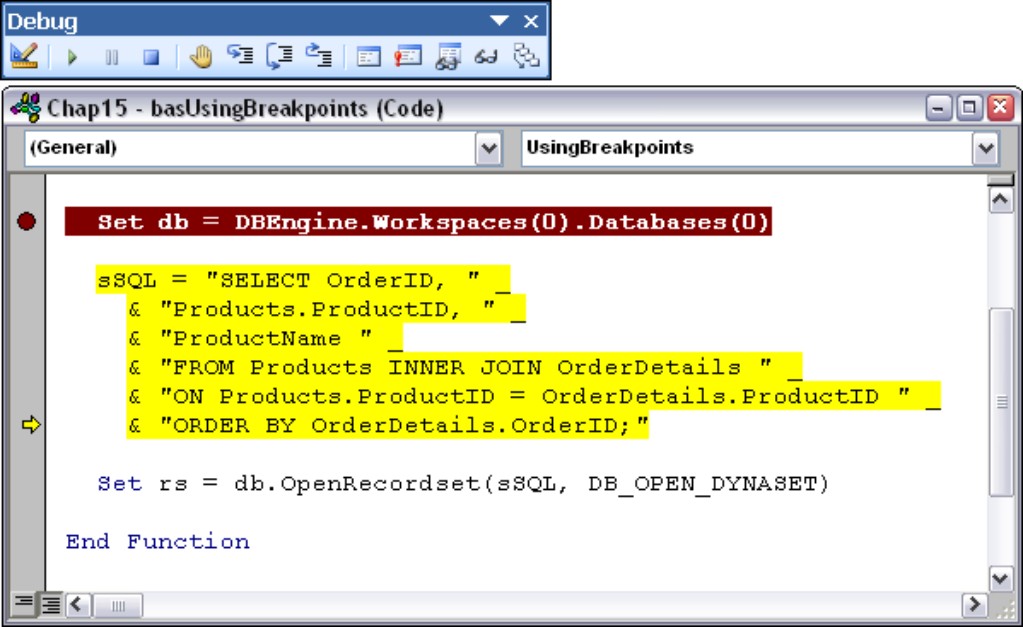
Notice the execution pointer (a yellow arrow) in the Margin Indicator bar pointing at the last line of the SQL statement. This arrow tells you where execution is actually stopped. The line pointed to by the arrow has not yet executed, so any action performed in the statement has not occurred.
Consecutive clicks on the Step Into button (or pressing F8) walks through the code one statement at a time. If a statement includes a call to another procedure, you’ll be taken to that procedure and walked through it. If you want, you can use the Step Over button (or press Shift+F8) to step “through” the called routine. If you’ve previously debugged the called routine and you’re sure it contains no errors, there is no reason to walk through its code. The code in the called routine is actually executed when you click on the Step Over button, changing any variables involved.
Once you’re satisfied that you don’t need to continue walking through the code, click on the Step Out button (or press Ctrl+F8) to complete the procedure. The Step Out button is handy if you’ve stepped into a called routine and you’re sure there’s nothing interesting going on in it.
One very nice feature in Access 2007 is the Auto Data Tips option in the Modules tab in the Options dialog box. With this option selected, you’re able to view the value of any variable in a tooltip-like window by hovering the mouse pointer over the variable’s name in the module window (see Figure 15-21).
Figure 15-21
Auto Data Tips are a powerful tool for debugging.
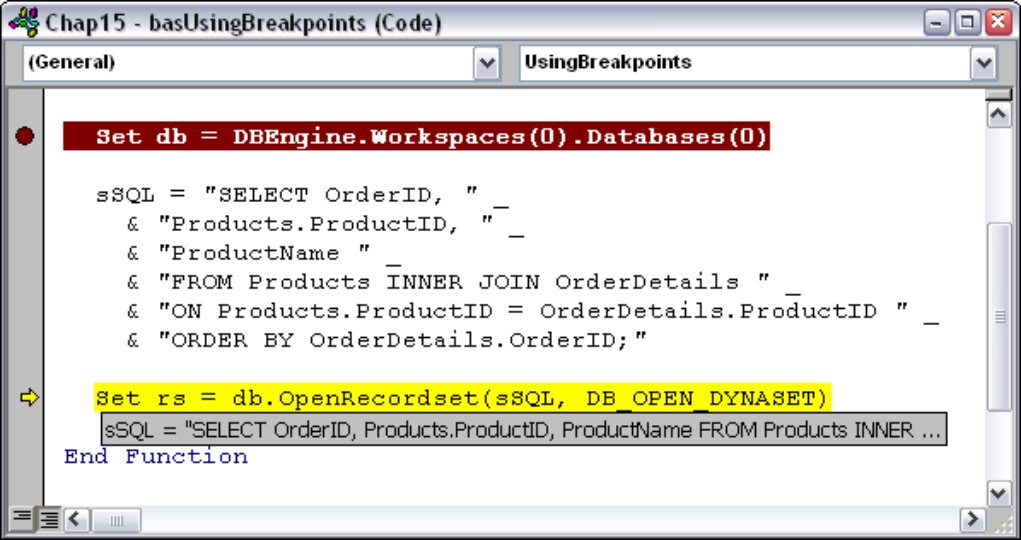
Keep in mind that the Auto Data Tips option must be selected in the Modules tab for the data tip you see in Figure 15-21 to appear.
Using the Locals window
The Locals window (View⇒Locals Window) shows all variables that are currently in scope, saving you from having to examine each variable one at a time. The variable’s name, its data type, and its current value are displayed.
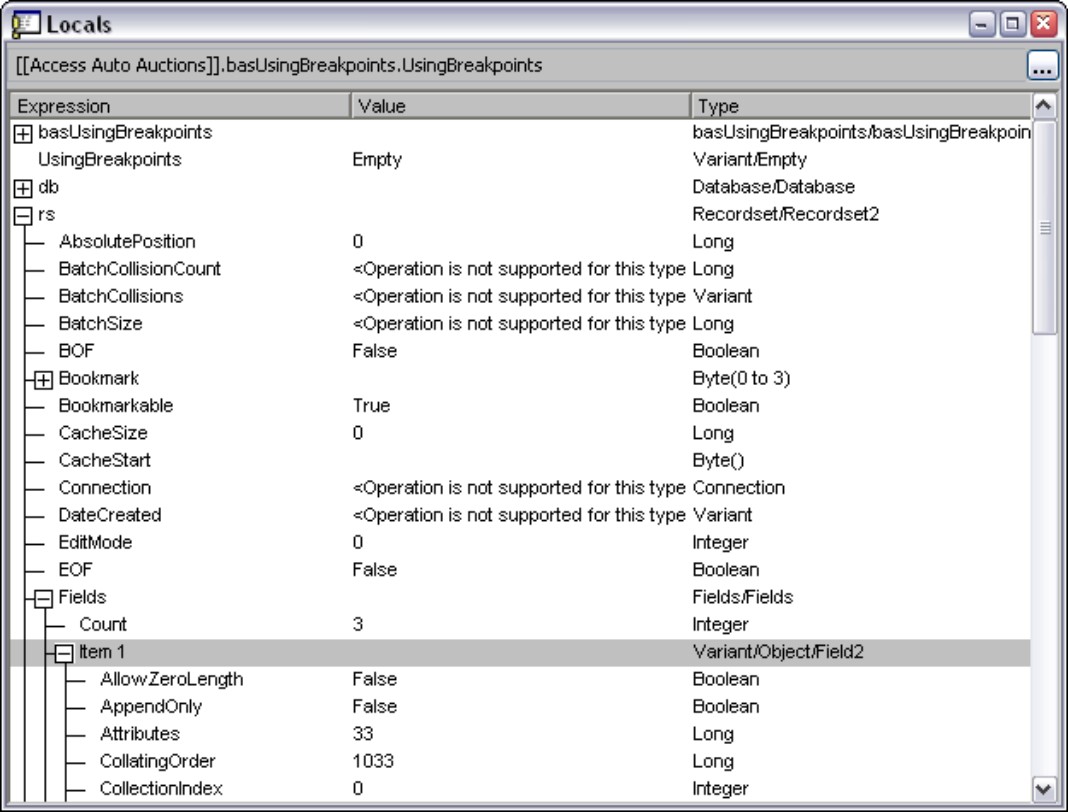
Notice the items in the Locals window in Figure 15-22. Any line in the Locals window that begins with a plus sign icon will unfold to reveal more information. For instance, you can set a breakpoint on the End Function statement at the bottom of the function to halt execution so that you can examine the results of the rs assignment statement. Unfolding the rs entry in the Locals window reveals all the properties of the rs object and its contents (see Figure 15-22).
Figure 15-22
Use the Locals window to examine the values of complex objects.
Setting watches
The Locals window can be overrun with variables in a large application, or in an application with many variables in scope. The Watch window enables you to specify just which variables you want to monitor as you single-step through your code. The value of a watched variable changes dynamically as the code runs (you need to be at some kind of breakpoint, of course, to actually see the values). The advantage of using the Watch window is that the variables displayed do not have to be from the local procedure. In fact, the variables in the Watch window can be from any part of the application.
Setting a watch is more complicated than using the Locals window or setting a breakpoint:
1. Click on the Watch tab.
2. Right-click anywhere in the Watch window and select Add Watch from the shortcut menu.
3. Enter the name of the variable or any other expression in the Expression box of the Add Watch dialog box (see Figure 15-23).
Figure 15-23
The Add Watch dialog box includes some powerful options.
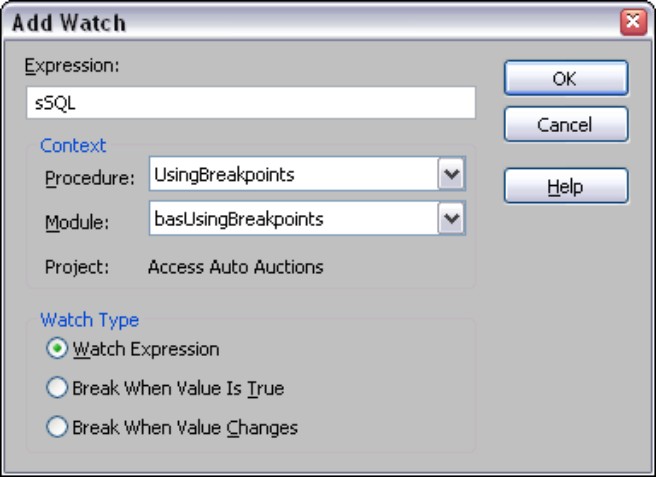
The Add Watch dialog box includes some important options. In addition to the name of a variable or expression (an expression might be something like sSQL = “”), there are options for specifying the module and procedure within the module to watch. In Figure 15-23, the Add Watch dialog box is set up to watch the sSQL variable in all procedures in all modules.
At the bottom of the Add Watch dialog box are the following options:
• Watch Expression: The variable’s value will dynamically change in the Watch window. You must use an explicit breakpoint or Stop statement in order to observe the value of the watched variable.
• Break When Value Is True: This option asserts a break whenever the value of the watched variable or expression becomes True. If you set the expression to sSQL = “”, a breakpoint occurs whenever the value of the sSQL variable changes to an empty string.
• Break When Value Changes: This directive causes Access to halt execution whenever the value of the variable or expression changes. Obviously, this setting can generate a lot of breakpoints!
Use watches wisely. You don’t want to be breaking into program execution too frequently or you’ll never get through the code. On the other hand, you don’t want to overlook some important change in the value of a variable because you didn’t set a watch appropriately.
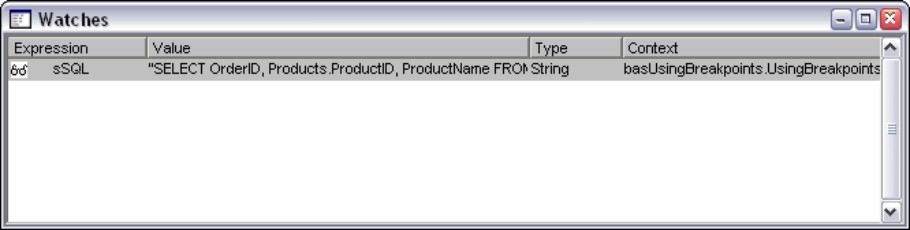
Figure 15-24 shows the Watch window in action. The sSQL variable is displayed for all procedures in all modules.
Figure 15-24
The Watch window reveals all uses of a variable’s details.
Using conditional watches
Although it can be quite entertaining to watch variables in the Locals or Watch windows, you may spend a great deal of unproductive time hoping to see something unexpected happen. You’ll probably find it much more efficient to set a conditional watch on a variable, and instruct the VBA engine to break when the condition you’ve established is met.
The Add Watch dialog box (see Figure 15-25) accepts a Boolean (true or false) expression, such as SalesTax < 0 in the text box near the top. You specify where in the application (which procedures and which modules) the expression is applied, and you tell Access what you want the VBA engine to do when the expression is evaluated. For our purposes, we want execution to break when the expression is True.
Figure 15-25
A conditional watch halts execution when the expression is true.
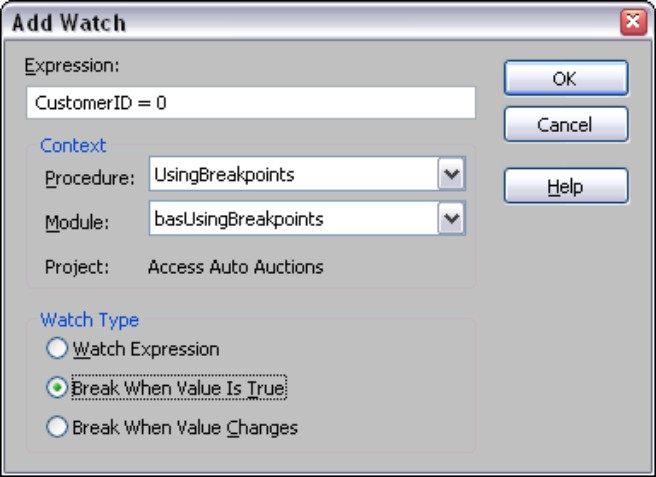
There are other ways to use conditional watches, such as using compound conditions (X = True And Y = False), and forcing a break whenever a value changes from the value set in the expression text box. The small example illustrated in Figure 15-25 only hints at the capabilities possible with conditional watches.
Using the Call Stack window
The last debugging tool we’ll examine is a bit more difficult to understand because it involves multiple dimensions of execution. In many applications, you’ll have procedures that call other procedures that call still other procedures. To our knowledge, there is no practical limit on the number of procedures that can be sequentially called in a VBA project. This means you may have a “tree” of procedures many levels deep, one level of which is causing problems in your application.
Imagine a function that performs a common operation (such as calculating sales tax) in an application. As a general rule, rather than include this function in every module in the application, you’ll put the function into a single module, declare it with the Public keyword so that it’s recognized and used by the entire application, and then call it from whichever procedure needs a sales tax calculation.
Furthermore, imagine that this application has many such functions and subroutines, each calling the other, depending on the application’s logic at that moment. Finally, imagine that users report that the sales tax appears to be incorrectly calculated under some conditions, but not others.
It’d be possible to single-step through all of the code in the application, hoping to discover the cause of the erroneous sales tax. However, this would not be an efficient approach. It’d be much more efficient to set a conditional watch on an important variable within the sales tax function, forcing the code to break when the condition is True. Then, open the Call Stack window (see Figure 15-26) to view the path that the VBA engine has taken to reach this particular point in the code.
Figure 15-26
The Call Stack window shows you how the execution point reached its current position.
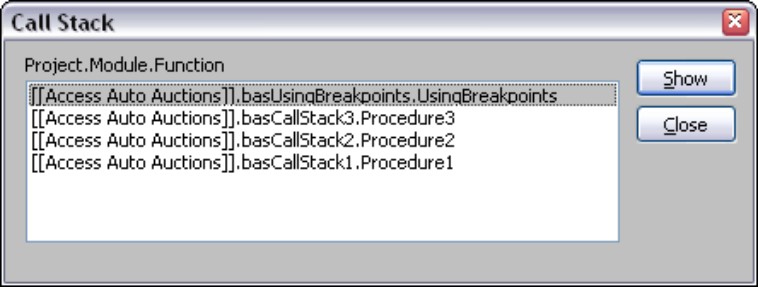
Double-click on any of the items listed in the Call Stack to be taken to the statement that sent execution to the next procedure. Using the Call Stack window in conjunction with conditional watches enables you to stop code wherever relevant, and to diagnose how code has executed up to the breakpoint.
Summary
This chapter takes a quick look at the important topic of debugging Access VBA code. The techniques you apply and the tools you use in debugging your code are highly individual choices. Not all developers feel comfortable using the Immediate window to watch variables. Not every developer uses breakpoints and the Step buttons to stop and control execution. At the same time, it’s nice to know that these tools are available for your use when you’re ready!
This chapter ends the section on VBA programming in Microsoft Access. You’ll see many different ways of using VBA code to strengthen and enhance your Access applications in the following parts and chapters of this book.
The next part revisits the basic application building tasks you read about in the first part of this book. The next several chapters explain many of the most important aspects of application development, such as using external data in your Access applications, creating advanced queries, and building complex forms and reports. These chapters take the basic skills explained in the first two parts of this book and extend your understanding of Access application development.