Chapter 24: Using ActiveX Controls
Access provides many powerful tools for enhancing your forms and reports. These tools let you add pictures, graphs, sound, and even video to your database application. Chart wizards make it easy to build business graphs and add them to your forms and reports. ActiveX controls extend the power of Access 2007; new features borrowed from Microsoft Office 2007 make using Access forms more productive than ever.
In this chapter, you learn about the different types of graphical and ActiveX objects you can add to your system. You learn how to manipulate them to create professional, productive screen displays and reports. You also learn how to use some of the new Office 2007 tools that work with Access 2007 forms.

This chapter uses the Chapter24.accdb database. If you haven’t already copied it onto your machine from the CD, you’ll need to do so now.
Understanding Objects
Access gives you the capability of embedding pictures, video clips, sound files, business graphs, Excel spreadsheets, and Word documents. You can also link to any OLE (Object Linking and Embedding) object within forms and reports. Therefore, Access lets you not only use objects in your forms but also edit them directly from within your forms.
Looking at the types of objects
As a general rule, Access can add any type of picture or graphic object to a form or report. You can interact with OLE objects with great flexibility. For example, you can link to an entire spreadsheet, a range of cells, or even an individual cell.
Access can embed and store any binary file within an object frame control, including even sound and full-motion video. As long as you have the software driver for the embedded object, you can play or view the contents of the frame.
These objects can be bound to a field in each record (bound) or to the form or report itself (unbound). Depending on how you want to process the OLE object, you may either place (embed) the copy directly in the Access database or tell Access where to find the object (link) and place it in the bound or unbound object frame in your form or report. The following sections describe the different ways to process and store both bound and unbound objects by using embedding and linking.
Using bound and unbound objects
A bound object is an object displayed (and potentially stored) within a field of a record in a table. Access can display the object on a form or print it on a report.
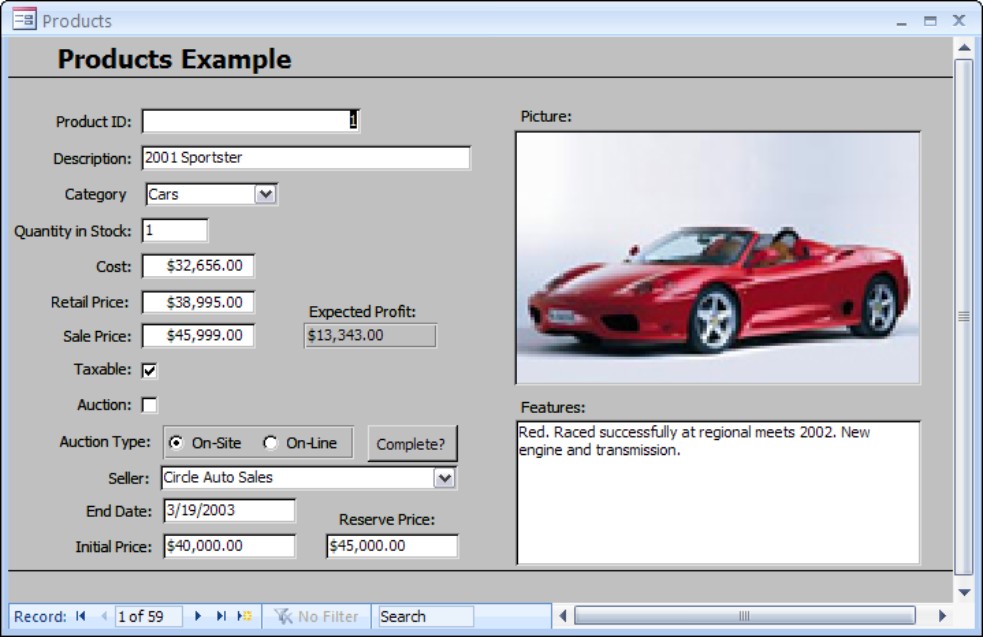
A bound object is bound to an OLE object data type field in the table. If you use a bound object in a form, you can add and edit pictures or documents, record by record, the same way you can edit other data. To display a bound OLE object, you use a bound object frame control. In Figure 24-1, the picture of the Porsche is a bound object. Each record stores a photograph of the car in the Picture field in the tblProducts table. You can enter a different picture for each record.
An unbound object is not stored in a table; it is placed on the form or report. An unbound object control is the graphic equivalent of a label control. These are generally used for OLE objects in the form or report itself. They don’t belong to any of the record’s fields. Unbound objects don’t change from record to record.
An image control that displays a picture is another example of an unbound object. Although an unbound OLE object frame allows you to edit an object by double-clicking on it and launching the source application (Paint, Word, Excel, a sound or video editor or recorder, and so on), an image control only displays a bitmap picture (usually in .bmp, .jpg, or .gif format) that cannot be edited.

Always use an image control for unbound pictures; it uses far fewer computer resources than an OLE control and significantly increases performance.
In Figure 24-1 the image of the car is a bound OLE object; the expected profit value is an unbound object because it is not directly stored in the table. However, the expected profit value is calculated for each record in the form. So, there is a dependency between the expected profit and whatever record is currently displayed on the form. This means the graph is updated each time data in the record changes.
Figure 24-1
Bound and unbound objects
Linking and embedding
The basic difference between linking and embedding objects within a form or report is that embedding the object stores a copy of it within your database. Linking an object from another application does not store the object in your database; instead, the external location of the object is stored. Linking an object gives you two benefits:
• You can make changes to the object using the source application, without opening Access.
• The Access database only uses space for the file path and filename to the external reference.

If the external file is moved to another directory (or if the file is renamed), the link to Access is broken. Therefore, opening the Access form that is linked to the object will result in an error message.
One benefit of embedding is that you don’t have to worry about someone changing the location or name of a linked file. It is embedded. So, the file is part of the Access .accdb database file. Embedding does have its costs, however. The first is that it takes up space in your database—sometimes a great deal of space. Some pictures can take several megabytes. In fact, if you embed an .avi video clip of just 30 seconds in your database for one record, it can use 10MB or more of space. Imagine the space that 100 records with video could use.
After the object is embedded or linked, you can use the source application (such as Excel or Paintbrush) to modify the object directly from the form. To make changes to these objects, you only have to display the object in Access and double-click on it. This automatically launches the source application and lets you modify the object.
When you save the object, it is saved within Access.
Suppose that you’ve written a document management system in Access and have embedded a Word file in an Access form. When you double-click on the image of the Word document, Word is launched automatically and you can edit the document.

When you use a linked object, the external application is started, and when you modify the object the changes are made to the external file, not within your database as they are with an embedded file.

To edit an OLE object, you must have the associated OLE application installed in Windows. If you have embedded an Excel .xls file but don’t own Excel, you can view the spreadsheet (or use its values), but you won’t be able to edit or change it.
Embedding Objects
You can embed objects in both unbound and bound object frames, as well as in image frames. Embedding places the object in the Access database, where it is stored in the form, the report, or a record of a table.

In this section, you use the form shown in Figure 24-2. You can find the form in the Access Auto Auctions database file, named frmProductExampleStart.
Figure 24-2
The frmProductExampleStart form

Embedding an unbound object
Access provides two methods you can use to embed an unbound object in a form or report:
• You can simply paste an object on the form or report. Access adds an image or unbound object frame that contains the object.
• You can add an unbound object frame or image frame and then insert the object or picture into the frame.
Pasting an unbound object
If the object you want to insert is not an OLE object, you must first copy in the source application and then paste the object on the form. Generally today most applications include OLE technology and can be recognized by the Insert menu option. Sometimes, you may just want to select an image using Windows Explorer and copy and paste the object to an Access form. As an example, to cut or copy an object and then paste it into an image or unbound object frame, follow these steps:
1. Create or display any object by using any source application like Word, Excel, or Paint.
2. Select the object and copy into the buffer by pressing Ctrl+C.
3. Display the Access form or report in Design View and paste from the buffer by pressing Ctrl+V.
This process automatically adds an unbound object frame for an OLE object (such as Word or Excel) or an Image control for a Paint picture and then embeds the pasted object in it.
If the object you paste into a form is an OLE object and you have the OLE application loaded, you can still double-click on the object to edit it. For example, you can highlight a range of cells in an Excel worksheet and paste the highlighted selection into an Access form or report. You can use the same highlight-and-paste approach with a paragraph of text in Word and paste it on the Access form or report. You can paste both OLE and non-OLE objects on a form or report with this method, but you’ll see that there are other ways to add an OLE object.
Inserting an image-type object
You can also use the second method to embed OLE objects or pictures into an unbound object frame or image frame. Suppose that you want to embed a file containing a Paint picture. In Figure 24-1, the picture of the Access Auto Auctions logo appears on the form in the form header in an image control. You can embed the picture by either pasting it into the image control or by inserting the object into the image frame (the rectangle that contains and displays the picture). Follow these steps to add an image control:
1. Open the form frmProductExampleStart in Design View.
2. Select the Image frame tool on the Toolbox (see Figure 24-3).
The icon is under the Design tab (at the top of the Access window), in the Controls section, and looks like a little mountain with the sun rising over it).
Figure 24-3
Creating an image frame

3. Draw a rectangle in the Form Header (refer to Figure 24-3), to add the image frame.
When you add an image frame, the Insert Picture dialog box appears. This dialog box, shown in Figure 24-4, displays the filenames of the image objects you have on your system.
4. To embed an existing graphic, select the file called porsche.bmp in the Navigation window (shown in Figure 24-4), and click the OK button.
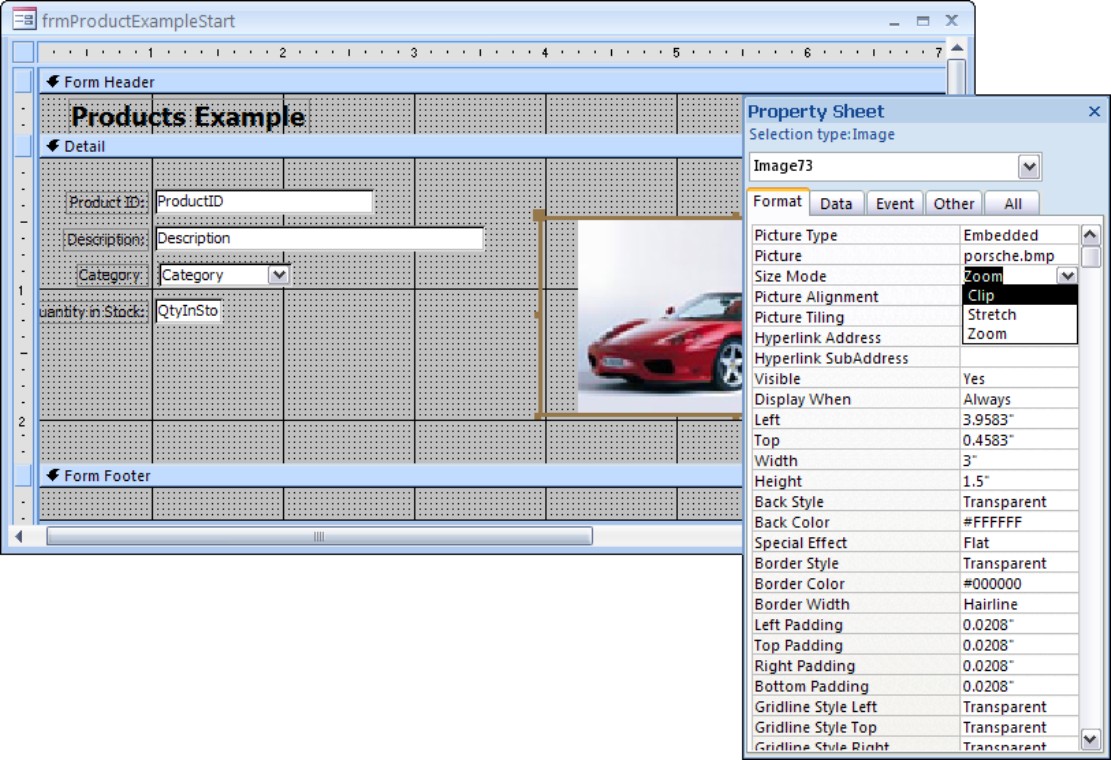
Access embeds and displays the picture in the unbound object frame, as you can see in Figure 24-5. Notice that, in this figure, the picture may not appear to be displayed correctly. In this case, the image is too small for the image frame. You can correct this by simply resizing the image frame until it looks right. Otherwise, you can also use the Size Mode property. To get the Properties window up on the screen, right-click the image and select the Properties option from the menu.
Figure 24-4
The Insert Picture dialog box
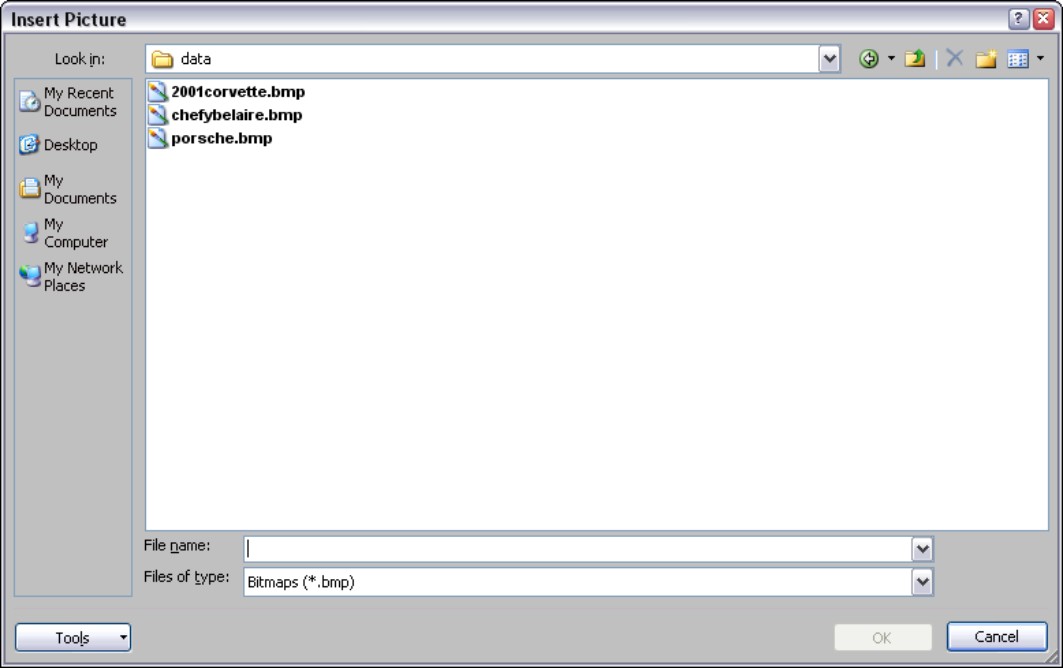
Figure 24-5 also shows some of the other properties of the Image control. The Picture property is set to the path and filename of the image you selected. The Picture Type property below has two choices. The default is Embedded and saves a copy of the bitmap picture in the database container in a compressed form. The other Picture Type option is Linked and stores the image externally to the Access database. This setting will maintain a link to the original picture. However, if you move the bitmap, the picture will no longer be displayed and the link will be broken.
Figure 24-5
The image frame property sheet
Changing the display of an image
After you add an image to a form or a report, you may want to change the size of the object or the object frame. If you embed a small picture, you may want to adjust the size of the object frame to fit the picture. Similarly, you might want to reduce the size of the picture to fit a specific area on your form or report.
To change the appearance and proportions of the object you embedded, you must change the size of the image frame and set the Size Mode property. In Figure 24-6, you see the result of the three choices for the Size Mode property, as well as the correct view of the picture:
• Clip: Shows the picture at its actual size, truncating both the right and bottom
• Stretch: Fits the picture within the frame, distorting the picture’s proportions
• Zoom: Fits the picture proportionally within the frame, possibly resulting in extra white space
Figure 24-6
Results of using the various scaling options

You should use the Clip option only when the frame is the exact size of the picture or when you want to crop the picture. Stretch is useful when you can accept a slight amount of distortion in the picture. Although using Zoom fits the picture to the frame and maintains the original proportions, it may leave empty space in the frame. To change the Size Mode setting for the porsche.bmp file on the frmProductExampleStart form, follow these steps:
1. Select the image frame in Design View.
2. Display the Property Sheet.
3. Change the Size Mode setting to Stretch.
When you have added a picture with a frame (border) that is much larger than the picture itself and you have selected a Size Mode of Clip, the picture normally is centered within the frame. You can control this by using one of the Picture Alignment options, which are Center, Top Left, Top Right, Bottom Left, and Bottom Right.
Embedding bound objects
You can store pictures, spreadsheets, word-processing documents, or other objects as data in a table. For example, you can store a Paintbrush picture, an Excel worksheet, or an object created in any other OLE application, such as a sound clip, an HTML document, or even a video clip from a movie.
You store objects in a table by creating a field in your table that uses the OLE Object data type. After you create a blank bound object frame, you can bind its Control Source to the OLE Object field in the table. You can also drag the field to the form from the Field List window and it will be automatically bound.
You can then use the bound object frame to embed an object into each record of the table.

You can also insert objects into a table from the Datasheet View of a form, table, or query, but the objects cannot be displayed in a view other than Form. When you switch to Datasheet View, you’ll see text describing the OLE class of the embedded object. For example, if you insert a .bmp picture into an OLE object field in a table, the text Picture appears in Datasheet View.
Adding a bound OLE object
The image added in the previous section was not bound, in that it was not bounded, linked, connected in any way, to the database. To add an embedded OLE object in a new bound object frame, follow these steps:
1. Remove the unbound image from the previous section.
2. Select the Bound Object Frame button from the Toolbox (t).
3. Drag and size the frame, as shown in Figure 24-7.
4. Display the properties sheet.
5. Type Picture in the Control Source property of the Data tab.
This is the name of the OLE field in the tblProducts table that contains pictures of the cars.
6. Set the Size Mode property to Zoom, on the Format tab, so that the picture will be zoomed proportionally within the area you define.
7. Select and delete only the bound object frame label (OLEBoundxx:).
8. Close and save the changes to this form.
Figure 24-7
Creating a bound object frame

Adding a picture to a bound object frame
After you define the bound object frame control and place it on a form, you can add pictures to it in several ways. You can paste a picture into a record or insert a file object into the frame. You insert the file object for a bound frame in nearly the same way you would insert an unbound object or image frame. The only difference is that, where an unbound image frame has a picture inserted in the design screen, a bound object frame contains a picture that is stored in a table, so the picture is inserted in Form View like any other data.
To insert a picture or other object into a bound object frame, display the form in Form View, move to the correct record (each record can have a different picture or object), select the bound object frame, and then right-click on the object, and select the Insert Object option from the pop-up menu. The dialog box is a little different. Because you can insert any OLE object (in this example, a picture), you first have to choose Create from File, and then choose the first option, Bitmap Image. You can then select the actual picture. When you’re through, the picture or object appears in the bound object frame in the form.

If you create the object (instead of embedding an existing file), some applications display a dialog box asking whether you want to close the connection and update the open object. If you choose Yes, Access embeds the object in the bound object frame or embeds the object in the datasheet field along with text describing the type object, such as Excel or Word.
After you embed an object, you can start its source application and edit it from your form or report. Simply select the object in Form View and double-click it.
Editing an embedded object
After you have an embedded object, you may want to modify the object itself. You can edit an OLE object in several ways. Normally, you can just double-click on it and launch the source application; then you can edit the embedded OLE object. As an example, you could follow these steps to edit the picture of the car in Windows Paint or whatever your default application is for editing bitmaps:
1. Display the form frmProductExampleStart in Form View.
2. Move to record 2 (or whichever record contains blue car) and select the picture bound object frame of the car.
3. Double-click the picture.
The screen changes to an image-editing environment with Windows Paint, Microsoft Photo Editor, or your default bitmap editor’s menus and functions available. You may see the icon on the taskbar for the product (Microsoft Photo Editor) in Figure 24-8. Choose Maximize on the icon to edit the picture if in-place editing is not allowed in Access.

If you get the message The OLE object was changed to a picture or the link was broken, it just means that our pictures may not be compatible with your system. Insert your own picture and try again.

Another error message might be OLE server isn’t registered. If you get this error message, you need to register some DLL files in Windows. Go to www.microsoft.com and search for OLE server.

Windows supports full in-place editing of OLE objects. Instead of launching a different program, it changes the look of the menus and screen to match Windows Paint, temporarily adding that functionality to Access.
4. Make any changes you want to the picture.
5. Click on any other control in the form to close Paint or Microsoft Photo Editor.
If you make any changes, you’ll be prompted to update the embedded object before continuing.

In most cases, you modify an OLE object by double-clicking on it. When you attempt to modify either a sound or video object, however, double-clicking on the object causes it to use the player instead of letting you modify it. For these objects, you must use the Edit menu; select the last option, which changes (according to the OLE object type) to let you edit or play the object. You can also convert some embedded OLE objects to static images, which breaks all OLE links and simply displays a picture of the object.
Figure 24-8
Editing the embedded object

Linking Objects
Besides embedding objects, you can link them to external application files in much the same way as you would embed them. As you learned earlier, the difference is that the object itself is not stored in the form, the report, or the database table. Instead, Access stores the filename and path to the object, saving valuable space in the .accdb file. This feature also allows you to edit the object in its source application without having to go through Access.
When you create a link from a file in another application (for example, Microsoft Excel) to a field in a table, the information is still stored in its original file.
Suppose that you decide to use the OLE Object field to store an Excel file containing additional information about the car’s sales. If the Excel file contains history about the sales, you might want to link the information from the tblProducts record to this file.
Before linking information in a file to a field, however, you must first create and save the file in the source application.

On the CD-ROM is a file named Car2.xls, which is an Excel worksheet. However, you can use any spreadsheet or word-processing file in this example.
To link information to a bound object, use the following steps showing you how to use the Picture bound object frame to link a tblProducts table record to an Excel worksheet:
1. Open Microsoft Excel or the source application, and load the document that contains the information you want to link to.
2. Select the information you want to link, as shown in Figure 24-9.
3. Press Ctrl+C to copy into the buffer.
Figure 24-9
Copying a range from Microsoft Excel
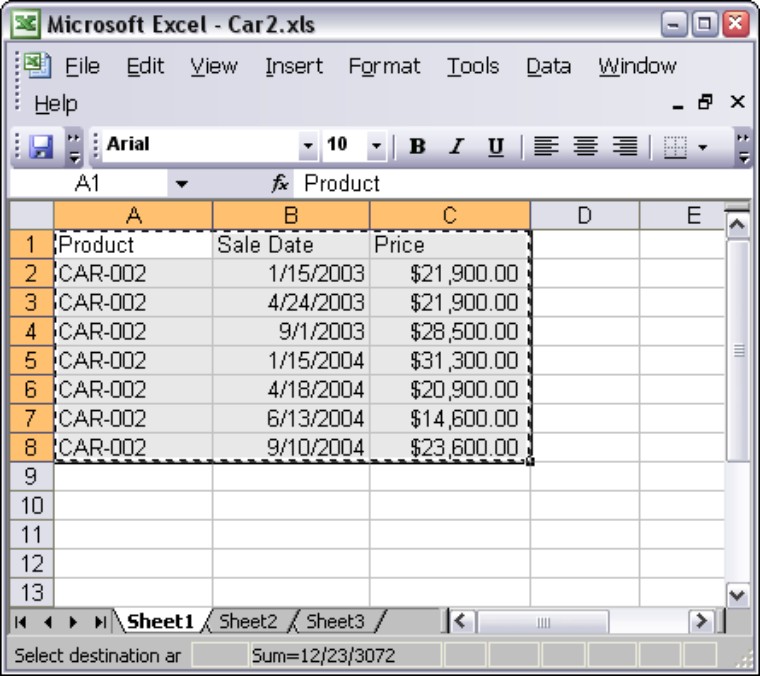
After you copy the range to the Clipboard, paste it into the bound object frame in the Access form by using the Paste Special option of the Edit menu.

The Clipboard is also known as the buffer.
4. Switch to Access and open the form frmProductExampleStart in Form View.
5. Go to record number 2 in the Access form or the record that contains blue car.
6. Select the bound object frame.
7. Right-click and select Paste.
This will copy the data content into the bound object, not the Excel spreadsheet object.
8. Add the spreadsheet object by right-clicking the mouse and selecting Insert Object.
9. Follow the prompts to select an Excel Worksheet object, browse for, and select the file to add.
This will allow you to edit the spreadsheet object from within the Access form, when it is running.
The linked Excel worksheet appears in the bound object frame, as shown in Figure 24-10. Access creates the link and displays the object in the bound object frame or it links the object to the datasheet field, displaying text (such as Microsoft Excel) that describes the object. When you double-click on the picture of the worksheet, Excel is launched and you can edit the data.
Figure 24-10
The linked worksheet

Creating a Graph or Chart
You use Microsoft Graph to chart data from any of your database tables or data stored within other applications (such as Microsoft Excel). Microsoft Graph creates graphs in a wide variety of styles, such as bar graphs, pie charts, line charts, and others. Because Graph is an embedded OLE application, it does not work by itself; you have to run it from within Access. It is dependent on Access.

The terms graph and chart are used interchangeably in this chapter. Technically, you use Microsoft Graph to create a chart. There are many chart types that Microsoft Access cannot create. These have little to do with data, and include organization charts and flow charts.
After you embed a graph, it behaves as any other OLE object. You can modify it from the Design View of your form or report by double-clicking on the graph itself, or edit it from the Form or Datasheet View of a form. The following sections describe how to build and process graphs that use data from within an Access table, as well as from tables of other OLE applications.
The different ways to create a graph
Access provides several ways to create a graph and place it on a form or a report. Using the Graph form or Report Wizard, you can create a graph as a new form or report, add it to an existing form or report, or add it to an existing form and link it to a table data source. (To use this third method, in form Design View, click on the Unbound Object frame tool on the Toolbox and then choose Microsoft Graph Chart.) Unless you’re already an experienced Graph user, familiar with it from previous versions of Access or Excel, you’ll find it easier to create a new graph from the Toolbox. If you examine the Toolbox, however, you won’t see a Chart Wizard icon. You must first customize the Toolbox so that you can add a graph to an existing form by using the Chart Wizard.
As a general rule (for both types of graph creation), before you enter a graph into a form or report that will be based on data from one or more of your tables, you must specify which table or query will supply the data for the graph. You should keep in mind several rules when setting up your query:
• Make sure that you’ve selected the fields containing the data to be graphed.
• Be sure to include the fields containing the labels that identify the data.
• Include any linking fields if you want the data to change from record to record.
Creating graphs using the Toolbox
Figure 24-11 shows the Design tab, under the Design View when editing a form. The graph object selected is highlighted in Figure 24-11 with a circle drawn around it.
Figure 24-11
Adding a graph to a form

Embedding a Graph in a Form
As you learned earlier in this chapter, you can both link and embed objects in Access tables, and display objects on Access forms. Next you create and display a graph based on the Access Auto Auction data and display it in a form.
This graph will show the dates a car was sold and the dollars received each time. When you move through the records in the tblProducts table, the form will display the data in graph format for each car’s prices. You’ll use the same form that you’ve used so far throughout this chapter.
Assembling the data
As a first step in embedding a graph, make sure that the query associated with the form provides the information you need for the graph. In this example, you need both the dtmSalesDate and the curPrice fields from the tblSalesLineItems table as the basis of the graph. You also need the idsInvoiceNumber field from the tblSales table to use as a link to the data on the form. This link allows the data in the graph to change from record to record.
Sometimes, you’ll need to create a query when you need data items from more than one table. In this example, you select all the data you need right from the wizard. Access builds the query (actually a SQL statement) for you automatically.
Build the query like this:
1. In the leftmost, main drop-down menu, select Queries.
2. Click the Create tab (at the top), and the Query Design tool in the Other section.
3. Select the tblSales, and tblsSalesLineItems from the menu.
4. Click the Add button and close the Show Tables window.
The two tables should be linked with the invoice number (InvoiceNumber).
5. Select ProductID from the line items table, and drag it onto the first Field box entry in the design specifications on the lower half of the Design View screen.
6. Place the SaleDate field from the sales table into the second column.
7. Place the Price field from the line items table into the third column.
8. Set the Sort option for the first two columns to an ascending sort.
9. Right-click the top of the window for the query designed, select Save from the menu, and store the query as qryChartExample.
10. Test the query by clicking the Datasheet View option from the View menu, just to make sure it’s doing something useful.
Adding the graph to the form
The following steps detail how to create and place the new graph on the existing form. You should be in the Design View of the form named frmProductExampleStart. The following steps take you through the wizard to create the desired graph and link it to your form:
1. Select the Insert Chart tool you added to the Toolbox and draw a chart onto the form Design View.
2. Click the mouse button and hold it down while dragging the box to the desired size for the graph.
Access displays the Chart Wizard dialog box you use to embed a graph in the form. As shown in Figure 24-12, the first Chart Wizard screen lets you select the table or query with the data for the chart. By using the row of option buttons under the list of tables, you view all the tables, all the queries, or both.
Figure 24-12
Selecting the query for the source of data for the graph
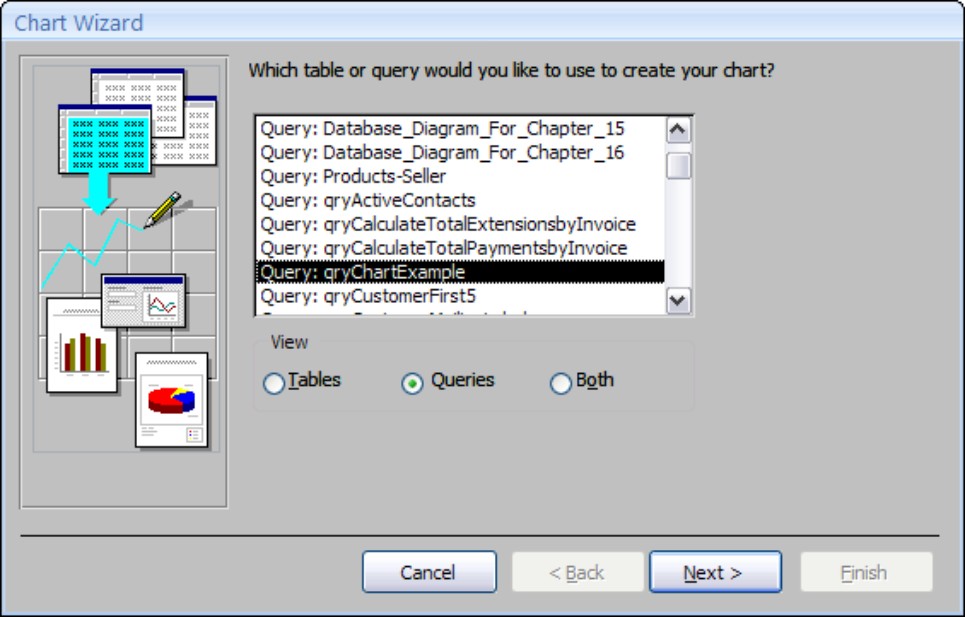
3. Choose Query: qryChartExample as the data source for the graph and click Next.
The second screen of the Chart Wizard lets you select fields to include in your graph. You could select all the fields listed by double-clicking on them to move them to the Fields for Chart box or by clicking on the >> button to move the fields all at once. However, you want to add them in a specific order.
4. Select the fields by double-clicking on them in the following specific order: SaleDate, ProductID, Price.
5. Click Next.
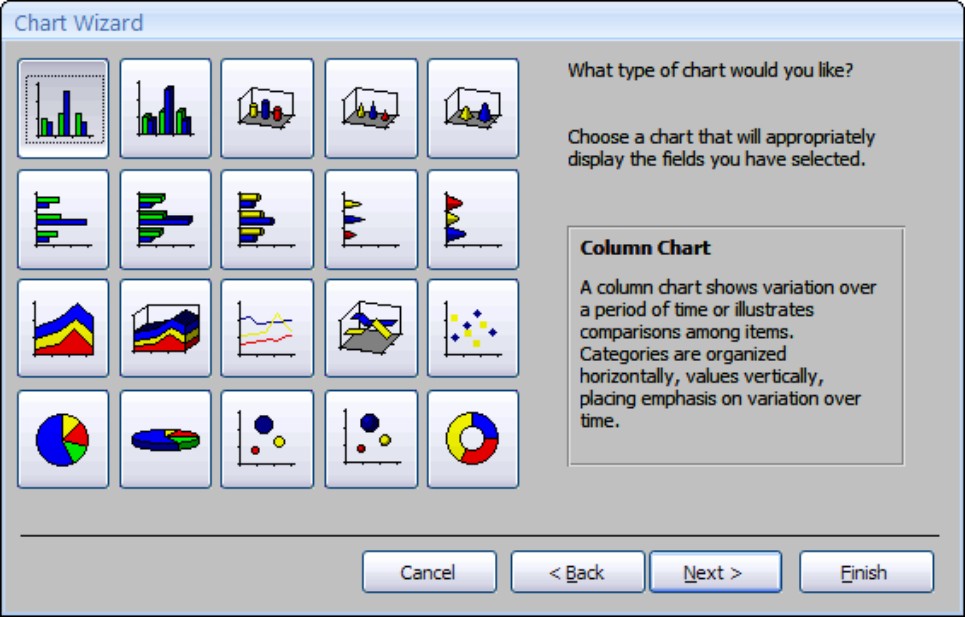
The third Chart Wizard screen (Figure 24-13) lets you choose the type of graph you want to create and determine whether the data series are in rows or columns.
6. In this example, select a column chart.
You’ll customize it later using the graph options. As you click on each of the graph types, an explanation appears in the box in the lower-right corner of the screen.
7. Select the Column Chart, as shown in Figure 24-13, and click Next.
Column charts are easy to work with.
Access 2007 may do something weird at this stage. The SaleDate field must be used for the x-axis. The Price must be used for y-axis; this determines the height of the bars on the histogram. If you want to change the assumptions, drag the field buttons on the right side of the screen to the simulated graph area. You drag the buttons to the little boxes, and delete anything that should not be in the little boxes. You should eventually have what is shown in Figure 24-12.
Figure 24-13
Selecting the type of chart

It is important to only choose the fields that you’ll use for the graph if you want the wizard to figure out for you what to graph.
You may notice in Figure 24-14, that each of the fields on the left side of the screen is a button. By double-clicking on a field-button you further define how the data is used in the graph.

There is a button on the top-left corner of the Chart Wizard that lets you preview that chart at any time. This way, you can see the results of your selections.
Generally, the x-axis variable is either a date or a text field. The y-axis field is almost always a number. That number can be an aggregation, as in the case shown in Figure 24-12. Only numeric and date fields, such as the y-axis variable Price, can be further defined.
8. Double-click on the SumOfPrice field on the left side of the screen.
The dialog box shown in Figure 24-15 appears. You can define options for summarizing the field. Remember that there may be many records for a given summary; in this example, many cars may have been sold in the same month.

If you had several numeric fields, you could drag them (or any multiple fields), to the left side for a multiple series; these would appear in a legend and display more than one bar or lines in the graph. You can also drag the same field to both the x-axis and the Series indicator, as long as you’re grouping differently. For example, you could group the SalesDate by month and use it again in the Series grouped by year. Without using the SalesDate field a second time as the series variable, you would have one bar for each month in sequential order. For example, Jan01, Feb01, Mar01 . . . Dec01, Jan02, Feb02, and so on. By adding the SalesDate as a series variable and grouping it by year, you could get pairs of bars. Multiple bars can be created for each month, each a different color and representing a different year and a legend for each year.
Figure 24-14
Laying out the chart’s data elements
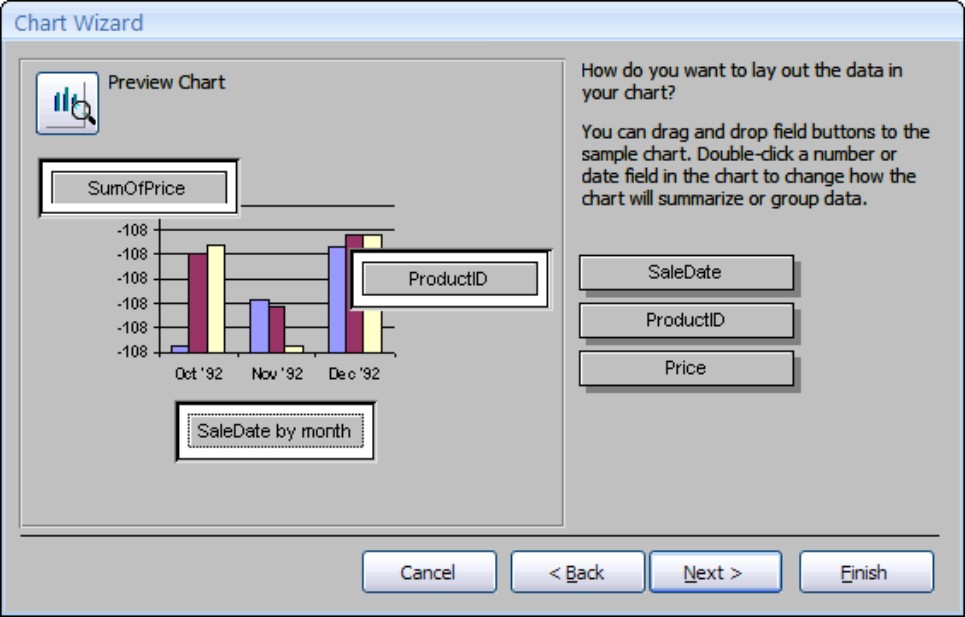
Figure 24-15
Selecting options to summarize the y-axis numeric field
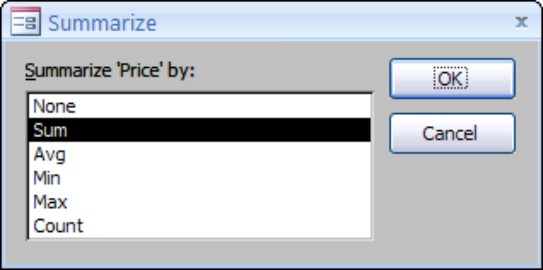
9. As shown in Figure 24-15, Sum is selected as the summarizing type.
You could change it to Avg to get a graphical representation of an average amount of prices—instead of summing all the price amounts. Click Cancel to accept Sum.

You must supply a numeric variable for all the selections except Count, which can be any data type.
10. Double-click SaleDate by month, and the dialog box shown in Figure 24-16 appears to let you choose the date hierarchy from larger to smaller rollups.
The choices include Year, Quarter, Month, Week, Day, Hour, and Minute. If you have data for many dates within a month and want to roll it up by month, choose Month. In this example, you want to see all the detail data. Because the data is in Sales by date (mm/dd/yy), you would select Day to view all the detail records.
11. For this example, change the default selection from Month to Day and click OK.
Figure 24-16
Choosing group options for a date field
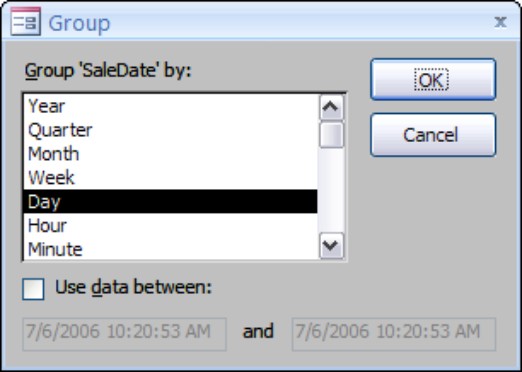
12. After you change the group options from Month to Day for the SaleDate field, click on Next to go to the next wizard screen.
Figure 24-17 shows the field linking box. If you run the Chart Wizard from inside an existing form, you have the option to link a field in the form to a field in the chart. Even if you don’t specify the field when you select the chart fields, you can make the link as long as the field exists in the selected table.
In this example, Access has correctly selected the ProductID field, from both the frmProductsExampleStart form and the qryChartExample query. This way, as you move from record to record, which is keyed by Product ID, in the frmProductExampleStart form, the graph changes to display the data for that product.
13. Click Next to move to the last wizard screen.
Figure 24-17
Linking fields between the form and the graph
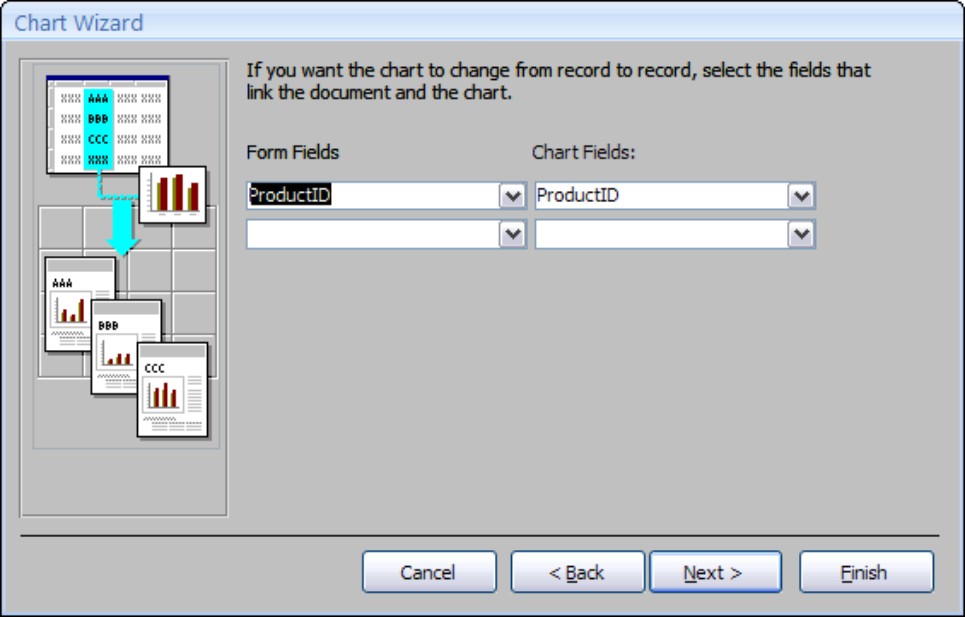
14. The last Chart Wizard screen, shown in Figure 24-18, lets you enter a title and determine whether a legend is needed.
You won’t need one for this example because you have only one data series.
Figure 24-18
Specifying a chart title and legend

15. Enter Sale Prices by Day for the graph title.
16. Select the button next to the text No, don’t display a legend and click Finish to complete the wizard.
The sample chart appears in the graph object frame on the design screen. This is shown in Figure 24-19. Until you display the form in Form View, the link to the individual product is not established, and the graph is not recalculated to show the sale dates for a specific car’s record.
In fact, the graph shown is a sample preview. So, it doesn’t use any of your data. If you were worried about where that strange-looking graph came from, don’t be.
17. Click the Form View button on the ribbon to display the ProductExampleStart form and recalculate the graph.
Figure 24-20 shows the final graph in Form View.
Figure 24-19
The graph in the Form Design window

Figure 24-20
Recalculating the graph in Form View
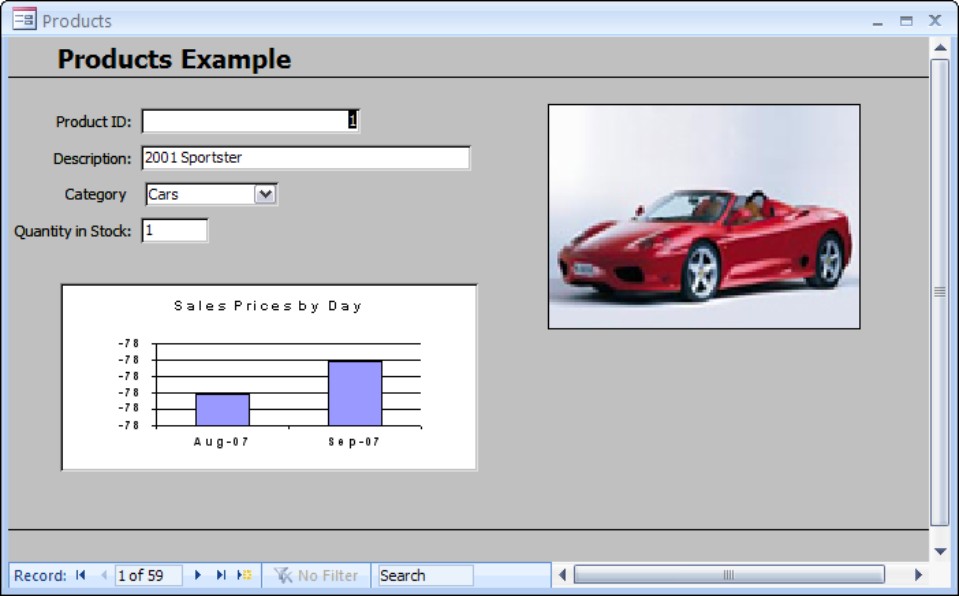
In Figure 24-19, you saw the graph and the property sheet. You display a graph by using a graph frame, which shows its data in either Form View or Design View. Now take a look at some properties in the property sheet. The Size Mode property is initially set to Stretch. You can change this to Zoom or Clip, although the graph should always be displayed proportionally. You can also size and move the graph to fit on your form. When you work with the graph in the Graph window, the size of the graph is the same size it will be in the Design window.
The Row Source property setting comes from the table or query you used with the graph, but it appears as a SQL statement that is passed to the Graph. The SQL statement (more on this later) created for this graph is as follows:
TRANSFORM Sum([Price]) AS [SumOfPrice]
SELECT (Format([SaleDate],”DDDDD”))
FROM [qryChartExample]
GROUP BY (Int([SaleDate])),(Format([SaleDate],”DDDDD”))
PIVOT [ProductID];
The next two properties—Link Child Fields and Link Master Fields—control data linking to the form’s data. Using the link properties, you link the graph’s data to each record in the form. In this example, the ProductID from the current Product record is linked to Sales records with the same ProductID value.
To change the appearance of the graph, double-click on the graph in Design View to open Microsoft Graph. After you make the changes you want, select File and Exit to return to Microsoft Access and go back to Design View.
Customizing a graph
After you create a graph within Access, you enhance it by using the tools within Microsoft Graph. As demonstrated in the preceding section, just a few mouse clicks will create a basic graph. In many cases, the basic chart that you create presents the idea you want to get across. In other cases, however, it may be necessary to create a more illustrative presentation. You accomplish this by adding any of these enhancements:
• Entering free-form text to the graph to highlight specific areas of the graph
• Changing attached text for a better display of the data being presented
• Annotating the graph with lines and arrows
• Changing certain graphic objects with colors and patterns
• Moving and modifying the legend
• Adding gridlines to reflect the data better
• Manipulating the 3-D view to show your presentation more accurately
• Adding a bitmap to the graph for a more professional presentation
• Changing the graph type to show the data in a different graphic format, such as Bar, Line, or Pie
• Adding or modifying the data in the graph
Integration with Microsoft Office
Access is not only integrated with Windows, it now shares many major components with all Microsoft Office tools. If you’re an Excel or Word user, you’ll be especially thrilled. Access has an integrated Spell Checker that is used to make sure that the data stored in Access tables and database objects is spelled correctly. The dictionary is shared across all Office applications. There are also specific technical dictionaries for legal, medical, and foreign languages and also several custom dictionaries that store your own technical words.
Checking the spelling of one or more fields and records
You can check the spelling of your data in either Form View or Datasheet View. In Form View, you spell-check only a single record, or a single field within a record. To check the spelling of data in Datasheet View, select the field or text containing spelling you want to check, and then click on the Spelling button (the icon with the check mark and the small letters ABC above it) in the Records group on the Home ribbon tab.
When you click on the icon, Access checks the field (or selected text within the field) for spelling, as shown in Figure 24-21.
Figure 24-21
Spell-checking in Access

In the Spelling dialog box that appears, click on Add if you want to add the word in the Not In Dictionary box to the custom dictionary.
You can select only one field at a time in Form View. You’ll probably want to use only Form View to spell-check selected memo data. You must switch to Datasheet View to select multiple fields or records. To check the spelling of data in Datasheet View, you would select the records, columns, fields, or text within a field containing spelling you want to check and then click on the Spelling icon.
You can also check the spelling in a table, query, or form in the Database window by clicking on the table, query, or form object containing spelling you want to check.
You only spell-check the data inside the objects. Access cannot spell-check control names.
Using OLE automation with Office
Access 2007 takes advantage of drag and drop. You do it from a Datasheet View across Excel and Word. You can instantly create a table in a Word document (or add a table to an Excel spreadsheet) by simply copying and pasting (or dragging and dropping) data from an Access datasheet to a Word document or an Excel spreadsheet. (Obviously, you must have Word or Excel installed on your computer to take advantage of these features.)
Creating an Excel-type PivotTable
Access contains a PivotTable Wizard to create Excel PivotTables based on Access tables or queries. A PivotTable is like a cross-tabulation of your data. You define the data values for rows, columns, pages, and summarizing.

A PivotTable is like a cross-tab query, except more powerful.
Before beginning a PivotTable, make sure to display a simple datasheet containing the data you want to analyze. Figure 24-22 shows a query using the tblContacts, tblSales, and tblSalesLineItems tables, in addition to the qryCalculateTotalPaymentsbyInvoice query. All this is used to create an analysis of sales.
Figure 24-22
This query combines various tables and a query for later PivotTable use.

After you create a query, display the datasheet to make sure that the data you expect to see is displayed, and that the type of data lends itself to PivotTable analysis. There should be many different groupings of data because a PivotTable is intended to manipulate, or pivot about, different data categories.

A category is the equivalent of a type table in a relational database terminology.
As shown in Figure 24-23, this data is perfect for PivotTable analysis. There are many customers, each having several purchases, on several dates, plus a total payment for each sale.
After the data is reviewed, you can create a PivotTable. You start by selecting the View menu with the query in Figure 24-23 still open, and then the PivotTable View on the menu. After you begin the PivotTable Wizard process, you see an introductory screen describing exactly what to put where, as shown in Figure 24-24.
Figure 24-23
The datasheet version of the query shown in Figure 24-22

Figure 24-24
The PivotTable layout design wizard
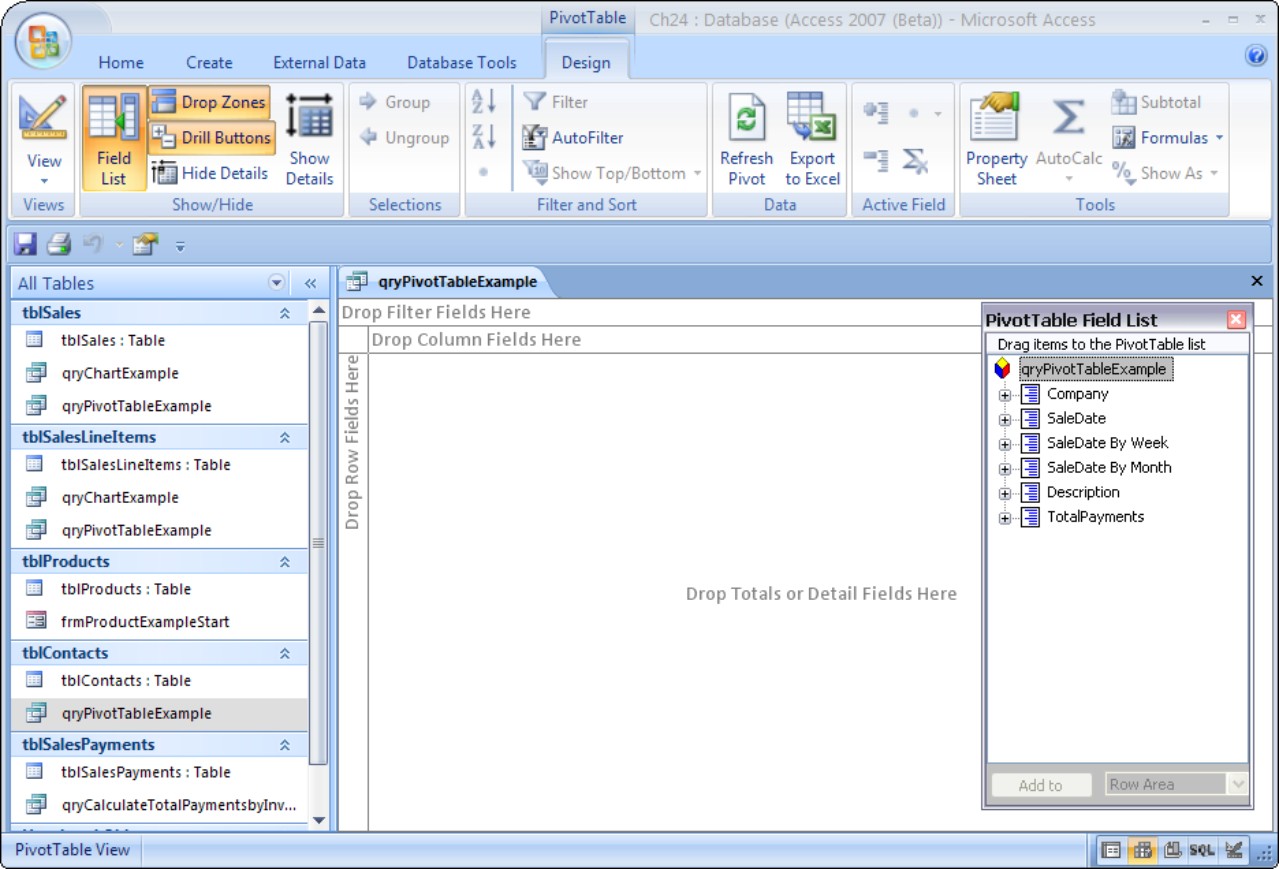
Figure 24-24 shows a number of sections plus a field list selection box. The qryPivotTableExample query is selected. You can create a PivotTable report by following through with these steps:

This is where it gets really easy and your PivotTable design screen starts to look like a spreadsheet.
1. Select the Description field in the PivotTable field list window.
This is the name of the car.
2. Drag the field from the field list window, and drop it onto the left-hand side row box that has Drop Row Fields Here written in it. Easy, right?
3. Now select the SaleDate by Month field, and drag and drop it onto the top box or column heading box (Drop Column Fields Here).
So far, you’ve created rows and columns, where the data will be matched up and summarized based on meeting points between cars and sale date months of those cars.
4. Now drag the Company field onto the top box (Drop Filter Fields Here).
Underneath the word Company you will see the word All. That means you are retrieving data for all companies. You can select one or more companies if you so wish, as shown in Figure 24-25, by clicking the Company filter field as a spin control.
Figure 24-25
Selecting companies to filter with

5. Drag and drop the TotalPayments field, and drop it onto the central section (Drop Totals or Detail Fields Here).
The result is shown in Figure 24-26.
Figure 24-26
A PivotTable design with all sections selected

6. You can now click the various plus signs (to add in totals), or minus signs (to remove totals). Click the plus sigh underneath Grand Totals. And also click the plus sign to the left of the 2008 column header.
You get the result shown in Figure 24-27.
Figure 24-27
A PivotTable can be drilled down into for more or less detail, using the plus and minus signs.

7. Now go to the View button and select PivotChart View.
The screen changes to that shown in Figure 24-28.
In Figure 24-28, the SaleDate field was dragged and dropped onto the Drop Data Fields Here box. The chart gives a slightly more entertaining, summarized picture of the data.
Figure 24-28
A PivotChart can also be selected.

Summary
The ability to include only objects such as Microsoft Graph in Access applications is a very powerful feature. ActiveX controls provide utility that simply cannot be reproduced any other way. It would be virtually impossible to re-create the sophisticated graphs and charts possible with Microsoft Graph using Access or even a powerful graphical design tool.
Microsoft Graph is particularly attractive because its built-in wizards make creating even complex graphs and charts a simple task. As you saw in this chapter, Microsoft Graph provides numerous options for customizing the appearance of Access displayed in graphs and charts.
The next chapter concludes our discussion of advanced Access techniques. There, you’ll learn the basics of trapping runtime errors and handling them in such a way that users are not bothered or interrupted by the errors. Proper error handling is one of the distinctions of professionally designed and built applications. Graceful error handling is one of the earmarks of professional database development, and you’ll be happy to note that VBA provides all of the tools necessary to add powerful, efficient error handling to your Access applications.