CHAPTER 2
TABLE B.1 CONFLICT ORIENTATION IS TIED TO OTHER PSYCHOLOGICAL TRAITS
| |
QUALTRICS PANEL, AUGUST 2016 |
| Extraversion |
0.27* |
| Agreeableness |
−0.07 |
| Conscientiousness |
0.09 |
| Emotional stability |
0.18* |
| Openness |
0.25* |
CHAPTER 3
TABLE B.2 THE INTERACTION BETWEEN CONFLICT ORIENTATION AND INCIVILITY INFLUENCES EMOTIONAL RESPONSES
| |
ANXIOUS |
DISGUSTED |
ANGRY |
AMUSED |
ENTERTAINED |
ENTHUSIASTIC |
| Conflict orientation |
0.01 |
0.005 |
0.004 |
0.03* |
0.03* |
0.03** |
| |
(0.012) |
(0.016) |
(0.14) |
(0.011) |
(0.012) |
(0.010) |
| Treatments |
| Master Chef civil |
0.03 |
−0.11 |
−0.07 |
0.20** |
0.28** |
−0.15** |
| |
(0.062) |
(0.081) |
(0.073) |
(0.059) |
(0.061) |
(0.053) |
| Master Chef uncivil |
0.21** |
0.50** |
0.33** |
0.27** |
0.32** |
−0.20** |
| |
(0.062) |
(0.082) |
(0.074) |
(0.060) |
(0.062) |
(0.054) |
| Planned Parenthood uncivil |
0.32** |
1.04** |
0.83** |
0.22** |
−0.03 |
−0.24** |
| |
(0.063) |
(0.082) |
(0.074) |
(0.060) |
0.062) |
(0.054) |
| C.O. × Treatments |
| Master Chef civil |
−0.01 |
0.01 |
0.01 |
−0.003 |
−0.04* |
−0.01 |
| |
(0.016) |
(0.021) |
(0.019) |
(0.015) |
(0.016) |
(0.014) |
| Master Chef uncivil |
−0.05** |
−0.10** |
−0.05** |
0.014 |
0.02 |
−0.004 |
| |
(0.017) |
(0.22) |
(0.020) |
(0.016) |
(0.016) |
(0.014) |
| Planned Parenthood uncivil |
−0.05** |
−0.02 |
0.004 |
0.04* |
0.03 |
0.005 |
| |
(0.017) |
(0.022) |
(0.019) |
(0.016) |
(0.016) |
(0.014) |
| Seven-point party ID |
0.02 |
0.01 |
0.02 |
−0.006 |
−0.01 |
0.02 |
| |
(0.011) |
(0.014) |
(0.013) |
(0.010) |
(0.010) |
(0.009) |
| Ideology |
0.0004 |
0.03 |
0.02 |
0.01 |
−0.007 |
−0.005 |
| |
0.013) |
(0.017) |
(0.016) |
(0.013) |
(0.013) |
(0.011) |
| Female |
0.08* |
−0.03 |
0.03 |
−0.10** |
−0.02 |
0.01 |
| |
(0.035) |
(0.046) |
(0.042) |
(0.034) |
(0.035) |
(0.030) |
| Education |
0.03 |
0.02 |
−0.007 |
−0.06** |
−0.04* |
−0.04** |
| |
(0.018) |
(0.024) |
(0.021) |
(0.017) |
(0.018) |
(0.015) |
| Race/Ethnicity |
| Black |
−0.22** |
−0.29** |
−0.31** |
0.05 |
0.23** |
0.09 |
| |
(0.064) |
(0.083) |
(0.075) |
(0.061) |
(0.063) |
(0.054) |
| Other |
0.32** |
−0.07 |
−0.13 |
0.36** |
0.41** |
0.42** |
| |
(0.089) |
(0.116) |
(0.105) |
(0.085) |
(0.087) |
(0.076) |
| Hispanic |
0.08 |
−0.12 |
0.03 |
0.03 |
0.13* |
0.04 |
| |
(0.058) |
(0.076) |
(0.069) |
(0.056) |
(0.057) |
(0.050) |
| Multiracial (2+) |
−0.05 |
−0.09 |
−0.13 |
−0.03 |
0.04 |
−0.03 |
| |
(0.092) |
(0.120) |
(0.108) |
(0.087) |
(0.090) |
(0.078) |
| Constant |
1.07** |
1.42** |
1.32** |
1.67** |
1.64** |
1.58** |
| |
(0.12) |
(0.16) |
(0.14) |
(0.12) |
(0.12) |
(0.104) |
| R2 |
0.06 |
0.16 |
0.11 |
0.04 |
0.07 |
0.04 |
| N |
3,048 |
3,048 |
3,048 |
3,048 |
3,048 |
3,048 |
TABLE B.3 BIVARIATE REGRESSION OF CONFLICT ORIENTATION ON MEDIA CONSUMPTION: PROJECT IMPLICIT
| |
AVERAGE WEEKLY USE |
NEWSPAPER |
NETWORK TV |
CABLE TV |
RADIO |
INTERNET |
| Conflict orientation |
0.03** |
0.03* |
0.01 |
0.01 |
0.04** |
0.05** |
| |
(0.009) |
(0.012) |
(0.013) |
(0.012) |
(0.013) |
(0.012) |
| Constant |
3.18** |
2.04** |
3.26** |
2.59** |
3.02** |
4.99** |
| |
(0.069) |
(0.093) |
(0.106) |
(0.096) |
(0.102) |
(0.094) |
| R2 |
0.010 |
0.004 |
0.001 |
0.001 |
0.008 |
0.018 |
| N |
1094 |
1094 |
1093 |
1093 |
1094 |
1094 |
TABLE B.4 BIVARIATE REGRESSION OF CONFLICT ORIENTATION ON MEDIA CONSUMPTION: MECHANICAL TURK STUDY 1
| |
NEWSPAPER |
NETWORK TV |
CABLE TV |
RADIO |
INTERNET |
SOCIAL MEDIA |
| Conflict Orientation |
0.007 |
−0.04** |
0.01 |
0.01 |
0.01 |
−0.02 |
| |
(0.009) |
(0.012) |
(0.010) |
(0.017) |
(0.008) |
(0.020) |
| Constant |
−1.24** |
−2.15** |
−1.59** |
−2.79** |
−0.69** |
−3.13** |
| |
(0.091) |
(0.130) |
(0.100) |
(0.160) |
(0.080) |
(0.194) |
| χ2 |
0.49 |
0.004 |
0.33 |
0.53 |
0.23 |
0.42 |
| N |
886 |
886 |
886 |
886 |
886 |
886 |
TABLE B.5 REGRESSION OF FREQUENCY OF MEDIA EXPOSURE ON THE INTERACTION BETWEEN CONFLICT ORIENTATION AND POLITICAL INTEREST
| |
AVERAGE WEEKLY USE |
NEWSPAPER |
NETWORK TV |
CABLE TV |
RADIO |
INTERNET |
| Conflict orientation |
−0.02 |
0.03 |
−0.01 |
−0.012 |
−0.052 |
−0.041 |
| |
(0.029) |
(0.044) |
(0.049) |
(0.26) |
(1.10) |
(1.00) |
| Interest |
| Not very |
0.42 |
−0.17 |
0.17 |
0.214 |
0.451 |
1.452 |
| |
(0.333) |
(0.500) |
(0.559) |
(0.42) |
(0.84) |
(3.12)** |
| Somewhat |
1.28* |
0.55 |
1.18* |
0.757 |
1.691 |
2.230 |
| |
(0.282) |
(0.421) |
(0.473) |
(1.78) |
(3.72)** |
(5.67)** |
| Very |
2.18* |
1.26* |
2.03* |
1.664 |
2.454 |
3.505 |
| |
(0.281) |
(0.42) |
(0.471) |
(3.92)** |
(5.41)** |
(8.94)** |
| Extremely |
2.89 |
1.93* |
2.62* |
2.678 |
3.085 |
4.124 |
| |
(0.278) |
(0.42) |
(0.466) |
(6.37)** |
(6.87)** |
(10.63)** |
| CCS–Interest Interaction |
| Not very |
0.003 |
−0.04 |
0.003 |
0.015 |
0.007 |
0.035 |
| |
(0.037) |
(0.056) |
(0.063) |
(0.26) |
(0.11) |
(0.68) |
| Somewhat |
0.03 |
−0.04 |
0.02 |
−0.009 |
0.102 |
0.088 |
| |
(0.033) |
(0.049) |
(0.055) |
(0.19) |
(1.93) |
(1.92) |
| Very |
0.0008 |
−0.02 |
−0.04 |
−0.016 |
0.028 |
0.052 |
| |
(0.033) |
(0.050) |
(0.056) |
(0.32) |
(0.52) |
(1.11) |
| Extremely |
−0.001 |
−0.06 |
−0.03 |
−0.024 |
0.072 |
0.035 |
| |
(0.033) |
(0.049) |
(0.055) |
(0.49) |
(1.35) |
(0.76) |
| Constant |
1.34* |
1.00* |
1.60* |
1.123 |
0.918 |
2.072 |
| |
(0.256) |
(0.384) |
(0.431) |
(2.89)** |
(2.21)* |
(5.78)** |
| R2 |
0.27 |
0.09 |
0.12 |
0.14 |
0.12 |
0.24 |
| N |
1087 |
1087 |
1086 |
1,086 |
1,087 |
1,087 |
TABLE B.6 EFFECTS OF CONFLICT ORIENTATION AND INCIVILITY ON INFORMATION SEARCH
| |
(1) |
(2) |
(3) |
(3) |
| |
NUMBER OF ARTICLES |
TIME ON ARTICLES |
PROPORTION UNCIVIL |
PROPORTION POLITICAL |
| Conflict orientation |
−0.0675*** |
−4.486*** |
−0.0106** |
−0.00298 |
| |
(0.0187) |
(1.377) |
(0.00431) |
(0.00488) |
| Uncivil treatment |
0.356*** |
13.03 |
0.0820*** |
0.0764** |
| |
(0.133) |
(9.778) |
(0.0306) |
(0.0347) |
| Uncivil treatment × Conflict orientation |
0.0754*** |
3.810** |
0.0157*** |
0.0107* |
| |
(0.0240) |
(1.772) |
(0.00554) |
(0.00628) |
| Prefer news |
−0.0735 |
2.088 |
0.0205 |
0.101*** |
| |
(0.114) |
(8.438) |
(0.0264) |
(0.0299) |
| Political efficacy |
0.0186 |
0.436 |
0.00509 |
−0.00103 |
| |
(0.0234) |
(1.729) |
(0.00541) |
(0.00613) |
| Political interest |
0.192*** |
15.23*** |
0.0411** |
0.0829*** |
| |
(0.0738) |
(5.444) |
(0.0170) |
(0.0193) |
| Democrat |
−0.180 |
−19.39* |
−0.0700** |
−0.0319 |
| |
(0.149) |
(10.96) |
(0.0343) |
(0.0389) |
| Independent |
−0.230 |
−16.18 |
−0.0389 |
−0.00428 |
| |
(0.169) |
(12.48) |
(0.0390) |
(0.0442) |
| Strong party |
−0.129 |
−6.436 |
−0.0288 |
−0.0110 |
| |
(0.140) |
(10.31) |
(0.0323) |
(0.0366) |
| Female |
−0.152 |
−3.589 |
−0.0352 |
−0.0520* |
| |
(0.118) |
(8.734) |
(0.0273) |
(0.0310) |
| Reported anger |
0.00820 |
−2.707 |
−0.0109 |
0.00820 |
| |
(0.0733) |
(5.409) |
(0.0169) |
(0.0192) |
| Reported disgust |
0.00207 |
1.513 |
0.0150 |
−0.00913 |
| |
(0.0684) |
(5.043) |
(0.0158) |
(0.0179) |
| Reported anxiety |
0.0300 |
1.107 |
−0.00145 |
−0.00789 |
| |
(0.0620) |
(4.571) |
(0.0143) |
(0.0162) |
| Reported enthusiasm |
−0.114 |
−5.332 |
−0.0154 |
−0.0188 |
| |
(0.0744) |
(5.489) |
(0.0172) |
(0.0195) |
| Reported amusement |
0.153** |
7.743* |
0.0290** |
−0.000535 |
| |
(0.0635) |
(4.686) |
(0.0147) |
(0.0166) |
| Constant |
1.674*** |
45.03** |
0.111* |
0.0469 |
| |
(0.247) |
(18.24) |
(0.0571) |
(0.0647) |
| Observations |
299 |
299 |
299 |
299 |
| R2 |
0.107 |
0.088 |
0.106 |
0.165 |
TABLE B.7 ANXIETY FAILS TO MEDIATE THE CONFLICT ORIENTATION–INCIVILITY INTERACTION
| |
(1) |
(2) |
(3) |
(4) |
| |
ARTICLES READ |
TIME SPENT ON ARTICLES |
PROPORTION UNCIVIL |
PROPORTION POLITICAL |
| Conflict orientation |
0.0209 |
0.249 |
0.00772** |
0.0112** |
| |
(0.0165) |
(1.196) |
(0.00379) |
(0.00450) |
| Uncivil treatment |
−0.273** |
−8.846 |
−0.0642** |
−0.0697** |
| |
(0.127) |
(9.161) |
(0.0289) |
(0.0343) |
| Uncivil treatment × Conflict orientation |
−0.077*** |
−3.696** |
−0.015*** |
−0.0116* |
| |
(0.0240) |
(1.738) |
(0.00549) |
(0.00652) |
| Anxiety |
0.0246 |
−0.337 |
−0.00240 |
−0.00651 |
| |
(0.0556) |
(4.022) |
(0.0127) |
(0.0151) |
| Constant |
2.139*** |
74.53*** |
0.229*** |
0.300*** |
| |
(0.0906) |
(6.555) |
(0.0207) |
(0.0246) |
| Observations |
304 |
304 |
301 |
301 |
| R2 |
0.042 |
0.025 |
0.029 |
0.030 |
TABLE B.8 ANGER FAILS TO MEDIATE THE CONFLICT ORIENTATION–INCIVILITY INTERACTION
| |
(1) |
(2) |
(3) |
(4) |
| |
ARTICLES READ |
TIME SPENT ON ARTICLES |
PROPORTION UNCIVIL |
PROPORTION POLITICAL |
| Conflict orientation |
0.0206 |
0.292 |
0.00787** |
0.0112** |
| |
(0.0165) |
(1.195) |
(0.00379) |
(0.00450) |
| Uncivil treatment |
−0.263** |
−7.133 |
−0.0588** |
−0.0732** |
| |
(0.129) |
(9.357) |
(0.0295) |
(0.0351) |
| Uncivil treatment × Conflict orientation |
−0.078*** |
−3.819** |
−0.015*** |
−0.0113* |
| |
(0.0241) |
(1.742) |
(0.00550) |
(0.00654) |
| Anger |
0.00024 |
−2.612 |
−0.00914 |
0.000958 |
| |
(0.0509) |
(3.679) |
(0.0116) |
(0.0138) |
| Constant |
2.151*** |
75.81*** |
0.233*** |
0.297*** |
| |
(0.0911) |
(6.586) |
(0.0209) |
(0.0248) |
| Observations |
304 |
304 |
301 |
301 |
| R2 |
0.041 |
0.026 |
0.031 |
0.030 |
TABLE B.9 DISGUST FAILS TO MEDIATE THE CONFLICT ORIENTATION–INCIVILITY INTERACTION
| |
(1) |
(2) |
(3) |
(4) |
| |
ARTICLES READ |
TIME SPENT ON ARTICLES |
PROPORTION UNCIVIL |
PROPORTION POLITICAL |
| Conflict orientation |
0.0203 |
0.251 |
0.00764** |
0.0112** |
| |
(0.0166) |
(1.197) |
(0.00379) |
(0.00451) |
| Uncivil treatment |
−0.274** |
−9.059 |
−0.0694** |
−0.0746** |
| |
(0.131) |
(9.478) |
(0.0299) |
(0.0355) |
| Uncivil treatment × Conflict orientation |
−0.077*** |
−3.679** |
−0.0143** |
−0.0112* |
| |
(0.0243) |
(1.758) |
(0.00555) |
(0.00659) |
| Anger |
0.0134 |
0.0792 |
0.00497 |
0.00252 |
| |
(0.0498) |
(3.599) |
(0.0113) |
(0.0135) |
| Constant |
2.144*** |
74.33*** |
0.226*** |
0.296*** |
| |
(0.0904) |
(6.538) |
(0.0207) |
(0.0246) |
| Observations |
304 |
304 |
301 |
301 |
| R2 |
0.041 |
0.025 |
0.030 |
0.030 |
TABLE B.10 ENTHUSIASM FAILS TO MEDIATE THE CONFLICT ORIENTATION–INCIVILITY INTERACTION
| |
(1) |
(2) |
(3) |
(4) |
| |
ARTICLES READ |
TIME SPENT ON ARTICLES |
PROPORTION UNCIVIL |
PROPORTION POLITICAL |
| Conflict orientation |
0.0214 |
0.301 |
0.00787** |
0.0114** |
| |
(0.0165) |
(1.195) |
(0.00379) |
(0.00450) |
| Uncivil treatment |
−0.260** |
−8.865 |
−0.0650** |
−0.0722** |
| |
(0.124) |
(8.983) |
(0.0283) |
(0.0337) |
| Uncivil treatment × Conflict orientation |
−0.0752** |
−3.540** |
−0.014*** |
−0.0109* |
| |
(0.0241) |
(1.742) |
(0.00550) |
(0.00654) |
| Anger |
−0.0581 |
−3.602 |
−0.0106 |
−0.0113 |
| |
(0.0657) |
(4.752) |
(0.0150) |
(0.0178) |
| Constant |
2.180*** |
76.22*** |
0.234*** |
0.303*** |
| |
(0.0929) |
(6.723) |
(0.0213) |
(0.0253) |
| Observations |
304 |
304 |
301 |
301 |
| R2 |
0.043 |
0.026 |
0.031 |
0.031 |
TABLE B.11 AMUSEMENT FAILS TO MEDIATE THE CONFLICT ORIENTATION–INCIVILITY INTERACTION
| |
(1) |
(2) |
(3) |
(4) |
| |
ARTICLES READ |
TIME SPENT ON ARTICLES |
PROPORTION UNCIVIL |
PROPORTION POLITICAL |
| Conflict orientation |
0.0190 |
0.160 |
0.00729* |
0.0116** |
| |
(0.0166) |
(1.198) |
(0.00380) |
(0.00452) |
| Uncivil treatment |
−0.288** |
−10.43 |
−0.0718** |
−0.0673* |
| |
(0.126) |
(9.136) |
(0.0288) |
(0.0342) |
| Uncivil treatment × Conflict orientation |
−0.080*** |
−3.845** |
−0.015*** |
−0.0108* |
| |
(0.0241) |
(1.741) |
(0.00549) |
(0.00653) |
| Amusement |
0.0608 |
3.455 |
0.0158 |
−0.0125 |
| |
(0.0562) |
(4.065) |
(0.0128) |
(0.0153) |
| Constant |
2.113*** |
72.25*** |
0.219*** |
0.305*** |
| |
(0.0932) |
(6.744) |
(0.0213) |
(0.0253) |
| Observations |
304 |
304 |
301 |
301 |
| R2 |
0.045 |
0.027 |
0.034 |
0.032 |
TABLE B.12 THE IMPACT OF CONFLICT ORIENTATION AND INCIVILITY ON GENERAL MOOD
| |
(1) |
(2) |
| |
POSITIVE MOOD |
NEGATIVE MOOD |
| Conflict orientation |
0.0144* |
0.00709 |
| |
(0.00789) |
(0.00697) |
| Uncivil treatment |
−0.00940 |
0.295*** |
| |
(0.0583) |
(0.0515) |
| Uncivil treatment × Conflict orientation |
0.0202* |
−0.0138 |
| |
(0.0116) |
(0.0102) |
| Constant |
0.601*** |
0.553*** |
| |
(0.0396) |
(0.0350) |
| Observations |
342 |
342 |
| R2 |
0.061 |
0.130 |
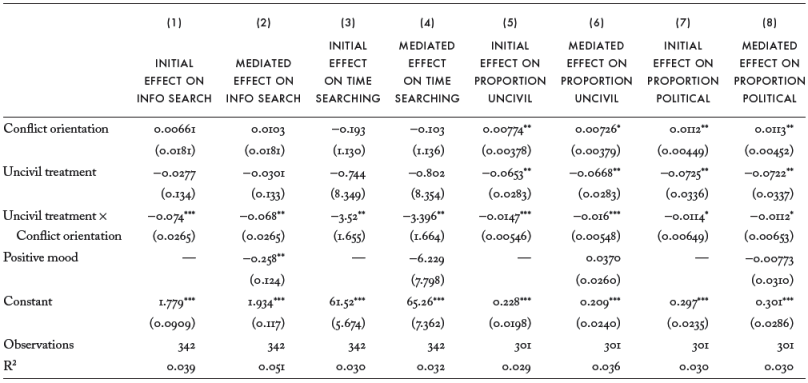
TABLE B.13 THE MEDIATING EFFECT OF POSITIVE MOOD ON THE CONFLICT ORIENTATION–INCIVILITY INTERACTION
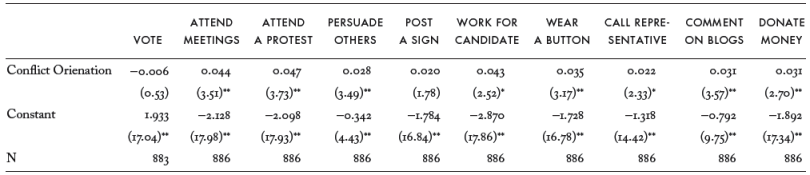
TABLE B.14 BIVARIATE REGRESSION OF POLITICAL PARTICIPATION ON CONFLICT ORIENTATION (PROJECT IMPLICIT)
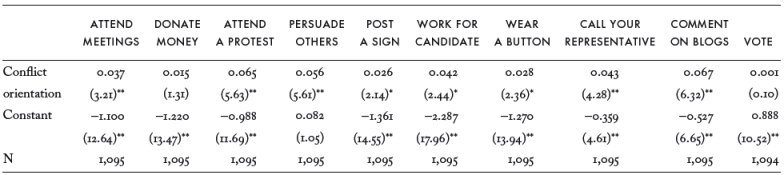
TABLE B.15 BIVARIATE REGRESSION OF POLITICAL PARTICIPATION ON CONFLICT ORIENTATION (MECHANICAL TURK STUDY 1)
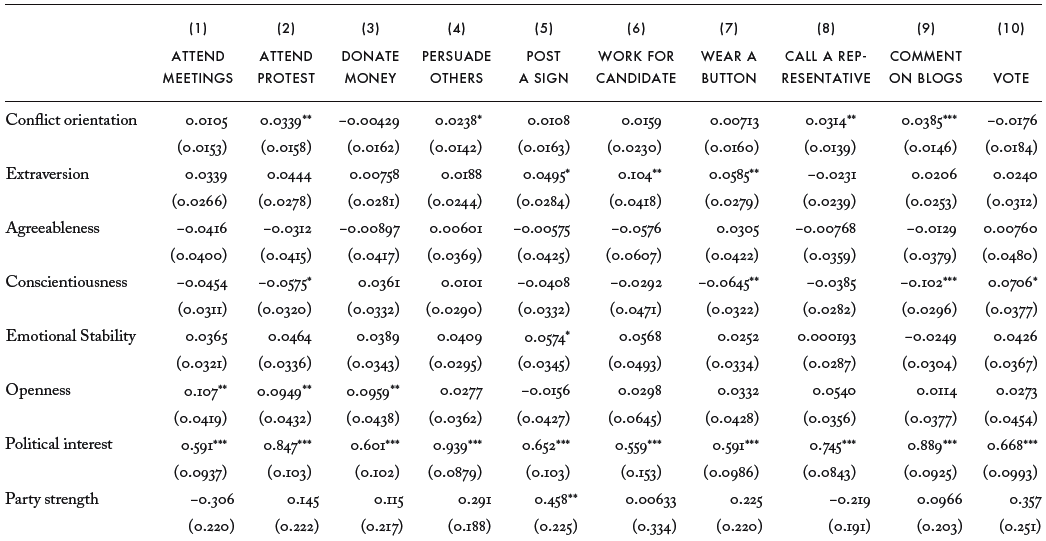
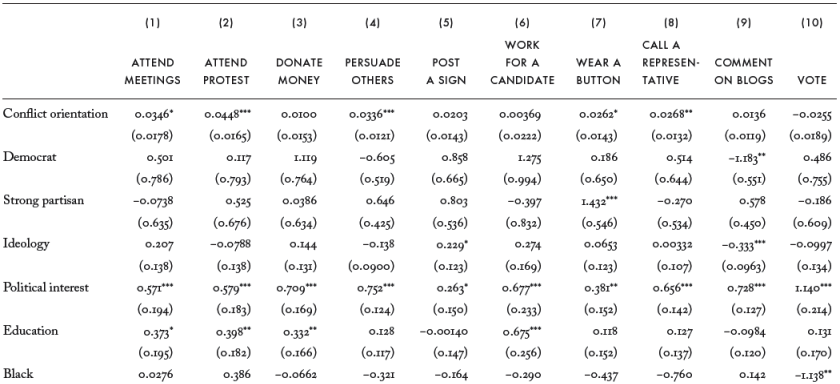
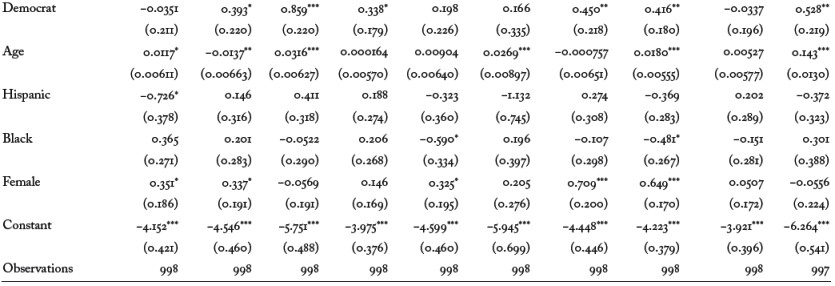
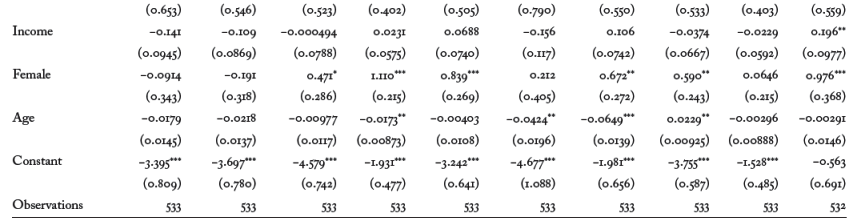
TABLE B.16 EFFECTS OF CONFLICT ORIENTATION ON PARTICIPATION, CONTROLLING FOR DEMOGRAPHICS (PROJECT IMPLICIT)
TABLE B.17 EFFECTS OF CONFLICT ORIENTATION ON PARTICIPATION, CONTROLLING FOR DEMOGRAPHICS (MECHANICAL TURK STUDY 1)
TABLE B.18 EFFECTS OF CONFLICT ORIENTATION AND INCIVILITY ON WILLINGNESS TO SHARE VIDEO CLIP
| |
INTEREST IN SHARING STORY |
| Uncivil clip |
0.36* |
| |
(0.176) |
| Conflict orientation |
0.11* |
| |
(0.038) |
| Incivility × Conflict orientation |
−0.002 |
| |
(0.051) |
| Party ID: Democrat |
0.34 |
| |
(0.254) |
| Party ID: Independent |
0.46 |
| |
(0.265) |
| Party strength |
0.66* |
| |
(0.212) |
| Ideology |
−0.02 |
| |
(0.059) |
| Female |
0.09 |
| |
(0.160) |
| Age |
−0.007 |
| |
(0.0047) |
| Education: High school |
0.18 |
| |
(0.288) |
| Education: Some college |
−0.30 |
| |
(0.299) |
| Education: Bachelor’s degree + |
−0.34 |
| |
(0.310) |
| Income |
−0.04* |
| |
(0.018) |
| White |
−0.82* |
| |
(0.188) |
| Hispanic |
−0.21 |
| |
(0.248) |
| Constant |
−1.73* |
| |
(0.471) |
| Pseudo R2 |
0.06 |
| N |
3017 |
TABLE B.19 PARTICIPATORY EFFECTS OF THE INTERACTION BETWEEN CONFLICT ORIENTATION AND RACE (PROJECT IMPLICIT)
| |
(1) |
(2) |
(3) |
(4) |
| |
COMMENT ON BLOGS |
ATTEND A PROTEST |
PERSUADE OTHERS |
CALL A REPRESENTATIVE |
| Conflict orientation |
0.0407*** |
0.0210 |
0.0234 |
0.0279* |
| |
(0.0151) |
(0.0164) |
(0.0146) |
(0.0142) |
| Extraversion |
0.0206 |
0.0426 |
0.0188 |
−0.0236 |
| |
(0.0253) |
(0.0279) |
(0.0244) |
(0.0239) |
| Agreeableness |
−0.0139 |
−0.0268 |
0.00611 |
−0.00605 |
| |
(0.0380) |
(0.0417) |
(0.0369) |
(0.0359) |
| Conscientiousness |
−0.102*** |
−0.0603* |
0.0101 |
−0.0384 |
| |
(0.0296) |
(0.0324) |
(0.0290) |
(0.0282) |
| Emotional stability |
−0.0250 |
0.0493 |
0.0409 |
0.000475 |
| |
(0.0305) |
(0.0338) |
(0.0295) |
(0.0288) |
| Openness |
0.0109 |
0.103** |
0.0279 |
0.0551 |
| |
(0.0378) |
(0.0438) |
(0.0362) |
(0.0356) |
| Political interest |
0.890*** |
0.858*** |
0.939*** |
0.746*** |
| |
(0.0926) |
(0.104) |
(0.0879) |
(0.0843) |
| Party strength |
0.0918 |
0.171 |
0.291 |
−0.215 |
| |
(0.203) |
(0.224) |
(0.188) |
(0.191) |
| Democrat |
−0.0302 |
0.380* |
0.338* |
0.412** |
| |
(0.197) |
(0.221) |
(0.179) |
(0.181) |
| Age |
0.00540 |
−0.0148** |
0.000136 |
0.0178*** |
| |
(0.00578) |
(0.00667) |
(0.00571) |
(0.00555) |
| Hispanic |
0.201 |
0.160 |
0.189 |
−0.365 |
| |
(0.289) |
(0.315) |
(0.274) |
(0.282) |
| Black |
−0.291 |
0.859** |
0.235 |
−0.260 |
| |
(0.353) |
(0.377) |
(0.368) |
(0.335) |
| Female |
0.0520 |
0.320* |
0.145 |
0.647*** |
| |
(0.172) |
(0.192) |
(0.169) |
(0.170) |
| Black × Conflict orientation |
−0.0315 |
0.165*** |
0.00544 |
0.0499 |
| |
(0.0482) |
(0.0583) |
(0.0478) |
(0.0461) |
| Constant |
−3.917*** |
−4.629*** |
−3.977*** |
−4.242*** |
| |
(0.397) |
(0.464) |
(0.376) |
(0.380) |
| Observations |
998 |
998 |
998 |
998 |
TABLE B.20 PARTICIPATORY EFFECTS OF THE INTERACTION BETWEEN CONFLICT ORIENTATION AND RACE (MECHANICAL TURK STUDY 1)
| |
(1) |
(2) |
(3) |
(4) |
| |
COMMENT ON BLOGS |
ATTEND PROTEST |
PERSUADE OTHERS |
CALL A REPRESENTATIVE |
| Conflict orientation |
0.0141 |
0.0452*** |
0.0288** |
0.0251* |
| |
(0.0121) |
(0.0168) |
(0.0123) |
(0.0134) |
| Democrat |
−1.187** |
0.113 |
−0.563 |
0.525 |
| |
(0.551) |
(0.794) |
(0.521) |
(0.643) |
| Strong partisan |
0.583 |
0.527 |
0.600 |
−0.282 |
| |
(0.451) |
(0.676) |
(0.427) |
(0.534) |
| Ideology |
−0.335*** |
−0.0801 |
−0.125 |
0.00736 |
| |
(0.0966) |
(0.138) |
(0.0909) |
(0.107) |
| Political interest |
0.727*** |
0.579*** |
0.767*** |
0.661*** |
| |
(0.127) |
(0.183) |
(0.125) |
(0.142) |
| Education |
−0.0979 |
0.399** |
0.125 |
0.124 |
| |
(0.120) |
(0.183) |
(0.117) |
(0.137) |
| Black |
0.0415 |
0.316 |
0.905 |
−0.317 |
| |
(0.610) |
(0.751) |
(0.738) |
(0.743) |
| Black × Conflict orientation |
−0.0129 |
−0.0113 |
0.156* |
0.0647 |
| |
(0.0583) |
(0.0813) |
(0.0819) |
(0.0846) |
| Income |
−0.0223 |
−0.108 |
0.0202 |
−0.0399 |
| |
(0.0593) |
(0.0869) |
(0.0577) |
(0.0668) |
| Female |
0.0629 |
−0.192 |
1.132*** |
0.591** |
| |
(0.216) |
(0.318) |
(0.215) |
(0.242) |
| Age |
−0.00302 |
−0.0219 |
−0.0174** |
0.0232** |
| |
(0.00889) |
(0.0138) |
(0.00876) |
(0.00925) |
| Constant |
−1.528*** |
−3.699*** |
−1.939*** |
−3.753*** |
| |
(0.485) |
(0.780) |
(0.480) |
(0.587) |
| Observations |
533 |
533 |
533 |
533 |
TABLE B.21 PARTICIPATORY EFFECTS OF THE INTERACTION BETWEEN CONFLICT ORIENTATION AND GENDER (PROJECT IMPLICIT)
| |
(1) |
(2) |
(3) |
(4) |
| |
COMMENT ON BLOGS |
PROTEST |
PERSUADE OTHERS |
CALL WA REP |
| Conflict orientation |
0.0538** |
0.0441* |
4.25e−05 |
0.0377* |
| |
(0.0216) |
(0.0235) |
(0.0209) |
(0.0208) |
| Extraversion |
0.0208 |
0.0444 |
0.0183 |
−0.0231 |
| |
(0.0253) |
(0.0278) |
(0.0245) |
(0.0239) |
| Agreeableness |
−0.0120 |
−0.0307 |
0.00500 |
−0.00751 |
| |
(0.0379) |
(0.0415) |
(0.0370) |
(0.0359) |
| Conscientiousness |
−0.102*** |
−0.0569* |
0.00951 |
−0.0384 |
| |
(0.0296) |
(0.0320) |
(0.0291) |
(0.0282) |
| Emotional stability |
−0.0276 |
0.0451 |
0.0450 |
−0.000775 |
| |
(0.0306) |
(0.0337) |
(0.0297) |
(0.0288) |
| Openness |
0.0135 |
0.0968** |
0.0253 |
0.0548 |
| |
(0.0379) |
(0.0434) |
(0.0362) |
(0.0357) |
| Interest |
0.891*** |
0.847*** |
0.940*** |
0.746*** |
| |
(0.0925) |
(0.103) |
(0.0882) |
(0.0843) |
| Party strength |
0.0992 |
0.145 |
0.287 |
−0.218 |
| |
(0.203) |
(0.222) |
(0.189) |
(0.191) |
| Democrat |
−0.0382 |
0.393* |
0.344* |
0.414** |
| |
(0.197) |
(0.220) |
(0.179) |
(0.181) |
| Age |
0.00551 |
−0.0136** |
−0.000149 |
0.0181*** |
| |
(0.00578) |
(0.00663) |
(0.00570) |
(0.00556) |
| Hispanic |
0.197 |
0.142 |
0.194 |
−0.370 |
| |
(0.290) |
(0.316) |
(0.274) |
(0.283) |
| Black |
−0.143 |
0.206 |
0.187 |
−0.478* |
| |
(0.282) |
(0.284) |
(0.267) |
(0.267) |
| Female |
−0.0422 |
0.286 |
0.306 |
0.611*** |
| |
(0.197) |
(0.210) |
(0.199) |
(0.194) |
| Female × Conflict orientation |
−0.0259 |
−0.0170 |
0.0394 |
−0.0103 |
| |
(0.0266) |
(0.0289) |
(0.0257) |
(0.0252) |
| Constant |
−3.904*** |
−4.542*** |
−4.025*** |
−4.216*** |
| |
(0.396) |
(0.460) |
(0.379) |
(0.380) |
| Observations |
998 |
998 |
998 |
998 |
TABLE B.22 PARTICIPATORY EFFECTS OF THE INTERACTION BETWEEN CONFLICT ORIENTATION AND GENDER (MECHANICAL TURK STUDY 1)
| |
(1) |
(2) |
(3) |
(4) |
| |
COMMENT ON BLOGS |
PROTEST |
PERSUADE OTHERS |
CALL REP |
| Conflict orientation |
0.0310* |
0.0598*** |
0.0259 |
0.0528*** |
| |
(0.0161) |
(0.0218) |
(0.0158) |
(0.0188) |
| Democrat |
−1.181** |
0.151 |
−0.611 |
0.556 |
| |
(0.552) |
(0.798) |
(0.520) |
(0.648) |
| Strong partisan |
0.577 |
0.511 |
0.648 |
−0.292 |
| |
(0.451) |
(0.680) |
(0.426) |
(0.537) |
| Ideology |
−0.340*** |
−0.0810 |
−0.137 |
−1.20e−05 |
| |
(0.0965) |
(0.138) |
(0.0902) |
(0.107) |
| Political interest |
0.734*** |
0.579*** |
0.752*** |
0.667*** |
| |
(0.128) |
(0.183) |
(0.124) |
(0.142) |
| Education |
−0.0995 |
0.399** |
0.126 |
0.131 |
| |
(0.120) |
(0.183) |
(0.117) |
(0.136) |
| Black |
0.124 |
0.370 |
−0.309 |
−0.794 |
| |
(0.403) |
(0.544) |
(0.403) |
(0.536) |
| Income |
−0.0166 |
−0.103 |
0.0215 |
−0.0293 |
| |
(0.0596) |
(0.0876) |
(0.0576) |
(0.0670) |
| Female |
−0.107 |
−0.284 |
1.202*** |
0.420 |
| |
(0.242) |
(0.337) |
(0.249) |
(0.262) |
| Age |
−0.00244 |
−0.0205 |
−0.0174** |
0.0237** |
| |
(0.00887) |
(0.0137) |
(0.00877) |
(0.00922) |
| Female × Conflict orientation |
−0.0382 |
−0.0355 |
0.0182 |
−0.0513** |
| |
(0.0234) |
(0.0332) |
(0.0244) |
(0.0260) |
| Constant |
−1.546*** |
−3.778*** |
−1.926*** |
−3.847*** |
| |
(0.486) |
(0.783) |
(0.478) |
(0.592) |
| Observations |
533 |
533 |
533 |
533 |