Figure 28.1
Collision caused by wrong way cycling (cause of 16 percent of car-bike collisions)
28
Accidents
History of Cycling Accident Studies
Accurate knowledge about cycling accidents will serve you well in two ways. With such knowledge, you will understand why the Effective Cycling techniques are also a very good cycling safety program and will ride with fewer accidents and more confidence. You will also be better able to judge the safety claims of typical bike-safety programs, bicycle advocates, and bikeway advocates. Accurate knowledge consists of knowing the types of accidents, how they are caused, how frequent they are, and the typical injuries they cause.
The study of cycling accidents is quite new; there were no scientific studies of accidents to American cyclists until 1974. Everything thought, said, or written about bike safety before 1974 was based on cyclists’ personal experience or on the anticycling mindset of highway personnel. In this period, there were two sources of cycling safety information. Nearly all of it came from the motoring establishment (highway departments, traffic police, motoring organizations, and the consultants they employed). These people had no cycling knowledge, experience, or interest, and they wanted to reserve the roads for motorists. So they created the “bike-safety” picture of cycling hazards. “The roads belong to cars. Stay out of our way or we’ll smash you flat!” No accident data supported this picture, which contradicted the law, but the deception succeeded. The motoring establishment got away with it by picturing helpless children and big cars. The public was almost entirely motorized, and the few adult cyclists had no power and didn’t foresee the consequences of not stopping the “bike-safety” programs at their start. The motoring establishment used this picture to frighten cyclists off the roads and to justify laws, policies, and instructions that kept adults away from cycling and child cyclists at the edge of the road. The only other source of cycling-safety information was the small group of adult cyclists, who recognized that the “bike-safety” picture was all wrong but had no power to spread their views beyond their own circle of cyclists. Many of the adult cyclists learned from their experiences on the road and from their discussions among themselves. These people recognized that disobeying the vehicular rules of the road created conflicts that caused collisions. They also recognized that following the rules of the road allowed them to ride with much fewer hassles. In their view, “bike-safety” instruction was dangerous because it ignored, and even contradicted, the normal rules of the road and good driving practices. However, no accident data existed to support or refute either viewpoint.
In 1974, Kenneth D. Cross completed the first study that distinguished between the “bike-safety” picture of motorists smashing into slow cyclists and the cyclists’ picture of car-bike collisions caused by motorists or cyclists disobeying the normal rules of the road. The study had been commissioned by the California Office of Traffic Safety (controlled by the California Highway Patrol) with the expectation that its data would prove (proof is not scientifically possible) the “bike-safety” case and provide a scientific basis for the bikeway program that the CHP and others were promoting. When I showed that Cross’s study in fact disproved the “bike-safety” and bikeway views and strongly supported the cyclists’ view, the report was hidden and no further copies were distributed.
Later, the National Highway Traffic Safety Administration commissioned Cross to conduct a better study based on a nationwide sample; the results were published by Cross and Gary Fisher as A Study of Bicycle/Motor-Vehicle Accidents: identification of Problem Types and Countermeasure Approaches (NHTSA, 1977). This study conclusively supported the cyclists’ view and disproved the “bike-safety” and bikeway views. It also showed that cyclists are not incapable—that they learn from experience how to avoid car-bike collisions, even though this skill is never taught in school.
During this same period, the National Safety Council published two studies of bicycle accidents and bicycle use among elementary-school children and among college-associated adults. Among other things, these studies showed that car-bike collisions cause only a small fraction of cyclist casualties: 18 percent for college adults and only 10 percent for children (despite all the propaganda about helpless children on the highways).
In 1975, Jerrold A. Kaplan published his Characteristics of the Regular Adult Bicycle User (master’s thesis, University of Maryland, available through the National Technical Information Service, Springfield, VA), which was a study of bicycle accidents and bicycle use among members of the League of American Wheelmen and the Washington Area Bicyclist Association. Kaplan knew the important questions to ask because he was both a transportation engineer and a cyclist. His data give accident rates for different kinds of roadways, for different cycling activities, and for cyclists of differing ages and experience levels. Kaplan’s data also show that car-bike collisions caused only a small fraction of cyclist casualties (17 percent, in his study). But, equally important, the data show the importance of cyclist skill in reducing accident rates. As expected, those cyclists with the most experience had the lowest accident rates. Those cyclists who habitually cycled in the most dangerous conditions of road and traffic had adjusted to those conditions so well that they had the lowest accident rates of all. However, even the comparatively skilled cyclists Kaplan studied hadn’t mastered bike paths, where their accident rate was nearly three times their rate on the road.
At the end of 1984, the British Cyclists’ Touring Club (the British predecessor of the League of American Wheelmen, or LAW) produced a study of cycling and cycling accidents based on data from 9,000 members. I think that the study was intended to show which parts of the British road system are most hazardous, but it does not do that very well. The two most important conclusions I draw from the data (the authors did not perform these calculations, and some of their comments show that they did not understand how to use their data) are the effect of experience upon accident rate. Four years of cycling experience drops the accident rate per mile by 70 percent, a figure that is similar to the reduction of 80 percent between college-associated adults and LAW members. As annual miles increase from 250 to 1,250, accident rate per mile drops by 50 percent; as they increase to 3,000, the accident rate drops by 72 percent. These two conclusions show that most cycling accidents are avoidable and that cyclists learn by experience how to avoid them. The accident rates in this study cannot properly be compared against the American studies because of different definitions of injury severity in the two nations.
In 1980, Cross published a study of “non-motor-vehicle” accidents to cyclists in Santa Barbara County. The most important conclusion that I draw from his data (he did not make this calculation from his data) is the relationship between the accident rate and experience. After a peak at about 750 miles per year, the annual probability of an accident drops to about 50 percent regardless of the miles per year. In other words, the accident rate per mile decreases as much as the miles per year increase.
The value of these studies is in the data they contain, because many of the authors were not cyclists and most did not know that the important question was to decide between the similar “bike-safety” and bikeway pictures and the very different cyclists’ picture. The only study that compares these studies and uses them to decide between the two pictures is in my book Bicycle Transportation (MIT Press, 1983, 1994), which supersedes my Cycling Transportation Engineering (Custom Cycle Fitments, 1977). Most of the accident data presented in Effective Cycling come from those books, but are derived from data given by Cross, Kaplan, and the National Safety Council.
Although the accident statistics disprove (disproof is scientifically possible) the “bike-safety” and bikeway pictures and support the cyclists’ picture, the motoring establishment has not changed its point of view. In early 1983, I was present when the California Highway Patrol stirred up the anticycling emotions of legislators by claiming that California’s bicycle accidents were caused by “those cyclists who thought that they were driving vehicles.” This was a blatant lie. The CHP had no study showing that cyclists who obeyed the traffic laws for drivers of vehicles were causing any car-bike collisions, let alone most of them. The statement was based upon the emotions aroused when the general motoring public considers cyclists using its roads and delaying its travel. It is the same old “bike-safety” picture, but instead of being a piece of self-serving fiction (as it was in the 1930s when motorists invented it), it is now a plain lie because it contradicts well-established facts.
You may wonder, reading this in 2012 or later, why this book does not contain statistics from later years. The answer is simple. Today, no organization, governmental or private, cares enough about learning new facts about car-bike collisions to fund such studies as I have quoted. Back in 1975, there were so few data that organizations with an interest in bicycle transportation were willing to fund good statistical studies. But once they discovered that the data strongly supported cycling according to the rules of the road for drivers of vehicles and, equally strongly, demonstrated that bikeways could not produce a significant reduction in car-bike collisions, they lost interest. These organizations are interested only in bikeways; evidence that demonstrates the futility, at the least, of bikeways doesn’t interest them. Tables 28.1 and 28.2 present the facts.
Table 28.1
Cyclist accident rate by cyclist type
Cyclist type |
Miles per accident |
Children |
1,500 |
College-associated adults |
2,000 |
Club cyclists |
10,000 |
Table 28.2
Accident types and proportions (club cyclists, United States)
Type of accident |
Proportion |
Percent |
Falls |
½ |
50% |
Car-bike collisions |
1/6 |
17% |
Bike-bike collisions |
1/6 |
17% |
Bike-dog collisions |
1/12 |
8% |
All other accidents |
1/12 |
8% |
Basic Accident Rate
The cyclist accident rate depends far more on who you are than on where or when you ride, as table 28.1 shows. These accidents involve either bicycle damage or sufficient injury to require medical treatment. If simple falls are considered, American college-associated adult cyclists fall off their bicycles about once every 100 miles. The great improvement for club cyclists shows that their cycling techniques are much safer than those used by other American bicyclists. I teach club cycling techniques because they have proved safer, better, and more fun over the years.
Accident Types and Frequencies, and Cyclists’ Skill Levels
When you mention cycling accidents, most people assume that you mean car-bike collisions, because this is the only kind they worry about. This is wrong, because car-bike collisions account for only about 12 percent of cycling accidents. For children they account for only 10 percent; for nonclub adults, 18 percent, and for cycling club members, 17 percent. The proportion of each kind of accident incurred by club cyclists is given in table 28.2.
There are other bicycle-accident statistics that astonish most people. Accidents among club cyclists occur somewhat more frequently upon roads with heavy traffic than upon roads with light traffic, but by far the most dangerous facility is the bike path, with an accident rate 2.6 times that of the average roadway. Cyclists who often ride under difficult conditions (in heavy traffic, in mountainous terrain, at night, and in the rain) have a lower accident rate than flatland, fair-weather recreational cyclists. Racing is no more dangerous to racers than touring is to tourists. Riding to work, done largely on main arterial streets at rush hour, is the safest of all known cycling activities. Even among club cyclists, the more cycling experience and the more miles per year, the lower the accident rate. Together with the low accident rate of club cyclists relative to other Americans on bicycles, these statistics demonstrate that cycling skill is the most important ingredient in reducing cycling accidents. Later we will see that special bicycle facilities have very little possibility of reducing cycling accidents. The most important problem in the American cycling transportation system is the incompetence of cyclists.
Falling Accidents
Falling accidents result from stopping, skidding, diverting, or insufficient speed.
Stopping-type accidents occur when the bicycle stops moving forward. Typical causes are chuckholes, parallel-bar grates, speed berms and curbs, driving off the roadway, or extreme use of the front brake. (Of course, hitting a car stops the bicycle, but that is considered a car-bike collision accident unless the car is parked.)
When the bicycle stops or slows suddenly, the cyclist continues in forward motion over the handlebars and typically lands on his head, on one shoulder, or on his outstretched arms. Typical injuries are fractures of skull or facial bones, collarbones, or lower arms and abrasions and contusions of hands, upper arms, shoulders, scalp, and face. Puncture wounds may be produced by glass or rocks on the roadway or by sharp portions of the bicycle in the handlebar area. The bicycle typically incurs an indented front wheel or bent-back front forks.
Skidding-type accidents occur when the bicycle’s tires lose sideways traction. The bicycle proceeds sideways on its side, generally with the cyclist sliding on his or her side still astride it. The cyclist lands on thigh, hip, upper arm, or shoulder. Sometimes his head hits the pavement hard. Typical causes are turning on slippery surfaces, (such as wet roads, wet manhole covers or painted areas, or gravel) or simply traveling too fast for a curve. The use of brakes on a curve when traveling at near maximum speed for the curve also causes this kind of accident. Cyclists have also been known to fall when applying power in low gear on especially slippery surfaces, such as when accelerating across crosswalk lines in the rain after a stop. Typical injuries are large abrasions of outer surfaces of legs and arms (which nearly always heal quickly), with sometimes a fractured collarbone and rarely a fractured hip. Abrasions of the side of the head and (less frequently) fracture of the skull are not uncommon. Abrasion injuries are far more frequent than impact injuries, because the cyclist appears to fall relatively slowly as the bicycle skids out from under him and because his fall is broken by his hip and shoulder before the head hits.
The diverting type of fall is the most unexpected and unpleasant: it feels as though some outside force has slammed you downward onto the pavement. These accidents occur when the bicycle steers out from under the cyclist, leaving the cyclist unsupported. Typical causes are diagonal railroad tracks or parallel-to-traffic expansion joints in concrete roadways, attempting to climb back on the pavement after being forced off, parallel-bar grates or bridge expansion joints or bridge structures, and inequalities between gutter or driveway and pavement. Slippery conditions aggravate these causes. Steering problems that cause the front wheel to oscillate at high speed also can cause a diverting-type fall. Typical injuries are abrasions of hands, face, knees, thighs, and elbows, but fractures caused by impact appear to be more prevalent than with any other kind of fall, and fatal, disabling, and disfiguring skull and facial fractures are especially frequent.
In accidents caused by insufficient speed, the cyclist slows down because of traffic (motor, bicycle, or pedestrian) and makes a mistake. The cyclist either falls left when his right foot is extended toward the ground, fails to get a foot out of the toestrap, or plans to be able to continue slowly but has either to slow down more or steer suddenly. Injuries, if any, are minor.
The cyclist’s traveling speed when any accident occurs has a distinct effect upon the location of injuries. The cyclist traveling fast has a greater probability of hitting the ground with the arms, shoulder, or head; the cyclist traveling slowly has a greater chance of hitting with the leg or hip.
Of all cyclists who die from cycling accidents, 75 percent die from brain injuries. Almost all other injuries, and all the typical ones, heal reasonably quickly and without permanent effects (except facial-impact injuries). Probably for the same reasons, 75 percent of the permanent disabilities suffered by cyclists are brain-damage disabilities, because the brain never heals where it is injured. Wear your helmet!
Car-Bike Collisions
Car-bike collisions have been studied more carefully than any other type of cycling accident because the public fears them. The general public believes that most car-bike collisions are caused by motorists overtaking cyclists. Nothing could be further from the truth, as table 28.3 shows.
Table 28.3
Types and proportions of car-bike collisions, United States
Type of collision |
Urban |
Rural |
Total |
Turning and crossing |
89% |
60% |
85% |
Motorist overtaking cyclist |
7% |
30% |
9.5% |
Other parallel path |
4% |
10% |
4.7% |
Furthermore, in most cases, the cyclist was disobeying a rule of the road—in at least 52 percent of urban car-bike collisions and in at least 67 percent of rural ones. Even if the cyclist was not disobeying the rules, he or she was unlikely to have been riding in the standard manner, as table 28.4 shows.
Table 28.4
Cyclist’s position before collision
Urban |
Rural |
Total |
|
Entering roadway |
23% |
16% |
22% |
Riding on wrong side of roadway |
20% |
15% |
19% |
Turning or swerving from curb lane |
14% |
37% |
16% |
Riding on sidewalk |
8% |
3% |
7% |
Riding in correct position |
38% |
30% |
37% |
The major causes of car-bike collisions are the following:
1. Cyclist’s failure to yield to crossing traffic (25 percent)
2. Wrong-way cycling (17 percent)
3. Sidewalk cycling (17 percent)
4. Cyclist’s failure to yield when changing lanes (13 percent)
5. Motorist’s improper left turn (8 percent)
6. Motorist’s improper right turn (5 percent)
7. Motorist’s restart from stop sign (4 percent)
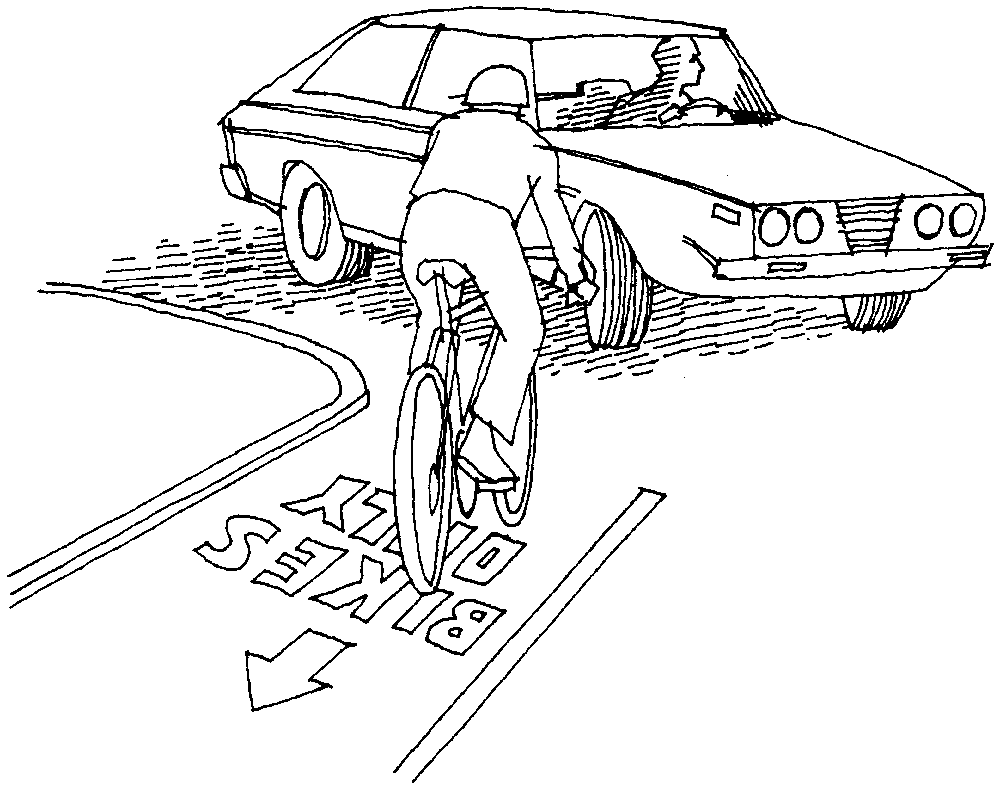
In short, most car-bike collisions are caused by the cyclist doing something unusual. Often it is something that is always wrong, such as riding on the left side of the road (figure 28.1), whereas at other times it is a normal action (such as entering a roadway from a driveway) that is done improperly (figure 28.2).
Figure 28.1
Collision caused by wrong way cycling (cause of 16 percent of car-bike collisions)
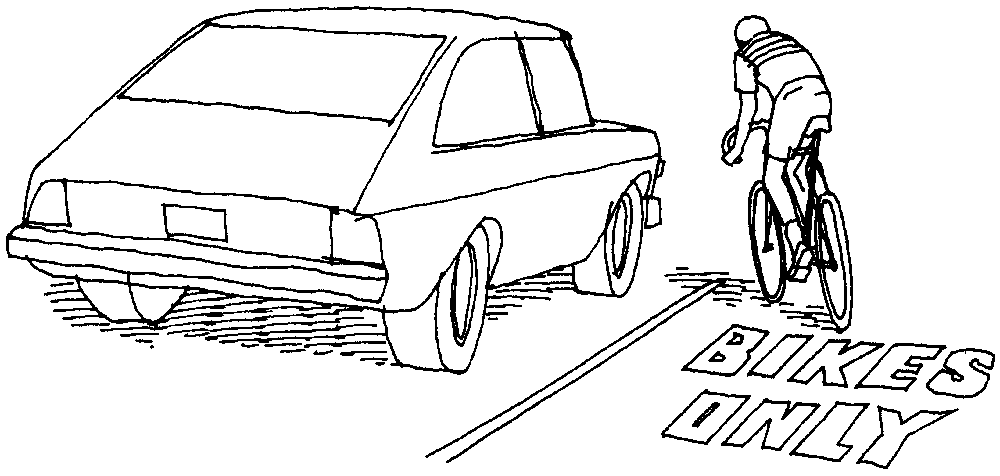
Figure 28.2
Collision caused by turning or swerving from the curb lane (cause of 16 percent of car-bike collisions)
Other types of car-bike collision are caused by improper motorist actions. A very frequent one is the motorist improper left turn, figure 28.3.
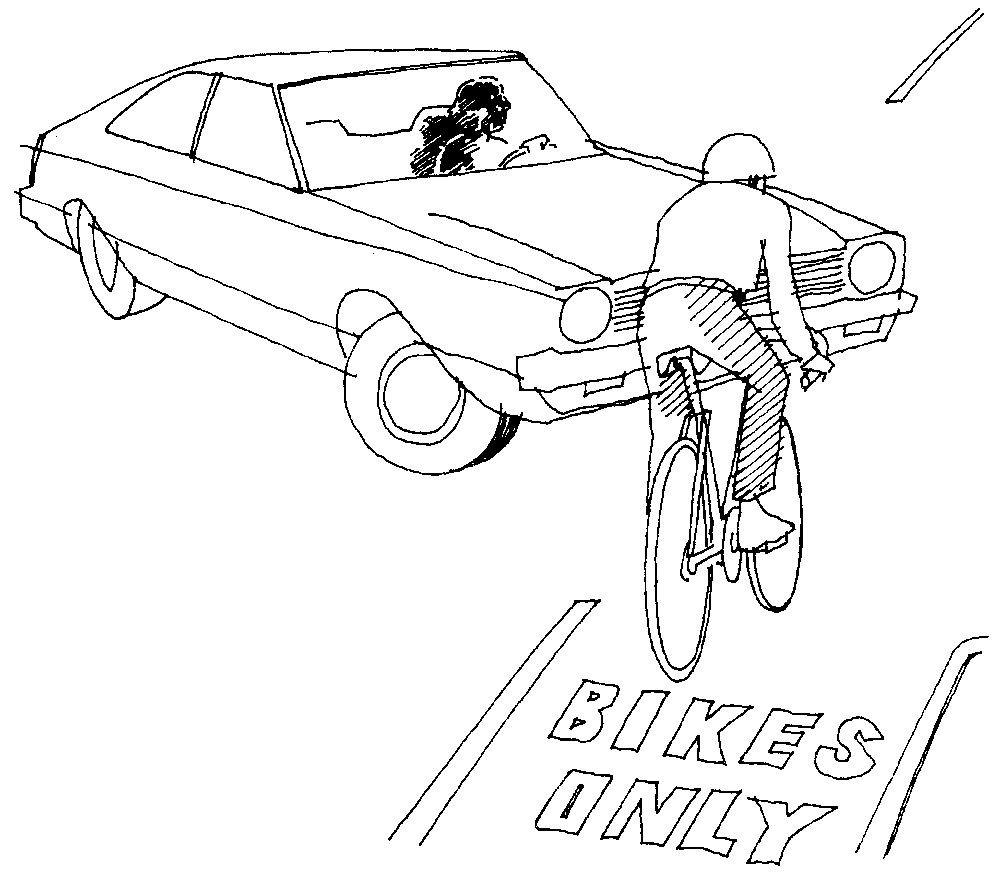
Figure 28.3
Collision caused by improper motorist left turn (cause of 8 percent of car-bike collisions)
Another common motorist error is the improper right turn, figure 28.4.
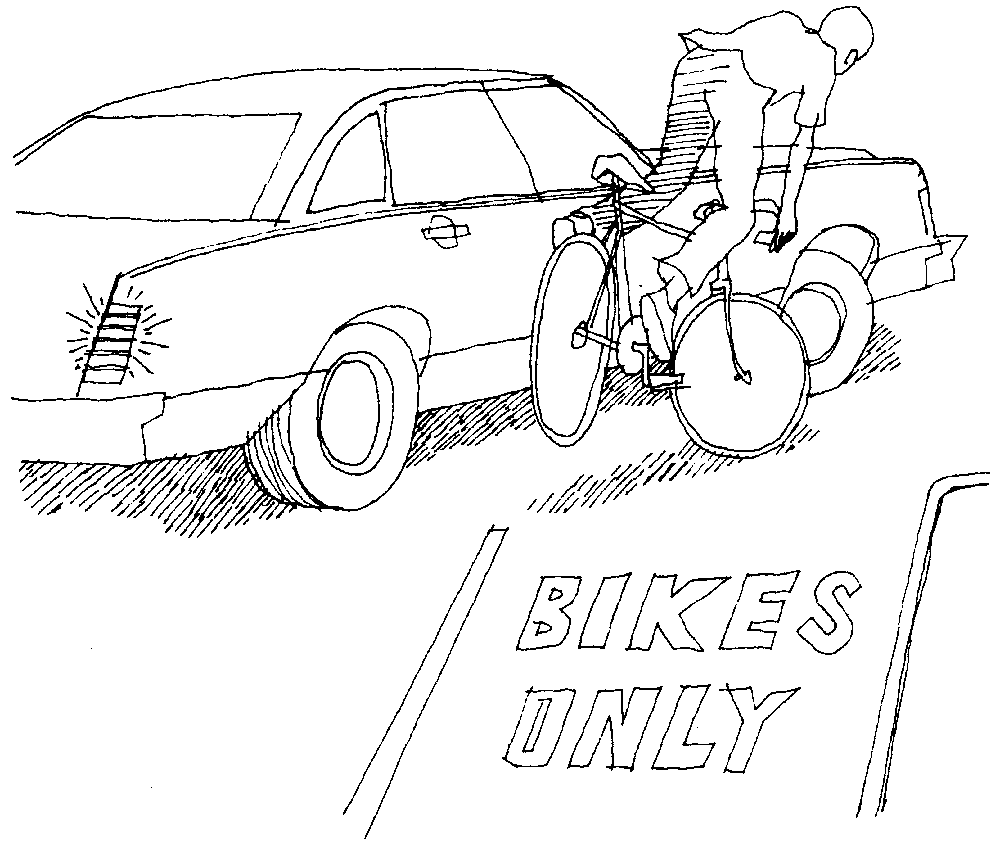
Figure 28.4
Collision caused by improper motorist right turn (cause of 5 percent of car-bike collisions)
The classes of car-bike collision typical of each age group are shown in table 28.5.
Table 28.5
Typical car-bike collisions by age
Median age |
Major causes of car-bike collision |
Under 12 |
Entering the roadway, swerving about |
12–14 |
Right-of-way errors, wrong-way riding |
Over 14 |
Signal changes; motorist drive-out; motorist turns; motorist overtaking |
Young children and teenagers largely cause their own car-bike collisions, whereas the car-bike collisions typical of adult cyclists are caused by motorist error rather than by cyclist error. The statistics on all car-bike collisions are heavily influenced by the enormous proportion that occur to children between 12 and 15 years of age, the age group in which American cycling is most concentrated and the cycling age group first exposed to heavy traffic. About a third of car-bike collisions occur to cyclists under 12 years of age, another third in the years from 12 to 15, and the last third to cyclists over 16 years of age. Urban and rural car-bike collision patterns also differ: 89 percent of car-bike collisions occur on urban roads, and only 11 percent on rural roads. In cities, there are more crossing and turning collisions, 89 percent of the urban total. In the country this proportion falls to 60 percent. In cities, car-overtaking-bike collisions are relatively insignificant at 7 percent, whereas in the country they are 30 percent. Because many car-overtaking-bike collisions are caused by motorists and are more typical of country areas, you might think that the proportion of motorist-caused car-bike collisions would be higher in the country than in the city, but this is not so. The proportion of cyclist-caused car-bike collisions is higher in the country than in the city: 67 percent versus 52 percent.
Therefore, there is no reasonable way to rank car-bike collision types in order of importance, because the order depends upon what kind of cyclist you are and where you are riding, as table 28.6 shows.
Table 28.6
Rank-ordering of car-bike collision frequency rates by age of cyclist and location of accident (most frequent at top of each list)
Child, Urban |
|
1 |
Cyclist running stop sign |
2 |
Cyclist exiting residential driveway |
3 |
Cyclist riding on sidewalk, turning to exit driveway |
4 |
Cyclist riding on sidewalk, hit by motorist exiting commercial driveway |
5 |
Cyclist swerving left from curb lane |
6 |
Wrong-way cyclist swerving left |
7 |
Cyclist riding in sidewalk/crosswalk hit by motorist turning left |
Child, Rural |
|
1 |
Cyclist exiting residential driveway |
2 |
Cyclist swerving about on road |
3 |
Cyclist swerving left |
4 |
Cyclist entering road from sidewalk or shoulder |
5 |
Cyclist running stop sign |
Teen, Urban |
|
1 |
Wrong-way cyclist hit by motorist restarting from stop sign |
2 |
Cyclist turning left from curb lane |
3 |
Cyclist exiting commercial driveway |
4 |
Wrong-way cyclist running stop sign |
5 |
Wrong-way cyclist hit head-on |
6 |
Right-of-way error at uncontrolled intersection |
7 |
Motorist entering commercial driveway |
8 |
Cyclist running red light |
9 |
Cyclist turning left from curb lane, hitting car coming from opposite direction |
10 |
Wrong-way cyclist hit by motorist turning right on red |
Teen, Rural |
|
1 |
Cyclist turns left from curb lane |
2 |
Wrong-way cyclist head-on |
3 |
Wrong-way cyclist hit by motorist restarting from stop sign |
4 |
Cyclist turning left from curb lane, hitting car from opposite direction |
5 |
Right-of-way error at uncontrolled intersection |
Adult, Urban |
|
1 |
Motorist turning left |
2 |
Signal light change |
3 |
Motorist turning right |
4 |
Motorist restarting from stop sign |
5 |
Motorist exiting commercial driveway |
6 |
Motorist overtaking unseen cyclist (mostly in darkness) |
7 |
Motorist overtaking too closely |
8 |
Cyclist hitting slower-moving car |
Adult, Rural |
|
1 |
Motorist overtaking unseen cyclist (mostly in darkness) |
2 |
Motorist overtaking too closely |
3 |
Motorist turning left |
4 |
Motorist restarting from stop sign |
5 |
Cyclist swerving around obstruction |
6 |
Cyclist turning left, hitting car coming from opposite direction |
In considering these lists of car-bike collision types, you must remember that classifying a type as typical of children does not mean that no teenagers or adults incur this type of collision, but that it is much more prominent among children than among older cyclists. By and large, the age distribution of car-bike collision types shows that young cyclists start riding on residential streets, where traffic hazards are simple, and after a few years widen their scope to commercial streets with more difficult traffic hazards. After they become exposed to a traffic hazard and experience near-collisions caused by that hazard, they start to learn how to avoid that kind of collision. Naturally, they first learn the avoidance techniques that are easiest to understand and to practice, so the proportion of collisions caused by cyclists exiting driveways drops at an early age. Collision-avoidance techniques that are more difficult to learn, like how to avoid a car coming from the opposite direction that turns left in front of the cyclist, are not learned until later in life, if at all.
How fast the cyclist learns depends upon how much the cyclist rides under conditions that require learning, upon how much help is received, and of course upon intelligence. Two comparisons illustrate this, the first comparing incentive to learn versus learning speed, and the second comparing assistance given to learning speed. Cyclists at universities situated in small towns with little traffic but extensive bikeway systems, both of which are supposed to help cyclists, persist in their childish and dangerous cycling habits, such as turning left from the curb lane without first looking behind. Cyclists at universities situated in big cities with average or heavy traffic and no bikeways quickly learn to ride in the safe adult manner. The lone cyclist who has no assistance in learning requires many miles and years to learn from experience. The club cyclist who rides with experienced cyclists learns much faster. The cyclist who studies this book learns still faster, and the cyclist who is taught in an Effective Cycling class learns most quickly, as table 28.7 shows.
Table 28.7
Distance and time required to learn traffic-safe cycling
Type of learning |
Miles |
Years |
Self-teaching |
50,000 |
10–20 |
Club cycling |
5,000 |
2 |
Learning from books |
2,500 |
1 |
Effective Cycling instruction |
800 |
1/4 |
This learning acceleration occurs in all phases of cycling, not just in traffic safety, although this is in many ways the most difficult part to learn. The function of this book and of the Effective Cycling Program that I created for the former League of American Wheelmen is to accelerate learning so that even newcomers to cycling can cycle as safely and as enjoyably as experts in a short period of time.
Car-Overtaking-Bike Collisions
New cyclists fear that they will be hit from behind by fast motorists, almost to the exclusion of any other fear of motor traffic.
This fear is created by parents, teachers, police officers, bike-safety programs, motor-vehicle driver education, and other social forces. However, this fear is entirely unwarranted, because about 90 percent of car-bike collisions are caused by conditions or actions in front of the cyclist, where they can be seen and therefore can be avoided by proper avoidance action. Of the 10 percent of car-bike collisions that are caused by conditions behind the cyclist, 6 percent are caused by the cyclist swerving in front of the car, and only 4 percent by the overtaking motorist. Of this 4 percent, half are caused by motorists who do not see the cyclist (generally in the dark), and often by motorists who have been drinking, some by motorists who misjudge the width of their vehicles, and very few by motorists who are out of control.
These dangers are real and should not be ignored, but they must be considered in the whole context of cycling accidents. The motorist-caused car-overtaking-bike collision constitutes about 0.3 percent of cycling accidents. The largest single cause is bad cyclist visibility from the rear in darkness, which can obviously be counteracted by brighter rear reflectors or rear lights. Bikeways might prevent some part of the less than 0.3 percent of cyclist casualties caused by motorists who overtake cyclists in daylight. However, bikeways cause more accidents than this small number that they might prevent.
Cyclists could, for instance, follow one prominent bike-safety recommendation by restricting themselves to riding only on paths where cars are prohibited. But if they do so, their accident rate will increase by a factor of at least 2.6, because paths are more dangerous than roads. Some of this increase will be in the form of car-bike collisions, because it is practically impossible to make intersections between paths and roads as safe as normal road intersections. The maximum safe speed through path-road intersections is more nearly walking speed than cycling speed.
If, to avoid the dangers of bike paths, cyclists decide to follow the other prominent bike-safety recommendation and always ride as near to the right edge of the roadway as possible, they will then find that the already substantial hazards of motor vehicles coming from each side, from ahead and turning left, and from behind and turning right are substantially increased.
In short, it has been proved safest to ride when taking only two actions to prevent being hit from behind: never move sideways on the road without first looking behind to be certain that there is no overtaking traffic (motorists or cyclists) on that side, and always have a powerful rear reflector (with perhaps a rear lamp also) when riding at night
Motorists and police often argue that cyclists, for their own safety, must ride sufficiently far right, at least where safe to do so, to facilitate safe and easy overtaking by faster traffic. Being polite is nice, but there are no accident data to support this argument, and, most important, the proportion of locations where precise cyclist lateral placement actually enables safe, lawful, overtaking is much smaller than motorists believe. (See the discussion in chapter 29.)
Car-Bike Accidents without Collisions
These are the cases in which the cyclist goes off the road, runs into something, or takes a spill trying to avoid a motorist who has made an error. Nearly always the motorist leaves the scene without stopping, presumably because he or she doesn’t know an accident has been caused. The classic example is the motorist cutting to the right—again, too soon after overtaking a cyclist. The cyclist sees the motorist moving over and steers off the road or into the curb, while the motorist obliviously goes on. Cyclists also steer off the road to avoid right-turning motorists and motorists from the opposite direction who are overtaking other motorists. The wind-blast accident, where the cyclist gets blown off the road by the wind from a passing truck, should also be classified in this group. I estimate that a lot of these accidents can be either prevented or avoided by the cyclist. Riding the proper line on the roadway both reduces right-turning errors by motorists and gives the cyclist more room for escape. And better learning of the panic stop and the instant right turn gives the cyclist better maneuvering skills. With these skills, when a gust from a truck hits a cyclist, he is far less likely to swerve, either into a curb or into the truck. In fact, truck-caused wind gusts are only a small problem for cyclists who have learned how to handle their bikes.
Bike-Bike Collisions
Bike-bike collisions have not been the subject of any formal report—the only persons who express any concern about them are cyclists, and the rest of society apparently couldn’t care less. From experience and interviews, I conclude that the frequency order of bike-bike collisions is the same as the frequency order of cyclist-caused car-bike collisions. That is, a cyclist who conflicts with traffic can hit a cyclist as easily as a car.
There is one exception. Wrong-way cyclists are far more likely to collide with other cyclists than with motorists. The wrong-way cyclist not only intersects the proper cyclist’s path from the unexpected direction, but he comes head-on into the proper cyclist’s space. Wrong-way cyclists do not get into head-on collisions with motorists to any great extent because they operate largely in adjacent spaces. They cause head-on collisions with cyclists because they operate in the same space.
However, bike-bike collisions affect competent cyclists far more than car-bike collisions do. When an incompetent cyclist hits a car, the cyclist rarely does more than hurt the motorist’s feelings. But if an incompetent rider hits a cyclist, that cyclist may be seriously injured or killed. Three of my friends have been permanently disabled, and one killed, by bike-bike collisions. One was hit by a wrong-way cyclist and two by cyclists turning left from the curb lane.
Club cyclists are subject to another type of bike-bike collision: the following-too-closely collision. Because following another cyclist closely when at road speed reduces the power required by 15 percent, cyclists in groups, and particularly when traveling against the wind, ride very close together. The collision that results is not a stopping-type collision but a diverting type. No cyclist can ride in an exact straight line because the bicycle has to steer from side to side to maintain balance. The relative sideways motion between two expert cyclists riding together is about 2 inches of random motion. If the front wheel of the cyclist behind overlaps the rear wheel of the cyclist ahead, this relative sideways motion may cause the wheels to touch. Nothing happens to the front cyclist, but the front wheel of the rear cyclist is steered to one side as the cyclist leans to the other side. This is the opposite of the correct relationship between lean and turn, and the rear cyclist suffers a diversion-type fall. Notice that unlike the case of the motor vehicle following too closely, only the following cyclist suffers injury. The advantages of group cycling and the infrequency of collisions among expert cyclists ensure that cyclists who trust each other and are traveling together will continue to ride in closely spaced groups.
Less is known about bike-bike collisions on bike paths, but they are certainly one of the types of cyclist accident that make bike paths so dangerous (as shown by the Kaplan study), and they are one reason why many expert cyclists refuse to ride on bike paths. As shown by the Cross study, most car-bike collisions are caused by cyclists disobeying the rules of the road. The behavior of cyclists on bike paths, in general, is even less disciplined than on the road, presumably on the assumption that bike-bike collisions do not matter. This assumption is one more dangerous result of overestimating the dangers of motor traffic because of unwarranted fear. Competent cyclists who are safe in motor traffic because they obey the rules of the road find that their skills are useless on bike paths, where cyclists act in any way they please, subjecting competent cyclists to purely random hazards of collision.
Bicycle-Pedestrian Collisions
Bicycle-pedestrian collisions are relatively infrequent. The pedestrian crossing the street is far less likely to be hit by a passing cyclist than by a passing car because the bicycle is smaller and generally slower than a car. However, bike-pedestrian collisions are politically important because they are very frequent wherever cyclists and pedestrians share the same facility, such as on bike paths. Real bike paths are very rare and exist only where pedestrians don’t want to go. Bike paths that go where pedestrians want to go, and that is where most bike paths are constructed, have a high frequency of bike-pedestrian collisions.
There are few real data about bike-pedestrian collisions, for several reasons. Our governments aren’t sufficiently concerned about them to study them, and actually may desire to hide them. Cross was initially commissioned to study car-bike collisions, which constitute only about 12 percent of accidents to cyclists, because the highway establishment thought that such a study would document their superstition that cyclists should be off the roads. Cross’s second study, the national one, was commissioned in better faith, but only because car-bike collisions are the only cycling accidents that both government and the public are interested in. On the other hand, only cyclists are interested in the rate of bike-pedestrian collisions where they occur, on bike paths, because they are interested in protecting themselves from bike paths. Those who advocate bike paths, and they are many in both public and government, don’t want a study of accidents on bike paths because that will demonstrate that bike paths are unsuitable cycling facilities.
Despite the paucity of data about bike-pedestrian collisions, the researchers who have studied college campus cycling and the campus planners who have tried to ameliorate its problems agree that wherever cyclists and pedestrians use the same facilities, there is a substantial problem of bike-pedestrian collisions. Many campuses have decided that there is no solution to the problem and have required cyclists to walk their bikes through the busiest areas. Ken Cross considered bike-pedestrian as one category of the “non-motor-vehicle” cycling accidents that he studied in Santa Barbara County, in which the Santa Barbara campus of the University of California, with a large cycling population and a well-designed bike path system, is located. Over the entire county, bike-pedestrian collisions were 5 percent of accidents. However, the accident rate climbed dramatically when bike-path cycling was studied. When cyclists using the paths were interviewed, 3.8 percent said that they had recently been involved in a collision with a pedestrian, and the most frequent type was caused by the pedestrian swerving sideways as the cyclist overtook him.
It is easy to see why there are so many bike-pedestrian collisions on bike paths and on campuses: pedestrians operate without rules. They can move in any direction and change direction without notice. Even when the cyclist attempts to follow the rules of the road on the facility (and many facilities are designed without clues about how to do this), he is stymied by the undisciplined hither-and-yon movement of pedestrians. Mixing cyclists and pedestrians is about the most dangerous thing that traffic engineers can do. When among the disciplined motor-vehicle traffic on roads, cyclists are typically safe at speeds of 25 mph, or even more on descents, but trying to operate among pedestrians is so dangerous that the safe speed is about 5 mph. No other facility is so dangerous that it requires so great a reduction of speed.
Bike-Dog Collisions
The serious bike-dog collision occurs as the dog chases the cyclist on an intercepting course and gets under the cyclist’s front wheel. The cyclist suffers either a stopping or a diversion fall. The LAW survey shows that collisions with dogs are as likely to produce serious injury to the cyclist as are collisions with motor vehicles. Several of my friends have been severely injured, and one killed, by running over dogs that were chasing them.
Parked-Car Collisions
Parked-car collisions are of two types. In the first type, the motorist opens the car door in the cyclist’s path. Cross did not study this type, but some surveys show it to account for as much as 8 percent of total car-bike collisions, In the second type, the cyclist, not paying attention for one reason or another, runs into a parked car. In both cases, both the impact with the car and then the fall to the roadway cause injuries.
What Happens in an Accident
Accidents may be roughly classified as hitting and falling or slipping and falling. Whatever happens to you on a bike, you fall.
When you run into something—a dog, a rut, a parked car, or a moving truck—your bike stops but you keep right on, going headfirst into whatever you have hit. As your bike stops suddenly, you leave the saddle. Your hands are jerked from the handlebars and your shoes from out of the clips—even with cleats. Your crotch passes through the air just above the top tube and handlebar stem—don’t use top-tube or handlebar-stem shift levers. If you have hit a high obstruction, you will then hit it head on. You then fall in a tangle onto your bike. If you have hit a small object, like a dog, you fly until you hit the ground—hands and arms first, head first, or in a body slide.
In a prospective collision with a car, stay upright as long as possible. This keeps you away from the car’s wheels as long as possible, and it keeps your body compactly positioned and above many of the sharp points on the car. This reduces the chances of major internal injury—legs heal faster than insides. If you have had acrobatic training, tuck and roll—it is apparently better than going spread out.
In falls (most of which are slips, but some of which are sideways knockdowns by cars), the cyclist hits the ground sideways and slides along. A lot of skin on thighs, hips, hands, and upper arm is lost, but usually without serious injury. The slang name is “road rash.” The serious injuries that do result are fractures—skull, collarbone, hip, or forearm, depending upon what takes the blow. Even low-speed falls can break bones.
All told, three-quarters of the cyclists who are killed die of brain injuries, and probably three-quarters of the permanent disabilities are from brain injuries. Wearing a good helmet is the best way of increasing your chances of surviving an accident without permanent disability. The remainder of serious injuries are internal, the results of impact with a car or of falling on top of some structural part of the bike, like the handlebars or a pedal, after the bike has hit the ground. There is not much that can be done to reduce the severity of those injuries. The first protective action is preventive: ride so you don’t get into accident situations. The second is avoidance: get away from the incipient accident by proper bike-handling technique. The third protection is minimizing the effects of the accident you cannot avoid, and a helmet provides the most useful protection.
How a Helmet Works
A proper helmet is lined with rigid crushable foam or some other constant-load shock absorber. When it hits the pavement, the helmet’s shell stops quickly, but because of the crushable foam, the head inside has more time to stop. This design prevents both a point overload that indents the skull and a too-rapid stop that bangs the brain against the inside of the skull. Once the helmet has been used in this way to save your life, the foam lining is crushed and must be replaced before the helmet can again protect you. Do not use reusable liners made of resilient foam because these subject the head to greater decelerations than single-use crushable liners.
Summary
Today we have ample information to create a complete program to reduce cycling accidents. We know the basic accident rates of various types of cyclist, we know how each rate is divided into major types of accidents, and we have this information for many subtypes as well. In particular, we have very substantial data on car-bike collisions. Although these are not the major type of cycling accident, they create the greatest public clamor. We cyclists have good strategies and techniques for avoiding a very great proportion of cycling accidents. Furthermore, to our great good fortune, these strategies and techniques generally make cycling more useful and more pleasurable.
The success of these accident-reduction techniques is shown by the 80 percent accident reduction per bike-mile achieved by members of LAW relative to other adult American cyclists, and by the similar reduction achieved by members of the British Cyclists’ Touring Club. The outstanding bicycle safety task in America is to spread this knowledge and these techniques among the general cycling public so that they may benefit from the most substantial accident-rate reduction available in any transportation activity. One function of this book is to accomplish this task.
The accident statistics also are very important in evaluating bike-safety and bikeway programs. Bike-safety programs urge cyclists to stay out of the way of motorists by riding close to the edge of the road and stopping at stop signs. The accident statistics show that these are only minor problems; bike-safety programs have targeted these types of accidents because they are the ones that worry motorists and highway authorities rather than because of their importance in reducing casualties to cyclists. Bikeway programs are even more useless. They are aimed at only the 0.3 percent of accidents to cyclists caused by urban motorists hitting lawful cyclists from the rear during daylight. It is appalling that our nation’s cycling policy should be driven by this pitifully small fraction of the accidents that might be prevented. The statistics prove that bikeway programs are not safety programs, despite the advocates’ safety propaganda.
As you will read in later chapters, motorists first invented the policy that cyclists—because they were not capable of obeying the rules of the road—for their own safety had to be kept at the edge of the roadway, where it was safe. Then motorists invented bikeways as the physical embodiment of these two false principles, cyclist incompetence and road-edge safety. Motorists succeeded because they had created in the public mind the fear that same-direction motor traffic was by far the greatest danger to cyclists, so great that it had to control everything done about bicycle traffic. As the first statistics proved, this was false, but knowledge of that falsity didn’t change the motorists’ program. Then the environmentalists jumped on the bikeway bandwagon, because they believed that bikeways, because they countered the fear of same-direction motor traffic, would persuade many motorists to switch to bicycle transportation instead. Now the government has wrapped this motorist-cum-environmentalist anticyclist program in the banner of patriotism.
That is why the facts and skills that you learn through this book will be very important to you, even if they challenge what you thought you knew.