Chapter 25
Trends and Patterns
“LATER” AND “LAST” PASSAGES: THE QUESTIONS HOLD THE ANSWERS
In this chapter, we will look at some more difficult Science passages and some of the ways that the answer choices can teach us what we need to know about challenging passages. Our Basic Approach remains the same:
1. Work the Figures
Look for variables and trends.
2. Work the Questions
Work from easy to hard, from short to long.
3. Work the Answers
Use POE.
Believe it or not, as the passages become more complex, it is equally important to remember: Don’t try to understand the science. In this chapter, we will particularly focus on effective ways to use POE and to let the questions teach us about the passage.
Passage VII
Engineers studied the trajectories of a cannonball launched from a cannon under various conditions.
Study 1
On a level surface during a mild day, engineers launched a cannonball from a cannon as shown in Figure 1.
A camera was fixed atop the cannon so that it would point in the direction of the cannonball’s launch. A receiver was also fixed to the cannon to record the cannonball’s position as recorded by the camera.
As the cannonball traveled through the air, angle θ, which is defined in Figure 1, consistently changed. The change in θ was captured by the camera every 0.25 seconds after launch until the cannonball landed. For each recorded image, θ was measured (Figure 2).
Furthermore, every 0.25 sec after launch, the receiver sent out a radar pulse, part of which was reflected by the cannonball to the receiver. The roundtrip travel time of each pulse was recorded to determine the distance, d, between the receiver and the ball at any given time (see Figure 3).
Using d and θ, the engineers determined the ball’s height, h, and distance, r, at the end of each 0.25 sec interval. A curve plotting h vs. r was constructed.
This procedure was followed using cannonball launch starting speeds of 135 ft/sec, 150 ft/sec, and 180 ft/sec. For each launch speed, the ball was launched at θ = 30°. The curves representing h and r for each of the launch speeds were connected by lines for time, t = 2 sec, 3 sec, 4 sec, and 5 sec after launch (see Figure 4).
Study 2
Using an algorithm, the engineers calculated h and r at 0.25 sec intervals for the same cannonball launched in a vacuum in otherwise similar conditions to those in Study 1. The results are plotted in Figure 5.
There is a lot of content in this passage, which already makes it a bit more difficult than the others we have seen. But let’s use our Basic Approach to see if we can simplify it as much as we did the others.
• As r increases, h increases then decreases.
• As r increases, t increases.
• As r increases, the (ft/sec) values increase.
Figure 5
35. Suppose the cannonball were launched at 30° in a vacuum from a height of 5 ft. Based on Figure 5, the cannonball would land approximately how many feet farther from the cannon if it were launched at 150 ft/sec than if it were launched at 135 ft/sec?
A. 50 ft
B. 150 ft
C. 500 ft
D. 650 ft
36. While the cannonball was in flight, how often did the camera record the position of the ball?
F. Once per second
G. Twice per second
H. Three times per second
J. Four times per second
37. The cannon was an instrumental weapon used during the Ottoman invasion of the city of Constantinople in 1453. Assume that cannonballs identical to those used in Study 1 were launched on a windless day with a starting height of 5 ft above the ground and an angle of θ = 30°. If the launch speed of each cannonball were 180 ft/sec, how close would the cannon have needed to be to the 40-ft-tall wall surrounding Constantinople in order to travel over it?
A. 425 ft
B. 575 ft
C. 700 ft
D. 850 ft
38. Based on Figure 4, as the initial speed of the launched cannonball was increased, how did the values of h and r change at t = 4 sec?
h r
F. decreased decreased
G. decreased increased
H. increased decreased
J. increased increased
39. Based on Figure 5, if the ball were launched in a vacuum from a height of 5 ft at 135 ft/sec and θ = 30°, how long would the cannonball most likely be in flight from launch to landing?
A. Between 4 sec and 5 sec
B. Between 5 sec and 6 sec
C. Between 6 sec and 7 sec
D. Between 7 sec and 8 sec
40. Based on Figure 3, if c represents the speed of light, which of the following represents the time taken by each radar pulse to make the roundtrip between the receiver and the ball?
F. 2c/d
G. 2d/c
H. c/r
J. r/c
As in the previous chapter, a large part of Working the Questions consists of answering the questions in a good order. Look for numbers, number words, and relationships.
Question 38 seems like a good place to start because the question is relatively short, and the answers are entirely composed of number words.
38. Based on Figure 4, as the initial speed of the launched cannonball was increased, how did the values of h and r change at t = 4 sec?
h r
F. decreased decreased
G. decreased increased
H. increased decreased
J. increased increased
Here’s How to Crack It
Recall the initial relationships we determined. There was one, in ft/sec, that we didn’t have a name for. This question has given it to us: “initial speed.”
35. Suppose the cannonball were launched at 30° in a vacuum from a height of 5 ft. Based on Figure 5, the cannonball would land approximately how many feet farther from the cannon if it were launched at 150 ft/sec than if it were launched at 135 ft/sec?
A. 50 ft
B. 150 ft
C. 500 ft
D. 650 ft
Here’s How to Crack It
Start with the information you know. Figure 5 shows 135 ft/sec and 150 ft/sec, and we can see the arcs that each of those initial speeds create. The 150 ft/sec seems to go a bit farther along both axes, but we need to figure out which one we’re dealing with.
36. While the cannonball was in flight, how often did the camera record the position of the ball?
F. Once per second
G. Twice per second
H. Three times per second
J. Four times per second
Here’s How to Crack It
The only t values we have seen are in increments of one second, but the curves seem to be more precise than that. Let’s use the introduction but read it selectively. We’re looking for the lead words “camera,” “record,” “position,” or anything relating to time.
37. The cannon was an instrumental weapon used during the Ottoman invasion of the city of Constantinople in 1453. Assume that cannonballs were launched on a windless day with a starting height of 5 ft above the ground and an angle of θ = 30°. If the launched speed of each cannonball were 180 ft/sec, how close would the cannon have needed to be to the 40-ft-tall wall surrounding Constantinople in order to travel over it?
A. 425 ft
B. 575 ft
C. 700 ft
D. 850 ft
Here’s How to Crack It
As riveting as all the military history in this question is, let’s ignore it and go straight to the data. We’ve got a few data points: a starting height of 5 ft, an angle of θ = 30°, an initial speed of 180 ft/sec, and a 40-ft-tall wall, or a value of h = 40 ft.
39. Based on Figure 5, if the ball were launched in a vacuum from a height of 5 ft at 135 ft/sec and θ = 30°, how long would the cannonball most likely be in flight from launch to landing?
A. Between 4 sec and 5 sec
B. Between 5 sec and 6 sec
C. Between 6 sec and 7 sec
D. Between 7 sec and 8 sec
Here’s How to Crack It
We’ve already seen that we can ignore the 5 ft and θ = 30° values, and we know that vacuum refers to Figure 5 (note that the question tells us this as well). Let’s go to the curve for 135 ft/sec.
40. Based on Figure 3, if c represents the speed of light, which of the following represents the time taken by each radar pulse to make the roundtrip between the receiver and the ball?
F. 2c/d
G. 2d/c
H. c/r
J. r/c
Here’s How to Crack It
This question asks us to draw upon some very basic outside knowledge: distance = rate × time. The question is asking about time, and it tells us that the “rate” will be represented as c. In other words, d = ct. Rearrange this equation to solve for time, t = d/c. We know that c has to be in the denominator, which eliminates choices (F) and (H). Finally, the question asks about a “roundtrip,” which means whichever distance we are dealing with will need to be doubled, so only choice (G), which contains a 2, can be the correct answer.
Passage VI
The term “evolution” is often used in the context of biological changes in organism populations over time, but it can also be applied to the change in the chemical composition of the Earth’s atmosphere. The hypotheses of two studies claim that this chemical evolution has altered the types of chemicals found in the atmosphere between the early stages of Earth’s existence and the present day.
Study 1
Based on the hypothesis that volcanic eruptions were the source of gases in the early Earth’s atmosphere, scientists recreated four model volcanic eruptions in closed chambers, each containing different percentages of the same volcanic particulate matter. They then observed the gases in the air above this model over time. The percent composition of this air after 1 day, when the air achieved a steady state of constant gas concentrations, is represented in Table 1.
Since the experiment provided only a suggestion of the gas levels in the early Earth’s atmosphere, the scientists then analyzed the amount of trapped gases in sediment layers, which indicate the changing atmospheric levels of gases over billions of years. The data collected on O2 and H2O vapor are presented in Figure 1.
Study 2
A separate study used the same volcanic models as in Study 1, but hypothesized that the scientists in Study 1 underestimated the amount of H2 in the early Earth atmosphere. They proposed a different composition of gases, highlighting an increased H2 level in the atmosphere, also represented in Table 1. Based on these new data, the scientists proposed an alternative graph for the changing atmospheric levels of O2 and H2O vapor, also shown in Figure 1.
29. According to the results of Study 2, between 4 and 3 billion years before the present day, the percent composition of O2 in the atmosphere:
A. increased only.
B. increased, then decreased.
C. decreased only.
D. decreased, then increased.
Here’s How to Crack It
This question is about as easy as they come. Let’s go back to Figure 1 and look between 4 and 3 billion years before the present day. The question asks about O2 level, which increases during this period. The best answer in choice (A).
30. According to the results of Study 1, the percent composition of H2O vapor in the atmosphere decreased most rapidly over what period of time?
F. Between 2.5 and 2 billion years ago
G. Between 2 and 1.5 billion years ago
H. Between 1.5 and 1 billion years ago
J. Between 1 and 0.5 billion years ago
Here’s How to Crack It
Again, let’s use Figure 1, though this time we will look at H2O rather than O2. Because it’s hard to know exactly which range showed the most rapid decrease, let’s use the answer choices and POE.
31. Suppose that the actual early Earth atmosphere had a high H2 composition of 42%. Based on Study 2, is it likely that the corresponding H2S and N2 compositions of this atmosphere were each 3%?
3% H2S 3% N2
A. Yes Yes
B. Yes No
C. No Yes
D. No No
Here’s How to Crack It
This question asks us to determine a relationship where we could not find one before. Let’s look back at the chart now that we know what we’re looking for: an H2 composition of 42%.
32. Suppose that in a new trial in Study 2, the percent composition of H2 in the atmosphere was set at 33% and the percent composition of N2 was found to be 2%. The percent composition of H2O vapor in this trial would most likely be:
F. greater than 40%.
G. greater than 35% and less than 40%.
H. exactly 35%.
J. greater than 30% and less than 35%.
Here’s How to Crack It
We saw in the last question that there are more relationships in Table 1 than initially meets the eye. H2, for example, decreases, making predictions about H2 levels possible.
33. Consider an early Earth environment that featured microorganisms. Based on the results of Study 2, is it more likely that aerobic organisms (those that require O2 to survive) or anaerobic organisms (those that do not require O2 to survive) would have existed on Earth 4 billion years ago?
A. Aerobic organisms, because of the high H2O level 4 billion years ago
B. Aerobic organisms, because of the low O2 level 4 billion years ago
C. Anaerobic organisms, because of the high H2O level 4 billion years ago
D. Anaerobic organisms, because of the low O2 level 4 billion years ago
Here’s How to Crack It
Right off the bat, we can eliminate choices (A) and (C), which address the H2O levels in a question that is exclusively concerned with O2 levels. Then, because all that remains are options that refer to “the low O2 level 4 billion years ago,” the organisms must be anaerobic, given that anaerobic organisms “do not require O2 to survive.” Only choice (D) can work, and we didn’t need the figures at all! All you need is POE.
34. According to Study 2, how long did it take the H2O vapor level to decrease to 75% of its composition 4 billion years before the present day?
F. 500 million years
G. 1 billion years
H. 1.5 billion years
J. 2 billion years
Here’s How to Crack It
We’re back to the graph. Don’t overthink this one! In Study 2, 4 billion years ago, the H2O vapor level was 40%. 75% of that would be an H2O vapor level of 30%. In Study 2, the H2O vapor level is 30% approximately 2.5 billion years ago. From 4 billion to 2.5 billion is 1.5 billion, or choice (H).
CONFUSING FIGURES AND THE QUESTIONS WHO LOVE THEM
In this exercise, you will be given a confusing figure and a question associated with it. Note how the question tells you what you need to know about the figure. Answers and explanations will be at the end of the exercise.
2. Considering only the gases listed in Table 1, which gas is more abundant in the atmosphere of Jupiter than in the atmosphere of either Neptune or Saturn?
F. H
G. CH3
H. NH3
J. He
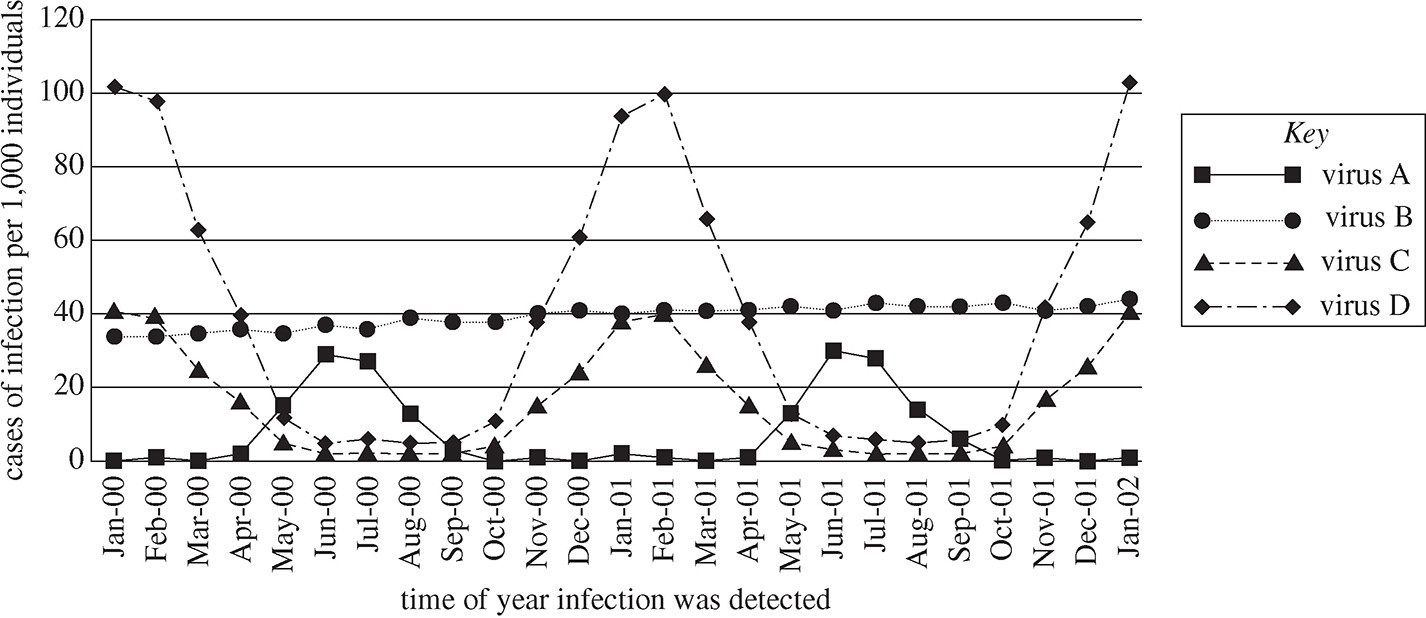
3. According to Figure 1, the incidence of at least 3 of the viruses is most alike during which of the following months?
A. April 2000
B. September 2000
C. November 2001
D. January 2002
4. Based on the information in Figure 2, a ball being dropped from 1 meter height with an elasticity of 0.2 Pa and a weight of 0.5 kg would have a maximum post-impact velocity of:
F. less than 0.50 m/s.
G. 0.75 m/s.
H. 1.0 m/s.
J. greater than 1.25 m/s.
5. Figure 1 shows that a lunar orbiter at point P would be able to view which of the following?
A. The moon only
B. The Sun only
C. The moon and the Earth only
D. The moon, the Sun, and the Earth
CONFUSING FIGURES DRILL ANSWERS AND EXPLANATIONS
1. D There are no obvious trends in the table other than the fact that “Age of shells” decreases from the top of the table to the bottom. This allows us to situate 86,000 years between two values on the table: 87,0000 and 85,000. Because the new value is between the two known values, we can assume that the other values will be as well. Choice (D) gives three values that fit between the others in the table.
2. H While we may not know what any of the terms mean or how they relate to the three planets listed, we can pull this information directly from the chart. The answer must be choice (F), because NH3 has a relative abundance of 0.0045% on Jupiter but of 0% on Neptune and 0.0035% on Saturn. POE got us there!
3. B Find three overlapping dots. Choices (A), (B), and (D) all refer to months in which the dots are fairly spread out. Only choice (B) gives a month, September 2000, in which three of the dots are very close to one another.
4. F Work with the specific information given in the question. 0.2 Pa leads to the third graph in Figure 2, and the weight of 0.5 kg will lead to the second hump within that graph, which shows 3 kg, 2 kg, and 1 kg. Because those three curves seem to go in increasing order, we can infer that 0.5 kg will be somewhere below 1 kg. 1 kg maxes out at a velocity of 0.50 m/s, so a weight of 0.5 kg will max out at a velocity less than that, as choice (F) indicates.
5. C Find Point P on the figure (which, by the way, looks like a big eyeball). Point P, it seems, is between the eyeball (the moon) and the Earth, so someone standing at Point P would be able to see both. This eliminates choices (A) and (B), which don’t contain both elements. As for the Sun, it looks like the eyeball is blocking Point P from a good view of it, so choice (D) can be eliminated as well. Choice (C) contains the correct elements.