![]()
FOR MANY PEOPLE, knowing what the weather is going to do affects them no more than choosing whether to take an umbrella to work, or to have that picnic or barbecue at the weekend. But for others – farmers, pilots, sailors – accurate forecasts are essential.
The ‘butterfly effect’ – a metaphor used to explain one aspect of chaos theory – neatly demonstrates just how tricky a meteorologist’s job is. According to the butterfly effect, something as delicate and apparently inconsequential as the flapping of a butterfly’s wings in one part of the world can set off a chain reaction that changes weather conditions far away in another continent. In other words, the whole swirling atmospheric mass is so sensitive to infinitesimal changes within it that everything affects everything else.
Pity the poor old meteorologist, but this does explain why weather forecasting is not an exact science. Air temperature, air pressure, atmospheric humidity, rainfall and wind all interact with each other to determine what the weather will be. Using all the armoury of measuring, recording and analytical devices at their command, meteorologists can give fairly accurate forecasts for five or six days ahead. For longer periods, the best we can currently hope for is general trends.
INNOVATOR
British scientist Robert Hooke (1635–1703) was ahead of his time. As well as inventing and improving on various weather-recording instruments, including rain gauges, the wheel barometer and devices for measuring humidity and wind speed, he also became convinced that such phenomena as fog, storms and hurricanes were caused by changes in air pressure – and thus laid some of the groundwork for modern meteorology.
The way in which meteorologists handle data they receive can be simple – or highly sophisticated:
• The most straightforward approach is the (rather obvious) ‘persistence’ method. This is based on the idea that the weather today will be much the same as the weather yesterday. This may sound simplistic but, in regions with fairly consistent weather patterns, it’s a fairly reliable method – and thus perhaps hardly counts as ‘forecasting’ at all. In countries where the weather changes from day to day, or even hour to hour, it would not be effective.
• Getting a bit more analytical, the ‘trends’ method involves observing and recording particular weather features, and doing numerous mathematical calculations based on the data collected to predict how the weather will change over a period of time. For example, if a warm front is travelling at a consistent speed, meteorologists can predict where that warm front will be in a given period of time. This focused method works well for short-term forecasting.
• The most sophisticated option is computer analysis, involving highly specialized supercomputers – some of which can get through 1.3 trillion calculations per second (and a few even faster). Vast amounts of meteorological data are collected and fed into these computers, which then solve a series of mathematical equations to come up with a weather map. Excellent though it is, this form of forecasting is only as good as the information received. If there’s a gap in data – say, because the information is inadequate for more inaccessible areas like mountains or oceans – prediction will be less accurate.
In weather forecasting, once is never enough. When the supercomputers do their mathematical calculations, they produce what’s called a deterministic forecast – a single picture that does not allow for minute changes that could affect the outcome… like butterflies flapping their wings on the other side of the world.
For greater accuracy, meteorologists produce what’s known as an ‘ensemble’ forecast. The supercomputer reruns the deterministic forecast several times, using a slightly different starting point each time. This results in a number of different predictions. If all the results are fairly similar, the ensemble forecast is reasonably accurate. If, on the other hand, a range of very different results emerge, the forecaster will know that the prediction is less reliable.
RELIABLE SOURCE?
‘It is best to read the weather forecast before praying for rain.’
Mark Twain (1835–1910)
Here are some of the main devices – some hi-tech and some more homespun – that are used to measure and record weather conditions:
Aircraft With advances in technology, aeroplanes with large crews have been able to fly high in the sky and take direct recordings of weather conditions at altitude. Although they have largely been superseded by satellites, aeroplanes are still used for hurricane analysis – with their brave crews flying into the eye of the storm.
Anemometer Used to assess wind speed and direction, the most common type is the cup anemometer, consisting of three hollow cups on a vertical shaft. Different wind speeds cause the device to rotate at different rates, and these are then measured and recorded.
Balloon Weather balloons have been around since the late nineteenth century. The only problem was getting the information out of them – forecasters had to wait until a balloon floated back to land of its own accord, and this could be miles from its ori-ginal launchpad. Modern weather balloons, ‘radiosondes’, have radio transmitters that send a constant stream of information back to Earth, such as the temperature of the air at different altitudes. They can also exchange information with weather satellites, which increases their usefulness. Floating to heights of up to 27,400 metres (approx. 90,000 feet), balloons can go where other recording devices cannot – over otherwise inaccessible oceans, for example.
Radar Developed for military purposes during World War II, radar (Radio Detection and Ranging) works by bouncing radio waves off objects and detecting the returning echoes. Its usefulness as a meteorological device was soon discovered, and now it’s used to track storms, hurricanes and tornadoes, and to analyse clouds and predict rainfall. Damp air in clouds reflects the radio waves back to the radar; the damper the air, the stronger the return signal, and this allows forecasters to calculate where it’s likely to rain.
Rain gauge This does just what it says – it gauges rainfall, either by measuring the weight or the volume of any precipitation. There are several different types and, although their simple construction should make them foolproof, things can go wrong – for example, snow or ice can block the funnel so that readings become inaccurate.
Satellite The real hi-tech option, weather satellites offer the most advanced method for recording atmospheric conditions. There are two types: geostationary satellites, located at about 35,680 kilometres (approx. 22,200 miles) above the surface, that travel at the same speed as the Earth turns, so they are always above the same place; and polar orbiting satellites, circling from pole to pole and travelling at a lower altitude so that they give a more detailed picture of weather conditions closer to the Earth. Satellites provide information on temperature, moisture levels, ozone distribution and solar radiation.
Sling psychrometer Used to measure relative humidity, this consists of two thermometers. One measures the dry air temperature, while the other is wrapped in a damp fabric wick. When the psychrometer is spun around, the evaporation from the wet wick causes the temperature to drop. The difference in the readings between the two thermometers indicates the level of humidity in the air.
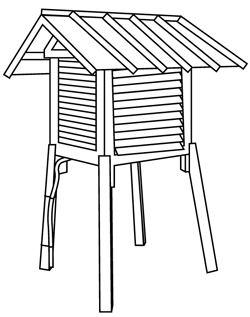
Stevenson Screen A box-like shelter that looks a bit like a beehive and houses meteorological instruments for taking readings such as surface temperature. To avoid the strong rise and fall in temperature at ground level, the screen is raised up on legs. It has louvred sides to allow air to pass through and is painted white to reflect heat because it’s the temperature in the shade, not sunshine, that is measured. The Stevenson Screen was invented in 1864 by the engineer and meteorologist Thomas Stevenson (1818–87), father of the famous author Robert Louis Stevenson.
Wind sock Not exactly hi-tech, this conical tube of fabric, open at both ends and mounted on the end of a long pole, helps airline pilots to gauge wind direction and strength. When the wind blows, it flows through the sock, lifting it so that it points away from the wind and thus shows the direction from which the wind is coming.
Air pressure and temperature are crucial ingredients in the make-up of the weather, but measuring these is not that simple. Pressure and temperature vary with altitude, so meteorologists have had to agree on a common standard:
• Air pressure is measured at sea level and is recorded in units of pressure called millibars; the average air pressure at sea level is 1013.25 millibars.
• Air temperature is measured at a height of 1.5 metres (5 feet) above ground. So if the weather forecaster says the temperature will be 27°C (80°F) tomorrow, that refers to the temperature of the air swilling about at roughly that height.
HOT AND COLD
It was all very well having thermometers to measure temperature, but to give meaning to the temperature scale, it had to be linked to temperatures in the natural world. The German physicist and engineer Daniel Gabriel Fahrenheit (1686–1736) took the approximate temperature of blood as the top end of his scale at 100°F – his northern European compatriots did not expect air temperatures to rise any higher than this. The temperature at which fresh water froze then became 32°F. The Swedish astronomer Anders Celsius (1701–44), on the other hand, took the freezing point of water as his 0°C, and the boiling point as 100°C.
SIGNS AND SYMBOLS
Weather charts have a language all their own – and it’s fun to learn how to read them. Wind is measured in knots and, on a weather chart, winds are represented by lines called ‘barbs’ that look rather little arrows with feathers at the tail. The barbs point in the direction in which the wind is blowing and the ‘feathers’ – or short prongs protruding from the side of a barb – indicate its speed. If the wind is really strong, a pennant-shaped triangle is added to the side of the barb. Here’s the maths:
1 knot = 1.9kph (1.15mph)
Full-length prong = 10 knots
Half-length prong = 5 knots
Pennant = 50 knots
Prongs and pennants can be added up to give an actual wind speed. So, for example, a full-length prong and a half-length prong show a wind speed of 15 knots.