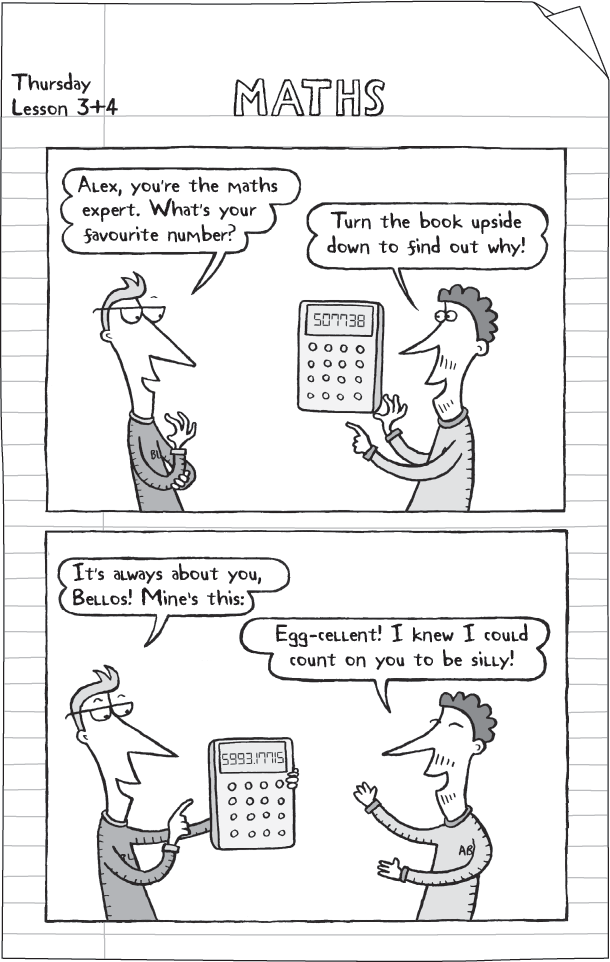

Football is about numbers. It’s a game of 11 versus 11, for 90 minutes, in which each team tries to score a greater number of goals than their opponent. League tables are grids of digits: wins, draws, losses, matches played, goal difference and total points. All these numbers are why Alex loves it!

But that’s just the start. Football is full of data and statistics (or stats), which are facts that can be described with numbers. Before a match, you will hear commentators give team stats such as how many times the teams have played each other before and which team won the most times. After a game there will be data to show how long each team had possession of the ball, how many shots on goal there were and many other facts. A data deluge! A swamp of statistics!
In this lesson we are going to find out how football data is collected and then look at how it can be used to give us fascinating insights into the game.
Let the countdown begin!
At the beginning of every Premier League match, in an office far away from the stadium, two people will be sitting in front of a bank of computer screens, ready to turn that match into numbers.
As soon as the whistle is blown, these data gatherers start typing away on their keyboards. Tap, tap, tap, tap! The moment a player touches the ball, they type in his shirt number and also what he does with the ball, such as “pass” or “cross”, from a list of many actions. There are two data gatherers because getting all that information is too much for just one person to do. They split the load – one types in the data for the home team and the other for the away team.

The data gatherers must stay focused for the entire match so that every detail is captured. No sneezing or scratching your bum! As well as “pass” and “cross”, there are about 50 different events they need to type in if they see it happening on the pitch. Some are obvious and easy to register, such as “goal”, “corner” and “red card”. But there are others that require eagle-eyes and good judgement, such as “flick on”, “good skill” and “interception”. One of the screens has an aerial diagram of the pitch, on which they click the position of the ball each time it is kicked.
At the end of the game, the gatherers quickly check for mistakes and then send all the data to companies like TV channels and newspapers. Then they can finally relax. It’s been an exhausting 90 minutes for their eyes, fingers and brains.
Gathering football data is done by humans rather than by computer since computers are not good enough (yet!) to do the job properly. For example, when a dozen players jump together for a ball from a corner, a human data gatherer is able to judge who headed the ball by looking at details like the players’ facial expressions, hairstyles and maybe even the colour of their shoes. Computers don’t have a clue!


We collect all this data in order to understand the game better. Numbers allow us to discover football facts that we would not otherwise know. If we look at data from the history of English football’s top flight (meaning the First Division from 1888–1992, and the Premier League from 1992–2017) then it is easy to find out some very intriguing stats:


Sometimes we need to do some maths to make the statistics easier to understand. Today we’re going to learn about percentages and averages.
Percentages are a way to describe amounts as a proportion of one hundred, and are used as a way to make different numbers easy to compare. For example, this diagram shows where on the pitch all Premier League goals from 1992–2017 have been scored from:

That’s a lot of goals! But it is not very clear how the numbers relate to each other. It’s much easier if we turn them into percentages:

The numbers in the pie chart mean that out of every 100 goals, about 79 came from inside the box in open play, about 12 came from outside the box in open play, about 7 came from penalties and about 3 came from direct free kicks (rounding to the nearest number). One hundred is a nice easy number to make comparisons from, which is why percentages make things easier to understand.

Sometimes football coaches say that their team “gave 110 per cent”, which means that football coaches are very bad at maths! No one can give more than 100 per cent, since 100 per cent of something means ALL of that thing. To say that the team gave 110 per cent is an exaggeration that means the team gave everything they could give – and more. At Football School, we mock these coaches for not exaggerating enough. Here we insist on 111 per cent!
Sometimes matches have no goals (boo!) and sometimes matches have lots of goals (yay!). We can use maths to work out how many goals there are on average per game.

This statistic does not mean that in every match 2.64 goals are scored – that would be impossible! What it means is that sometimes there are fewer than 2.64 goals and sometimes there are more than 2.64 goals, but if we take all Premier League games from 1992–2017 together, then a good estimate for the typical number of goals is 2.64. This is the average number.

The average number of goals per Premier League game between 2010 and 2017 is 2.75, a little bit higher than the average of all games between 1992 and 2017. Compare these figures to the averages in different leagues. In Germany you will see, on average, almost half a goal more per game than in France.
AUG 2010-17 |
AVERAGE NUMBER OF GOALS PER GAME |
German Bundesliga |
2.90 |
Spanish La Liga |
2.78 |
English Premier League |
2.75 |
Italian Serie A |
2.67 |
French Ligue 1 |
2.50 |
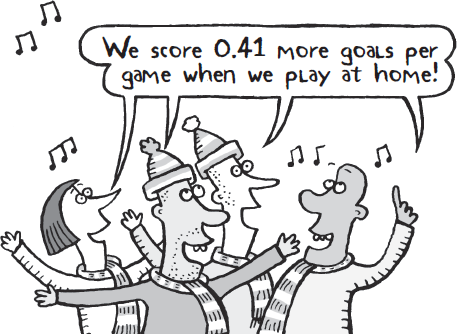
Most football fans know that there is an advantage to playing at home, since teams tend to perform better in their own stadiums. There are many reasons why this is true, such as familiarity with the stadium, being surrounded by all your supporters and not having to travel very far to get to the match. What’s great about maths is that we can use it to work out exactly how much better teams do at home than away.

If teams score, on average, 1.53 goals per game at home but only 1.12 goals away, then, on average, teams are scoring 1.53 – 1.12 = 0.41 more goals when playing at home than when playing away. The home advantage is almost half a goal per match!

The shot conversion rate is the number of times a shot at goal will result in a goal. The percentage is calculated by dividing the number of shots that score goals by the number of all shots at goal. Here are the top ten best teams from 2010–17. The average shot conversion rate across all clubs is 12.91 per cent, which shows how good the best ones are!
CLUB |
SHOT CONVERSION RATE (%) |
Barcelona |
22.24 |
Real Madrid |
19.38 |
RB Leipzig |
19.08 |
Bayern Munich |
18.52 |
Paris Saint-Germain |
17.82 |
Manchester City |
16.89 |
Manchester United |
16.85 |
Monaco |
16.69 |
Borussia Dortmund |
16.62 |
Arsenal |
16.38 |


1. What does “stats” stand for?
a) Statues
b) Statistics
c) Stalactites
d) Stationary

2. Which of these jobs requires the best hand-eye coordination?
a) Librarian
b) Teacher
c) Model
d) Bus driver

3. What is 50 per cent of 90 minutes?
a) 45 minutes
b) 50 minutes
c) 90 minutes
d) 110 minutes
4. If a team plays four games and scores the following number of goals – 1, 1, 2, 4 – in the games, what is the average number of goals the team scores per game?
a) 1
b) 2
c) 3
d) 4

5. What does the common phrase “big data” mean?
a) Data about fat people
b) A species of large dates grown in Cyprus
c) Lots and lots of data
d) DATA written in capital letters
