Figure 11-1 ACLS pulmonary edema, hypotension or shock algorithm

(Adapted from ACLS 2005 Guidelines)
The following tables of spectra of activity for different antibiotics are generalizations. Sensitivity data at your own institution should be used to guide therapy.
Penicillins |
||
Generation |
Properties |
Spectrum |
Natural |
Some GPC, GPR, GNC, many anaerobes (not Bacteroides) |
Group A strep, Enterococci, Listeria, Pasteurella, Actinomyces, Syphilis |
Anti-staph |
Active vs. PCNase-producing Staph Little activity vs. Gram ⊖ |
Staphylococci (except MRSA) Streptococci |
Amino |
Penetrate porin channel of Gram ⊖ |
E. coli, Proteus, Listeria, H. influenzae Salmonella, Shigella, Enterococci |
Extended |
Penetrate porin channel of Gram ⊖ |
Most GNR incl. Enterobacter, Pseudomonas, Serratia |
Carbapenems |
Resistant to most β-lactamases |
Most Gram ⊕ & ⊖, incl. anaerobes; not MRSA or VRE |
Monobactams |
Active vs. Gram ⊖ but not Gram ⊕ |
Gram ⊖ bacterial infxn in Pt w/ PCN or Ceph allergy |
β-lact. inhib. |
Inhibit plasma-mediated β-lactamases |
Adds staph, B. fragilis, & some GNR (H. flu, M. cat, some E. coli); intrinsic activity against Acinetobacter |
Cephalosporins |
||
Resistant to most β-lactamases. No activity vs. enterococci. |
||
Gen. |
Spectrum |
Indications |
1st (eg, cefazolin) |
Most GPC (incl. staph & strep, not MRSA); some GNR (incl. E. coli, Proteus, Klebsiella) |
Used for surgical Ppx & skin infxns |
2nd (eg, cefuroxime, cefotetan) |
↓ activity vs. GPC, ↑ vs. GNR. 2 subgroups: Resp: H. influenzae & M. catarrhalis GI/GU: ↑ activity vs. B. fragilis |
PNA/COPD flare Abdominal infxns |
3rd (eg, ceftriaxone, ceftazidime) |
Broad activity vs. GNR & some anaerobes. Ceftazidime active vs. Pseudomonas. |
PNA, sepsis, meningitis |
4th (eg, cefepime) |
↑ resistance to β-lactamases (incl. of staph and Enterobacter) |
Similar to 3rd gen. MonoRx for nonlocalizing febrile neutropenia |
5th (eg, ceftaroline) |
Only class of cephalosporin with MRSA activity. NOT active vs. Pseudomonas. |
MRSA. Not 1st line for MRSA bacteremia. |
Combination (eg, ceftolozane-tazobactam, ceftazidime-avibactam) |
MDR GNRs, incl. Pseudomonas. Ceftaz-avi has activity vs. some carbapenemases. |
Complicated UTIs, complicated intra-abdominal infections. |
Other Antibiotics |
|
Antibiotic |
Spectrum |
Vancomycin |
Gram ⊕ bacteria incl. MRSA, PCNase-producing pneumococci and enterococci (except VRE) |
Linezolid |
GPC incl. MRSA & VRE (check susceptibility for VRE) |
Daptomycin |
|
Quinolones |
Enteric GNR & atypicals. 3rd & 4th gen. ↑ activity vs. Gram ⊕. |
Aminoglycosides |
GNR. Synergy w/ cell-wall active abx (β-lactam, vanco) vs. GPC. |
Macrolides |
GPC, some respiratory Gram, atypicals |
TMP/SMX |
Some enteric GNR, Stenotrophomonas, PCP, Nocardia, Toxo, most community-acquired MRSA |
Clindamycin |
Most Gram ⊕ (except enterococci) & anaerobes (↑ resis. to B. fragilis) |
Metronidazole |
Almost all anaerobic Gram, most anaerobic Gram ⊕ |
Doxycycline |
Rickettsia, Ehrlichia, Anaplasma, Chlamydia, Mycoplasma, Nocardia, Lyme |
Tigecycline |
Many GPC incl. MRSA & VRE; some GNR incl. ESBL but not Pseudomonas or Proteus. |
CARDIOLOGY

“Rule of 6s” for PAC: RA ≤6, RV ≤30/6, PA ≤30/12, WP ≤12. Nb 1 mmHg = 1.36 cm water or blood.
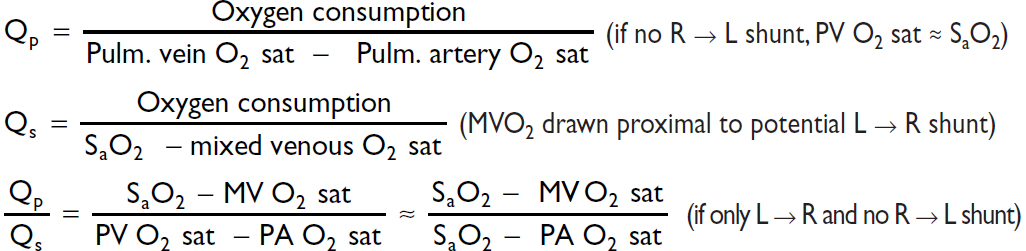
Fick cardiac output
Oxygen consumption (L/min) = CO (L/min) × arteriovenous (AV) oxygen difference
CO = oxygen consumption/AV oxygen difference
Oxygen consumption must be measured (can estimate w/ 125 mL/min/m2, but inaccurate)
AV oxygen difference = Hb (g/dL) × 10 (dL/L) × 1.36 (mL O2/g of Hb) × (SaO2–SMVO2)
SaO2 is measured in any arterial sample (usually 93–98%)
SMVO2 (mixed venous O2) is measured in RA, RV, or PA (assuming no shunt) (nl ~75%)

Assessment of RV function (Circ 2017;136:314)
PAPi = Pulmonary artery pulsatility index = [PA systolic – PA diastolic] / RA pressure >1.0 predicts RV failure in acute MI; <1.85 predicts RV failure after LVAD
Shunts
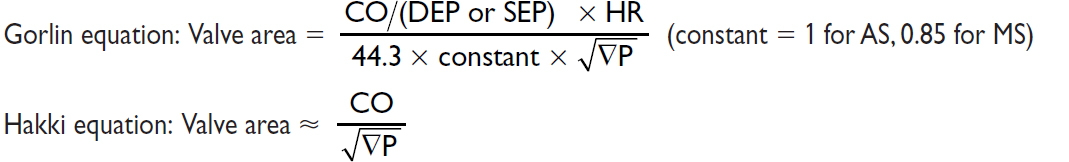
Valve equations
Simplified Bernoulli: Pressure gradient (∇P) = 4 × v2 (where v = peak flow velocity)
Continuity (conservation of flow): Area1 × Velocity1 = A2 × V2 (where 1 & 2 different points)

PULMONARY
Chest Imaging (CXR & CT) Patterns |
||
Pattern |
Pathophysiology |
Ddx |
Consolidation |
Radiopaque material in air space & interstitium patent airway → “air bronchograms” |
Acute: water (pulm edema), pus (PNA), blood Chronic: neoplasm (BAC, lymphoma), aspiration, inflammatory (COP, eosinophilic PNA), PAP, granuloma (TB/fungal, alveolar sarcoid) |
Ground glass (CT easier than CXR) |
Interstitial thickening or partial filling of alveoli (but vessels visible) |
Acute: pulm edema, infxn (PCP, viral, resolving bact. PNA) Chronic: ILD w/o fibrosis: acute hypersens., DIP/RB, PAP w/ fibrosis: IPF |
Septal lines Kerley A & B |
Radiopaque material in septae |
Cardiogenic pulm edema, interstitial PNA viral, mycoplasma, lymphangitic tumor |
Reticular |
Lace-like net (ILD) |
ILD (esp. IPF, CVD, bleomycin, asbestos) |
Nodules |
Tumor Granulomas Abscess |
Cavitary: Primary or metastatic cancer, TB (react. or miliary), fungus, Wegener’s, RA septic emboli, PNA Noncavitary: any of above + sarcoid, hypersens. pneum., HIV, Kaposi’s sarcoma |
Wedge opac. |
Peripheral infarct |
PE, cocaine, angioinv. aspergillus, Wegener’s |
Tree-in-bud (best on CT) |
Inflammation of small airways |
Bronchopneumonia, endobronchial TB/MAI, viral PNA, aspiration, ABPA, CF, asthma, COP |
Hilar fullness |
↑ LN or pulm arteries |
Neoplasm (lung, mets, lymphoma) Infxn (AIDS); Granuloma (sarcoid/TB/fungal) Pulmonary hypertension |
Upper lobe |
n/a |
TB, fungal, sarcoid, hypersens. pneum., CF, XRT |
Lower lobe |
n/a |
Aspiration, bronchiect., IPF, RA, SLE, asbestos |
Peripheral |
n/a |
COP, IPF & DIP, eos PNA, asbestosis |
CXR in heart failure
• ↑ cardiac silhouette (in systolic dysfxn, not in diastolic)
• Pulmonary venous hypertension: cephalization of vessels (vessels size > bronchi in upper lobes), peribronchial cuffing (fluid around bronchi seen on end → small circles), Kerley B lines (horizontal 1–2-cm lines at bases), ↑ vascular pedicle width, loss of sharp vascular margins, pleural effusions (~75% bilateral)
• Pulmonary edema: ranges from ground glass to consolidation; often dependent and central, sparing outer third (“bat wing” appearance)
Dead space = lung units that are ventilated but not perfused
Intrapulmonary shunt = lung units that are perfused but not ventilated

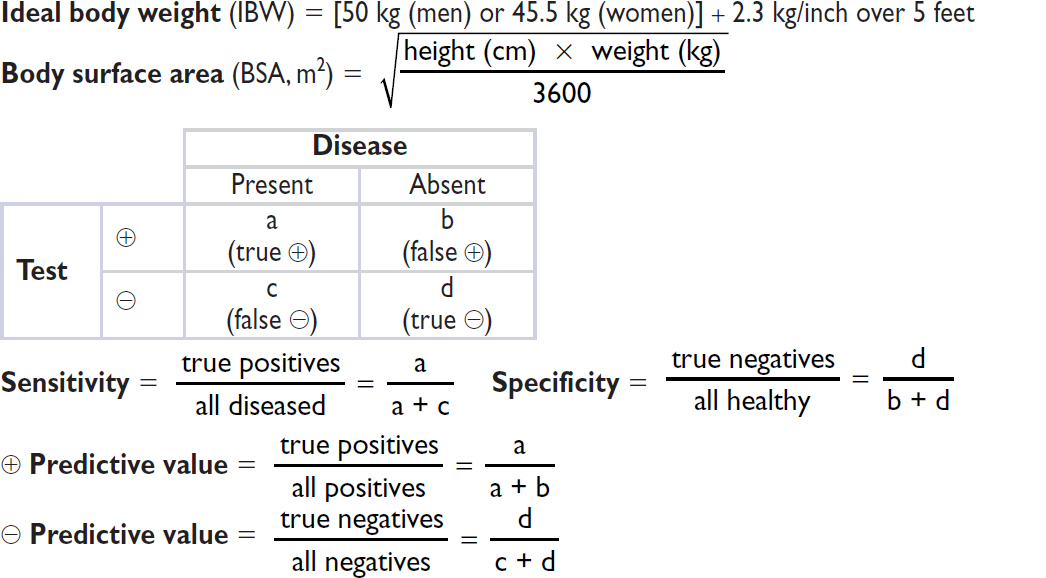
A-a gradient = PAO2 – PaO2 [normal A-a gradient ≈ 4 + (age/4)]
Minute ventilation (VE) = tidal volume (VT) × respiratory rate (RR)(nl 4–6 L/min)
Tidal volume (VT) = alveolar space (VA) + dead space (VD)

NEPHROLOGY
Anion gap (AG) = Na – (Cl + HCO3) (normal = [alb] × 2.5; typically 12 ± 2 mEq)
Delta-delta (ΔΔ) = [Δ AG (ie, calc. AG – expected) / Δ HCO3 (ie, 24 – measured HCO3)]
Urine anion gap (UAG) = (UNa + UK) – UCl
However, Δ in Na depends on glc (Am J Med 1999;106:399)
Δ is 1.6 mEq per each 100 mg/dL ↑ in glc ranging from 100–440
Δ is 4 mEq per each 100 mg/dL ↑ in glc beyond 440
Total body water (TBW) = 0.60 × IBW (× 0.85 if female and × 0.85 if elderly)

Trans-tubular potassium gradient (TTKG) = [UK / PK] / [UOsm / POsm]
HEMATOLOGY
(NEJM 2005;353:498)
Heparin for Thromboembolism |
|
80 U/kg bolus 18 U/kg/h |
|
PTT |
Adjustment |
<40 |
bolus 5000 U, ↑ rate 300 U/h |
40–49 |
bolus 3000 U, ↑ rate 200 U/h |
50–59 |
↑ rate 150 U/h |
60–85 |
no Δ |
86–95 |
↓ rate 100 U/h |
96–120 |
hold 30 min, ↓ rate 100 U/h |
>120 |
hold 60 min, ↓ rate 150 U/h |
(Modified from Chest 2008;133:141S)
Heparin for ACS |
|
60 U/kg bolus (max 4000 U) 12 U/kg/h (max 1000 U/h) |
|
PTT |
Adjustment |
<40 |
bolus 3000 U, ↑ rate 100 U/h |
40–49 |
↑ rate 100 U/h |
50–75 |
no Δ |
76–85 |
↓ rate 100 U/h |
86–100 |
hold 30 min, ↓ rate 100 U/h |
>100 |
hold 60 min, ↓ rate 200 U/h |
(Modified from Circ 2007;116:e148 & Chest 2008;133:670)
✔ PTT q6h after every Δ (t½ of heparin ~90 min) and then qd or bid once PTT is therapeutic
✔ CBC qd (to ensure Hct and plt counts are stable)

(Annals 1997;126:133; Archives 1999;159:46) or, go to www.warfarindosing.org
Warfarin-heparin overlap therapy
• Indications: when failure to anticoagulate carries ↑ risk of morbidity or mortality (eg, DVT/PE, intracardiac thrombus)
• Rationale: (1) Half-life of factor VII (3–6 h) is shorter than half-life of factor II (60–72 h);
∴ warfarin can elevate PT before achieving a true antithrombotic state
(2) Protein C also has half-life less than that of factor II;
∴ theoretical concern of hypercoagulable state before antithrombotic state
• Method: (1) Therapeutic PTT is achieved using heparin
(2) Warfarin therapy is initiated
(3) Heparin continued until INR therapeutic for ≥2 d and ≥4–5 d of warfarin (roughly corresponds to ~2 half-lives of factor II or a reduction to ~25%)
Common Warfarin-Drug Interactions |
|
Drugs that ↑ PT |
Drugs that ↓ PT |
Amiodarone Antimicrobials: erythromycin, ? clarithro, ciprofloxacin, MNZ, sulfonamides Antifungals: azoles Acetaminophen, cimetidine, levothyroxine |
Antimicrobials: rifampin CNS: barbiturates, carbamazepine, phenytoin (initial transient ↑ PT) Cholestyramine |
ENDOCRINOLOGY

NEUROLOGY
OTHER