Figure 2.1. Disastrous Effects of Ground Resonance (photo: Ken Haan)
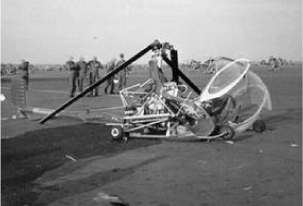
The phenomenon known as “ground resonance” is one of the most important and dangerous problems that may arise on a helicopter, Figure 2.1 [COL 58, BRA 76]. This is self-sustained coupling between the motion of the blades and the motion of the aircraft on its landing gear. The latter may become unstable depending on the value of the rotor speed; it has been observed that rotating systems, when standing on a flexible support, may be subject to destructive instability [NAH 84].
Figure 2.1. Disastrous Effects of Ground Resonance (photo: Ken Haan)

The first aircraft showing such instability were the gyroplanes and first helicopters, in the form of violent roll oscillations and, less frequently, pitch oscillations.
The latter appear when the aircraft is on ground, Figure 2.2. This phenomenon is improperly called “ground resonance” since it does not involve vibratory resonance but instable behavior.
Figure 2.2. Actor Elements of Ground Resonance
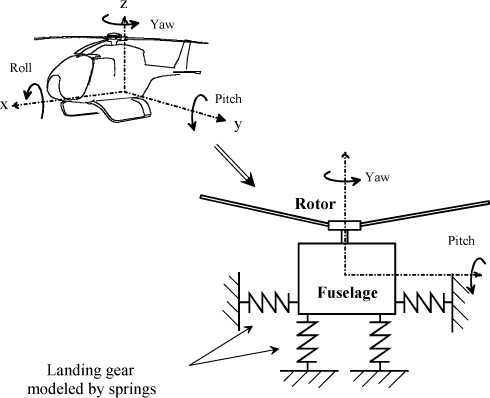
This instability is caused by coupling of the motion of the blades in the plane of rotation (termed lag motion) and the motion of the fuselage, usually about the roll axis, Figure 2.2.
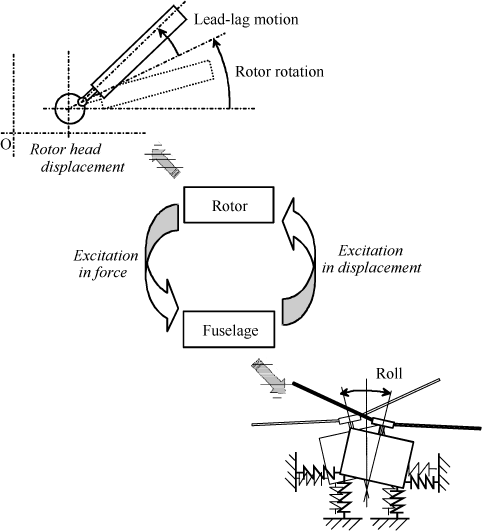
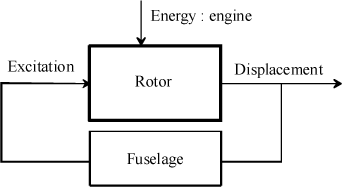
The motion of the fuselage will result in displacement of the rotor head, thus causing the blades to move. The blades will then, under the effects of inertia, act on the fuselage which in turn will move. Figure 2.3 illustrates this coupling.
Figure 2.3. Schematizion of Fuselage/Rotor Coupling
Such instability appears under certain conditions only. When taken separately from the rotor, the fuselage has an eigenfrequency ωf and each blade has a lagging eigenfrequency ωδ. In a stationary reference system, for a rotor rotating at Ω, the excitation frequency due to the lag motion and seen by the fuselage is Ω-ωδ. A necessary condition for ground resonance, expressing the equality between the rotor excitation frequency and the fuselage eigenfrequency, can be written as follows:
[2.1] 
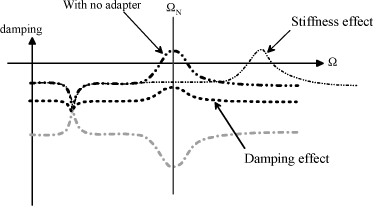
As this condition is not sufficient, damping must be taken into account. Given that the mode damping and frequencies are a function of the rotor rotational speed, their change in relation to the latter is usually analyzed, Figure 2.4.
To this end, a diagram is drawn to represent the rotor and fuselage frequencies as a function of the rotor rotational speed Ω, and used to analyze the rotational speed leading to coupling through curve crossing.
Figure 2.4. Ground Resonance Diagram. Frequency and Damping Change as a Function of Rotor Rotational Speed

A second diagram shows the change in structure and rotor mode damping, and is used to assess the unstable character of coupling.
The rated rotor speed ΩN must of course be avoided as it coincides with unstable coupling.
To this end, fuselage frequency ωf or lagging frequency ωδ can be modified. The most conventional solution then consists in modifying:
– the rotor characteristics through the stiffness of the lag adapter located between the rotor hub and the blade in order to prevent any coincidence within the rotor operating envelope, Figure 2.5, or
– the landing gear characteristics in order to set the eigenfrequencies of the fuselage bearing standing on its landing gear.
Figure 2.5. Effect of Stiffness of Lead-Lag Damper (Adapter)

It would also be possible to modify adapter damping, Figure 2.6.
Nevertheless, from a technical point of view, effectiveness is obtained more easily through stiffness than through damping.
There are therefore two methods to prevent ground resonance:
– increase damping;
– modify stiffness.
Figure 2.6. Effect of Damping on Lag Adapter
The following measurements show how, on a helicopter, the pilot can (voluntarily in this case) cause the ground resonance phenomenon to occur. The helicopter definition parameters have been modified from the certified version for this purpose. The pilot actuates the cyclic control stick in roll, thus causing blade lagging, Figure 2.7 and Figure 2.8. Stiffness of the lag adapter drops and the instability phenomenon occurs. This only remaining possibility for the pilot to stop coupling is then to take off.
Figure 2.7. Experimental Highlighting of Ground Resonance (Rotor definition parameters voluntarily modified)

The action of the pilot consists in moving the cyclic pitch stick circularly in the rotor rotation direction. The movement must be applied at the frequency corresponding to the roll mode of the aircraft on ground.
Figure 2.8. Pilot Action on Control Stick

It can be experimentally observed that excitation of the fuselage reduces the eigenfrequency of the aircraft on its landing gear.
This frequency change can be observed on the graph of Figure 2.9 which schematizes coupling.
Owing to the nonlinearity of stiffness, several stiffness values can be obtained as a function of the amplitude of the excitation that the pilot applies to the control stick. Small movements give high stiffness values, and large amplitudes give low stiffness values. The measurements proposed show slow divergence generated by the pilot actuating the control in longitudinal and lateral directions.
The usual indicator of “good stability” is the measurement of the vibration amplitude halving time. In the case of ground resonance, the indicator used is the lag adapter movement amplitude, Figure 2.10. These results were obtained on an experimental aircraft; the measurement points show good correlation with simulation. The stiffness drop was obtained through the excitation level at the control stick, characteristic of nonlinearity specific to the viscoelastic materials used.
Figure 2.9. Schematization of Ground Resonance Occurrence

As divergence is extremely rapid, the time to take off is very short. After takeoff, coupling disappears. The damper initial stiffness is regained, which enables the pilot to land again without danger.
These experimental tests are performed on an aircraft deliberately modified. Under normal operating conditions, the stability margins are substantial enough to protect against this type of phenomenon.
Figure 2.10. Effect of Lagging Stiffness on Damping

The physical observation of ground resonance showed that such phenomenon results from coupling of the lag motion of the blades and the roll or pitch motion of the fuselage.
We propose to build a model from a minimum number of degrees of freedom.
The connection between the blade and the rotor hub gives the possibility of having a relative flap or lag blade motion regardless of the technology used (hinged or rigid rotor). Only the lag motion is considered in this case.
Figure 2.11. Blade Lag Motion
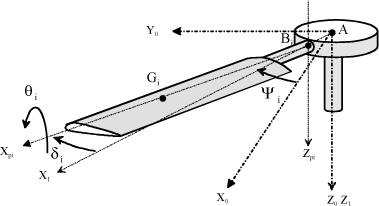
The following reference systems are defined:
–  Galilean reference system related to ground,
–  reference system related to the fuselage,
–  reference system related to the hub,
–  reference system related to blade No. i.
A and Bi respectively define the pivot connecting centers in the blade rotation plane, and Gi the center of gravity of blade No. i. The degree of freedom between blade No. i and the hub is termed lag, and is defined by:
[2.2] 
The pilot actuates the flight controls until obtaining angle θi so as to modify the blade incidence and thus cause the blade lift to vary.
Hub rotation is controlled at constant speed Ω and each blade is equidistributed. The following is then noted for blade No. i:
[2.3] 
The motion of the fuselage on its landing gear is such that, for small movements, displacement of the rotor head (point A) is assumed to be within a plane perpendicular to the axis of rotor rotation.
The fuselage is thus modeled by a two-degree-of-freedom mass representing the motion of point A along direction x0 and y0 [JAN 88, NAH 84, YOU 74, SMI 93, HAT 98], Figure 2.13.
Figure 2.12. Rotor HeadLateral and Longitudinal Motions

Figure 2.13. Rotor Head Motion Planar Modeling

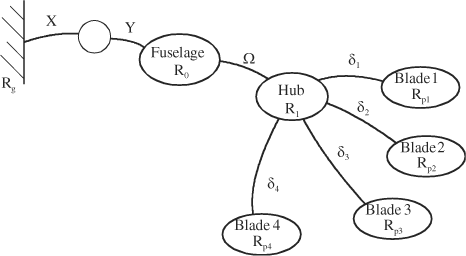
The degrees of freedom and associated parameterization can thus be represented in the form of a graph of connections. Figure 2.14.
Figure 2.14. Parameterization and Connection Graph for Simplified Ground Resonance Study
The equations of motion are obtained by the Lagrange’s method. For this study, we will then use:
[2.4] 
where:
– T(Σ/Rg): Galilean kinetic energy of system Σ;
– p E (Fp/Rg): Galilean potential function of actions deriving from a potential;
– D(Fd/Rg): Galilean dissipation function.
By definition:
[2.5] 
where:
[2.6] 
The mass characteristics are defined by:
– Fuselage: apparent fuselage mass: Mx along x and My along y
– Blade: it is compared to a linearly distributed mass with a linear density ρ.
Let us note:
[2.7] 
Installed between the hub and the blade, the lag adapter induces stiffness and damping. All adapters mounted on a rotor are assumed to be identical.
The adapter stiffness behavior is modeled by a perfect torsion spring with angular stiffness Kδ. Afterward, the potential function associated with the mechanical action of the lag adapters in the motion of Σ in relation to Rg is:
[2.8] 
The adapter damping behavior is modeled by a viscous-type angular damper with characteristic cδ:
[2.9] 
The nose and tail landing gear legs also induce stiffness and damping.
Figure 2.15. Helicopter Tail Landing Gear

The landing gear behavior is assumed to be linear for the small displacements studied, i.e.:
[2.10] 
The dissipation function due to the landing gear forces is equal to:
[2.11] 
The Lagrange’s equations can be applied to obtain the equations of motion. We have the following for each blade:
[2.12] 
For the fuselage:
[2.13] 
For equation solving, we propose a method based on the Coleman’s work, in order to transform the system into a system of linear differential equations with constant coefficients.
Consisting in changing variables, this transformation uses the special matrix forms and enables non-constant terms to be eliminated.
For each variable related to the blade δi, θi, the following variable change is done:
[2.14] 
Figure 2.16. Pilot Actions on Flight Controls  Collective and Cyclic Stick Inputs

The value of θ0 corresponds to the collective variation of the blade incidence; the pilot can act on this value through the collective pitch stick (2, Figure 2.16).
The values of θ1s and θ1c correspond to an azimuthal variation which can be obtained by acting on the blade cyclic pitch stick (1, Figure 2.16). On the helicopter, the value of θcp is always set to zero.
All parameters δ0, δ1c, δ1s and δcp can be physically interpreted.
It can be observed that each blade i undergoes this motion at the same time. Under the effects of inertia due to the motion at δ0(t), center of the hub A and center of inertia G of the blades remain coincident.
Figure 2.17. Blade Collective Lag Motion

We can show that we have:
[2.15] 
The motion at δ1c shifts the center of inertia G of the blades from the center of rotation A which excites the fuselage in lateral motion along y.
We can show that we have:
[2.16] 
Figure 2.18. Blade Cyclic Lag Motion Rotor Lateral Shift

The motion at δ1s shifts the center of gravity G of the blades, which generates a longitudinal motion along x.
Figure 2.19. Blade Cyclic Lag Motion Rotor Longitudinal Shift

We can show that we have:
[2.17] 
δcp is the shear motion.
We can show that we have:
[2.18] 
Using the Coleman transformation for a four-blade rotor gives the following system of equations:
[2.19] 
Figure 2.20. Blade Lagging Shear Motion

It can be observed that the equations of collective lag δ0 and differential lag δcp are decoupled. For both of these modes, the rotor center of inertia G is not displaced. There are no effects of inertia to excite the structure.
The coupled equations are the following:
[2.20] 
The system can be canonized in the following form:
[2.21] 
With the following modal characteristics and coupling terms:

The stability criteria can be defined from the preceding system of equations. Only coupling between the motion along y and the motion at δ1c and δ1s of the blades is considered here. Let us consider the system under free speed:
[2.22] 
Set:
[2.23] 
where:

The characteristic equation used to evaluate stability is given by:
[2.24] 
It can be observed that, if coupling between the rotor and the fuselage is negligible, and rotor damping is negligible, the following simplified system is then obtained:
[2.25] 
Which gives the following characteristic equation:
[2.26] 
Let:
[2.27] 
The possible roots are:
[2.28] 
The frequencies are usually little modified by coupling and damping. A first coupling condition can therefore be defined:
[2.29] 
The following can also be assumed upon coupling, at the stability limit:
[2.30] 
Thus, equation [2.24] is written:
[2.31] 
Thus, the stability condition due to the negative character of the real part of the zeros of the determinant, is written:
[2.32] 
By taking again the parameters previously defined in [2.21], the stability criterion can be written:
[2.33] 
For a lagging rigid rotor (ωδ>θ), the right term is negative, the system is always stable whatever the damping the system may have.
For a lagging flexible rotor (ωδ<θ), the product of lag damping λδ and support damping λy must be greater than a critical value which depends on the characteristics of the system, specially stiffness of the adapters through ωδ and structure eigenfrequency ωy.
Figure 2.21. Lag Damper Damping Coefficient Versus Lagging Frequency

It was observed that the damping required is a function of lagging frequency ωδ and support eigenfrequency ωy. Higher damping is however necessary for the low lagging frequencies ωδ typical to hinged rotors.
Assuming that there is correspondence between frequencies (ωδ−Ω=ωy) and that the blade mass (N mp) is negligible in relation to the structure mass (My), the criterion takes a form known as Coleman’s form:
[2.34] 
The energy origin of this behavior can be understood by analyzing the effect of the turbine.
Figure 2.22. Self-Sustained Vibrations in Ground Resonance
The diagram of the control linkage generally installed on helicopters is given in Figure 2.23.
The rotor rotational speed is directly determined by the characteristics of the free turbine. The free turbine provides the rotor with a torque Cm and the aerodynamic forces provide a resisting torque Cr. The theorem of dynamic moment applied to the hub, noted S, projected on the axis of rotation, can be used to write:
[2.35] 
Figure 2.23. Helicopter Powerpiant
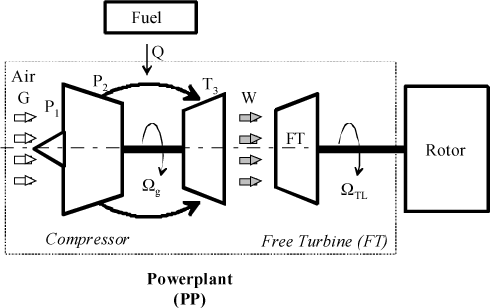
Figure 2.24. Hub Behavior Modeling
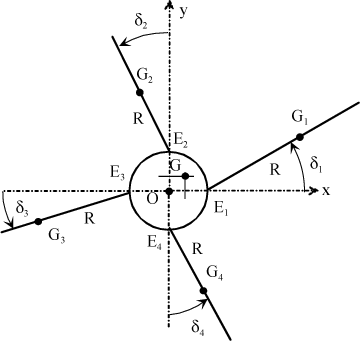
In the case of ground resonance, the rotor center of inertia oscillates around the rotor center of rotation. For a four-blade rotor, we have:
[2.36] 
The following is thus obtained in the case of small motions:
[2.37] 
The following can thus be written:
[2.38] 
The equilibrium equation in terms of torque then gives:
[2.39] 
It can be observed that, for maintaining a rotational speed constant, it is necessary to have an engine torque counter the inertia effects:
[2.40] 
The governing system maintains the rotational speed constant, and the turbine supplies the energy necessary for instability.
The lag dampers can be simplified or even removed for some rotor concepts by using an active control system [REI 91, STR 95, STR 87, SMI 93, MAL 97].
We propose to show the performance of such a system to eliminate the instability of the “ground resonance” type.
The idea consists in placing vibration sensors on the structure, and having actuators capable of creating forces in the structure so as to make the system stable.
Both of these components are coupled to a control system which computes in real time the signal to be applied to the actuators.
There are several possible actuators. The landing gear or lag adapters can be controlled by modifying their stiffness in real time or using the blade control system which would modify the rotor/fuselage coupling through the aerodynamic forces, Figure 2.25.
Figure 2.25. Ground Resonance Active Control Strategies

We propose to develop the method which consists in using the blade control system (servocontrols), Figure 2.26 and Figure 2.27.
It is necessary to make sure that this control system is capable of reacting appropriately within the controlled frequency band, and that there is no interference with the conventional control system.
Figure 2.26. Sensors and Actuators Used for Ground Resonance Active Control Through Control of Blade Incidence

Figure 2.27. Ground Resonance Active Control Schematic

It can be observed that, for modifying the coupling between blade lagging and fuselage rolling, choosing this possibility enables the natural coupling between blade flapping and lagging to be used.
Flapping is controlled by the pitch control. The previously developed equations are not sufficient; it is necessary to introduce the blade flapping motion as well as modeling of the aerodynamic forces.
The choice of measurements representative of vibrations was dictated for reasons of simplicity and reliability.
The control law to be generated was chosen of the single-variable type. The phenomenon representative parameter retained is roll measurement through a remote accelerometer, Figure 2.28.
Figure 2.28. Location of Sensor (Remote Accelerometer) for Active Control of Ground Resonance
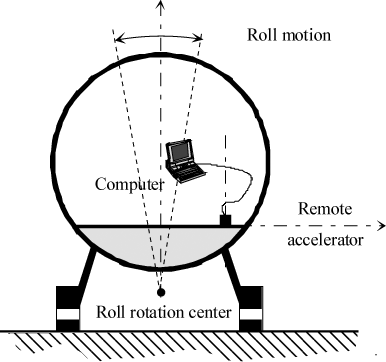
The preceding equation setting-up must be repeated by introducing the coupling associated with the blade flapping motion, Figure 2.29.
Figure 2.29. Blade Flap-Lag Motion

The number of degrees of freedom retained is 10 for a four-blade system, Figure 2.30.
Figure 2.30. Parameterization and Connection Graph by Allowing for Flapping

The aerodynamic forces play an important role since they act on the blade flap-lag motion.
The aerodynamic action is assessed by its screw at B, center of the flap-lag connection.
That is:
[2.41] 
Only the effects of lift on the airfoil are considered. That is:
[2.42] 
where:
– ρ: air density,
– a: airfoil chord,
– czp: local lift coefficient.
The lift coefficient czp is assumed to be within the operating interval, linear function of angle of incidence i.
Figure 2.31. Definition of Aerodynamic Forces on a Blade

Considering the magnitudes involved and neglecting the induced speed, the approximation on the expression of the linear speed of a blade point can be done:
[2.43] 
where:
– r: position of point M at the attachment point,
– Ω: hub rotational speed.
The incidence of the airstream on the blade, noted α, can be defined through linear approximation:
[2.44] 
Thus, the lift expression is defined by:
[2.45] 
 is assumed to be constant along the blade. By neglecting the second-order terms, it can be shown that:
[2.46] 
Set γ, Lock number, which represents a ratio between the aerodynamic forces and the inertia forces, coefficient largely used in aeronautical industry, such that:
[2.47] 
where R is the rotor radius.
Thus, as a first approximation, the aerodynamic force screw can be expressed by:
[2.48] 
Through the expression of this screw, it can be observed that the aerodynamic actions have an effect on the moment about the flapping axis and an effect on the resultant along axis  .
.
The moment expression shows that pitch θ will generate flapping which couples to lagging through effects of inertia (Coriolis effects); this is a first means to act on the system stability.
The resultant will cause fuselage rolling through the rotor hub/blade hinge; this is a second means to modify the system stability.
The equations of motion can be obtained by applying the Lagrange’s equations. The following is obtained for each blade:
[2.49] 
Observe that the flap/lag coupling term is obtained by effects of inertia known as Coriolis effects. The coupling involved in the flapping equation was neglected. In the lagging equation, this term is not negligible; the system can be made stable by increasing the flapping motion through the pitch, with damping added to that provided by the lag adapter.
It is useful to analyze the blade flapping behavior for a pitch actuation. It is specially necessary to check that it is not necessary to apply too much pitch θ in order to provide substantial flapping motions.
To this end, we propose drawing of the flapping/pitch transfer function for a sinusoidal actuation from the flapping equation written in the following form:
[2.50] 
Thus set:
[2.51] 
The isochronous transfer function expressed with reduced frequency u is then:
[2.52] 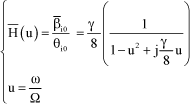
Figure 2.32. Pitch/Flapping Relation Transfer Function H(u)

Within the framework of ground resonance, the phenomenon is at a frequency close to 0.5 Ω.
It can be observed that, in this area, without applying a great pitch angle (and thus preventing blade stalling), it is possible to apply a flapping motion with enough amplitude to interfere with the blade lagging motion. The existing phase shift will be taken into account in the active control feedback loop.
The following is always obtained for the fuselage as a first approximation:
[2.53] 
The following variable change is done again for each blade-related variable δi βi and θi.
[2.54] 
Then, the coupled equations are written in the following form:
[2.55] 
These equations show that the Conolis effects and the aerodynamic forces are the important structure factors to achieve high efficiency on stability:
– for the Coriolis effects, as rotor rotational speed Ω is defined from other cntena, rotor pre coning β0 may be a significant factor and is integrated as from rotor design,
– as regards aerodynamic forces, Lock number λ is of importance but is usually defined to be effective dunng rotor control.
We propose, to analyze the effect of the pitch control on roll directly through flapping.
To this end, the model is limited to the roll motion of the fuselage, flapping motion of the blades and rotational motion of the rotor.
Figure 2.33. Action of a Blade on Rotor and Parameterization

When isolating one blade, the resultant theorem gives
[2.56] 
Thus, the part of the resultant which acts on the fuselage in roll can be assessed by:
[2.57] 
We thus show, for the aerodynamic forces, that:
[2.58] 
And, for the effects of inertia:
[2.59] 
Thus:
[2.60] 
The actions of the blade on the hub are the superimposition of the aerodynamic forces related to the pitch and flapping, and of the effects of inertia.
The blade flapping behavior equation is:
[2.61] 
For a harmonic excitation, set:
[2.62] 
The isochronous transfer function expressed with reduced frequency u is then:
[2.63] 
That is, for the hinge force:
[2.64] 
We can show that aerodynamic force Raero is zero at excitation frequency Ω(u=1). Only the effects of inertia act on the fuselage.
Using equations [2.65], [2.66]:
[2.67] 
where:
[2.68] 
The total action in the link can be written as:
[2.69] 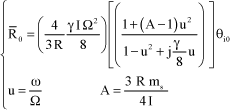
Note:
[2.70] 
Figure 2.34. Function G(u)
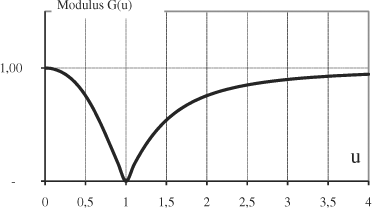
Within the framework of “ground resonance”, the phenomenon is at a frequency close to 0.5 Ω. In this area, it can be observed that the transfer function presents amplification. This is why, without applying a great pitch angle (and thus preventing blade stalling), it is possible to apply a flapping motion with enough amplitude to counter the roll motion. The existing phase shift will be taken into account in the active control feedback loop.
The system stability can be controlled through the effects on lagging and flapping hub loads, through the pitch inputs and hence flapping and lead-lag response.
Figure 2.35. Transfer Function of Forces in Flapping Hinge
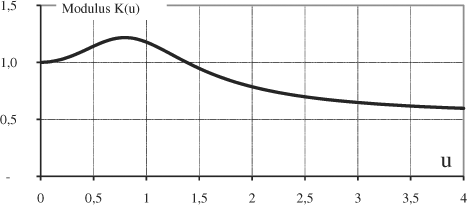
Figure 2.36. Effect of Flapping in Ground Resonance Active Control

There are several control laws to stabilize the system. We propose to develop only two. The first one allows to work from the model which uses the displacement of the rotor head but requires several variables to be observed.
The second one, which uses only one variable, has been retained and used during testing.
A first method consists in measuring variables X and Y which represent the displacement of the rotor head. The injected signal is then a function of both of these variables. A law can for example be established from the speed and acceleration, which allows to define setpoint values related to Active Control (AC). The latter supplement the setpoints related to the pilot or autopilot (AP):
[2.71] 
It can thus be shown that, by integrating the active control laws, the system equations become:
[2.72] 
This method has the advantage of showing the active control feasibility and is widely developed in material, and presents the drawback of using parameters not easily measurable and being hard to adjust.
An alternative consists in using a linear combination by using only two parameters of gain K1 and K2.
The two magnitudes measured are upstream filtered by a band-pass filter, Figure 2.37.
This system was used for testing on a 10-ton helicopter by measuring the roll and a remote acceleration.
Figure 2.37. Active Control Method Through Roll and Remote Acceleration
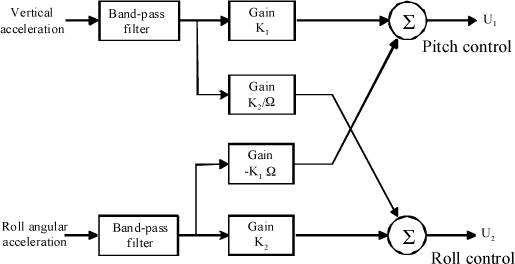
The main interest of this system is the easy location in the architecture of the helicopter autopilot.
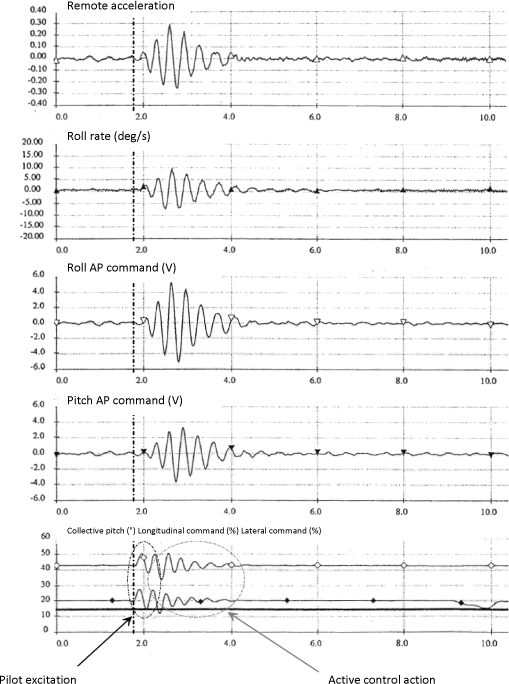
Moreover, it allowed very good aircraft stability convergence to be obtained after pilot cyclic input: the phenomenon is completely controlled, Figure 2.38.
Figure 2.38. Effectiveness of Active Control Through Roll and Remote Acceleration
From the equations, it can be observed that, for affecting stability, the commands can be used at θ1c or θ1s or both. The latter possibility allows the effect of the feedback law to be increased. A 90° phase shift must simply be provided in order to be in phase on the excitation. Thus, the command from the Active Control (AC) computer is defined such that:
Figure 2.39. Phase Shifter for Command at θ1s|AC

In order to define a control algorithm, we chose to use a single measured variable (off-centered acceleration) and a pitch control variable, which is the cyclic pitch combination, Figure 2.40.
The latter is superimposed on the autopilot.
Figure 2.40. Use of Cyclic Control and Servocontrol for Active Control

For this study, the feedback law principle adopted is as follows: the measured signal is filtered at the frequency concerned by a band-pass filter, then amplified by a factor K and phase-shifted by a value φ, Figure 2.41.
Figure 2.41. Law Principle Retained for Active Control of Ground Resonance

Figure 2.42. Transfer Function of Feedback Loop

The system uses second-order Butterworth filters (12 dB/octave). The signal from the accelerometer is filtered in a band-pass filter, the cutoff frequency of which is the ground resonance frequency.
It is then phase-shifted by another filter, the cutoff frequency of which is adjusted to obtain the desired phase delay.
This type of corrector was used for a prototype system. For an industrialized system, filters of lower order will be preferred.
A typical overall law is presented in Figure 2.42.
The whole control system can be summarized as follows:
Figure 2.43. Active System Overall Diagram

Simply select a gain K and a phase φ which stabilizes the system in order to find the correct system setting.
It can be observed, by simulation, that there is a possible setting range to remove the instability. A typical stability area is given in Figure 2.44.
This example was built from data of an existing helicopter.
Figure 2.44. Stability Envelope Versus Active Control Setting Parameters

Figure 2.45. Effect of Parameter K – φ Frozen on Vibratory Behavior – Roll Example

In order to define the best setting within the stability area, it was chosen to analyze the frequency response on the system parameters.
The roll example is given in Figure 2.45.
It can be observed that, by causing parameter K to change, with phase shift φ frozen, and remaining within the stability area, the mode is removed at 2.8 Hz. The risk is to cause two other modes to appear.
The compromise consists in assessing the setting allowing for the best smoothing.
Tests must be carried out to check the simulation results and analyze the compatibility with the control system.
Two test phases are required: bench tests and then flight tests.
The test bench is used to cause a great number of parameters to change, and test several control laws without involving the flight crew.
The flight tests are used to integrate the system with the aircraft and definitely validate the concept.
The tests on a specific test bench allowed for better understanding of the phenomena involved.
The test bench consists of a rotor and a frame representing the fuselage. The rotor mechanical assembly (control system, adapters, etc.) is present. An actuator is used to excite the structure so as to initiate ground resonance.
A safety actuator locks the system when the remote acceleration exceeds a threshold.
Among other things, this test bench is used to modify the modal characteristics of the frame so as to get a potential instability situation.
Figure 2.46. Schematization of Test Bench for Active Control With No Safety System

Figure 2.47. Ground Resonance Test Bench

The tests allowed to define a test bench configuration intended to obtain slow divergence, Figure 2.48. As instability occurred, a safety actuator started operating to make the system stable.
Figure 2.48. Test Bench Instability Observed Through Measurement of Acceleration λz

The bench tests are used to correlate the observations made through the simulations. Specially by validating law principles and possible settings.
Figure 2.49. Comparison of Gain K Setting on Acceleration λz

Tests on helicopter allowed to validate the control law retained during the bench tests. The purpose of these tests was to validate whether settings are stable or unstable, Figure 2.50 and Figure 2.51. It can be observed that the cases of predicted stability correspond to those obtained during testing.
Figure 2.50. Tests of Ground Resonance Active Control on Helicopter Effect of Gain

Figure 2.51. Tests of Ground Resonance Active Control on Helicopter Effect of Phase
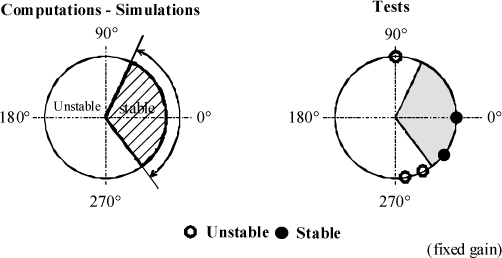
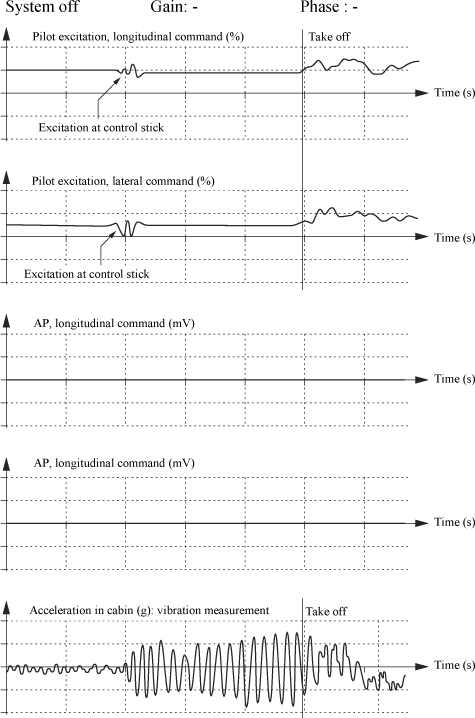
Measurement of the following time magnitudes shows that the system detects the appearance of instability; the setpoint then allows the system to be made stable.
Figure 2.52. Tests of Ground Resonance Active Control on Helicopter. Flight Tests for Several Phase and Gain Values

We propose to first explain the air resonance phenomenon qualitatively. The latter has a behavior very close to ground resonance since such instability corresponds to coupling between the rotor and the structure. The difference lies on the origins of the fuselage modes.
This phenomenon may appear in the case of steep turn in flight. In such a configuration, the pilot needs to apply more pitch control for higher lift in order to compensate for the effects of inertia and remain at a constant altitude. Rotor coning increases, and coupling between flapping and lagging by the Coriolis effects, as presented in the ground resonance description, increases.
As the fuselage has pendulous modes, the instability due to rotor/structure coupling may thus exist in practice, specially because of the fuselage morphology, through coupling between the cyclic lag motion and the roll motion of the fuselage.
Figure 2.53. Air Resonance Description

In a turn, as a small disturbance may be caused by the pilot movement, a wind gust is sufficient to make the aircraft oscillate in roll.
The equations used for ground resonance cannot be directly used. The ground resonance phenomenon is related to the motion of the rotor head, whereas the air resonance phenomenon is a fuselage pendulous motion. It is thus necessary to introduce the roll and pitch motions as well as the translational motions of the fuselage.
The fuselage is considered as an undeformable solid, the mass and inertial characteristics of which at the center of inertia are known. There are no fuselage deformation modes within the envelope studied (1 to 5 Hz). The blades are assumed to be rigid: the modes of blade deformation on helicopters studied have frequencies higher than about 15 Hz. The blades are compared to beams having the longitudinal axis as revolution axis. All blades are identical.
System Σ studied consists of the fuselage and N blades. The parameters used to define the fuselage motion are the displacements of the center of gravity and the three roll, pitch and yaw rotations defined in Figure 2.54.
Figure 2.54. Fuselage Degrees of Freedom Associated With Air Resonance Study

The angles are defined by the rotation of intermediate reference systems. The Galilean reference system is noted Rg, the fuselage reference system is noted R0. Ru and Rv are intermediate reference systems.
With:
[2.73] 
The angles are noted:
[2.74] 
As for the modeling of the ground resonance study, the connection of the blades to the rotor mast is modeled by a balljoint, one rotation of which is imposed by the pilot (eigenrotation of the blade about its longitudinal axis which corresponds to the incidence control). The other two possible rotations are the lag motion δi and flap motion βi. The blade reference system is noted R3:
[2.75] 
These angles are defined by:
[2.76] 
The lag adapter modeling, used within the scope of ground resonance, is retained.
The displacement vector, or system deformation, is termed X for system Σ, hence comprising the fuselage and the blades:
[2.77] 
Let a vector have 6+2 N dimensions in the case of an N-blade rotor. Each component is noted
Equation setting is done by the Lagrange formalism, [2.4]. To this end, use the definition of kinetic energy, potential energy and generalized forces by integrating the new degrees of freedom. For information only:
[2.78] 
T(Σ/Rg), Galilean kinetic energy of system Σ:
[2.79] 
Ep(Adap/Rg), Galilean potential function, and D(Adap/Rg), Galilean dissipation function due to the lag adapter:
[2.80] 
Qqi(Fa), generalized forces of aerodynamic forces:
[2.81] 
The system of equations obtained is linearized around the equilibrium position. For the helicopter in a turn at stabilized speed, the equilibrium position vector is given by:

where:

The linearized system of equations has nonconstant coefficients. Owing to the rotation of the blades in relation to the fuselage, the mass, damping and stiffness matrices contain terms functions of the blade azimuth of the cos(ψi) and sin(ψi) form, where Ψi corresponds to the blade azimuth, with the following for blade No. i:
[2.82] 
As within the scope of ground resonance, the transformation known as Coleman transformation is used, i.e.:
[2.83] 
In the case of a four-blade rotor, the displacement and control vectors become:
[2.84] 
From experience, some couplings between parameters are negligible. The following is thus retained:
[2.85] 
The model which represents the vibratory behavior of the helicopter in a turn under pitch actuations is given by the following system of differential equations with constant coefficients:
[2.86] 
By adding a trivial equation, the system takes the following form:
[2.87] 
The state vector is defined by:
[2.88] 
In the case of a four-blade rotor, this vector is of dimension 12. With:

where:

The problem is then formulated by means of the Duncan’s transformation.
By making this new variable change [2.88], the following equation of state is obtained:
[2.89] 
where:
[2.90] 
Analyzing the eigenvalues and eigenvectors of A will give information on the structure behavior.
Specially to define the stability through the real parts, and the positioning of the vibration frequencies through the imaginary parts.
For a helicopter of medium class, the system eigenvalues, whose real part represents damping, and imaginary part the mode eigenfrequency, can be represented in the complex plane.
The air resonance behavior is observed: when actuating the control stick in longitudinal direction (q1c), the helicopter responds in roll along the axis of lowest inertia.
The roll rate is a parameter of observation used in the active control loop; its response level can be observed through the transfer function in comparison with other parameters, Figure 2.56.
The system used for this type of resonance is similar to that set up for ground resonance.
The tests were performed in configuration of turn at stabilized speed and constant altitude in order to cause coupling between the rotor and fuselage to appear. This study was achieved with viscoelastic adapters, with the pilot generating an excitation through the stick.
Figure 2.55. Air Resonance Simulation Test Comparison

The transfer functions of all parameters are used to determine the action to be made in order to cause the phenomenon to appear. From the analysis of all results, it was retained that the cyclic controls (U1c and U1s) are the most effective to activate the mode due to coupling between the rotor and fuselage.
It can be observed that the measurable parameters representative of this mode are roll αx. pitch αy and displacements x, y of the fuselage. Roll parameter αx is the most representative.
Figure 2.56. Transfer Functions for Cyclic Control Excitation U1c

Figure 2.57. Schematization of Air Resonance Active Control System

Figure 2.58. Air Resonance Open-Loop and Closed-Loop Transfer Function

The other parameters have amplitudes too low to be retained, or are not easily accessible for measurement.