In this chapter, we’ll cover all the geometry you need to know for the Mathematical Reasoning test—including lines and angles, triangles, rectangles, circles, volume, and graphing.
The good news is that the geometry on the GED® test covers only a fraction of what is covered in high school. Even if you never took geometry, you can learn everything you need to get the GED® geometry questions right just by reading this chapter and doing the exercises that follow.
One reason GED® geometry isn’t too tough is that the diagrams are always roughly drawn to scale. As we showed you in our introduction to the Mathematical Reasoning test, this means that anytime there’s a diagram, you always have a wonderful, concrete way to ballpark the problem. As we cover each of the geometry topics in this chapter, we’ll show you how to measure the different types of diagrams.
If a geometry problem doesn’t come with a diagram, then you should immediately draw your own. Believe us, it’s a lot tougher to solve a geometric problem if you can’t see it. Take a few seconds to sketch the information provided for you in the question, and if possible, try to draw your figure to scale so you’ll have some idea of which answer choices are out of the ballpark.
Geometry Diagrams
If there’s a diagram, use your eyes to estimate what the answer ought to be. If there’s no diagram, draw one yourself.
On each GED® Mathematical Reasoning question, there is a clickable button to a list of many of the mathematical formulas you may need during the test. Here you will find the volume of a cube, the surface area of a pyramid, and the Pythagorean Theorem (don’t worry if you don’t know what that is yet).
You need to know the formulas for area and perimeter before taking the test—they will not be provided to you! You will be much more confident if you walk into the test room with these formulas already memorized and even more confident if you have practiced using the formulas on our two practice tests and the drills in this chapter.
Here are the topics that are tested on the Mathematical Reasoning test:
Lines and angles
Rectangles and squares
Triangles and pyramids
Circles and spheres
Cones and cylinders
Perimeter and area
Surface area and volume
Setup geometry
Graphing points and functions
Slope and the y-intercept
As in the previous chapters, we’ll first cover a concept, then give you examples of how this concept is used on the GED® test, and then give you a short drill. At the end of the chapter, there will be a larger drill that covers all the geometry topics together.
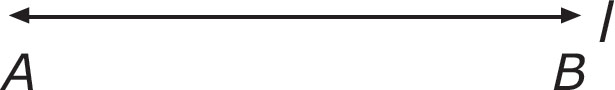
Here is a line:
This particular line is labeled l, and like all lines, it extends forever to the left and to the right. A and B are points on the line, and the distance between them, AB, is called line segment AB.
How many degrees does a line contain? If the second hand on the face of a watch moves from 12 all the way around to 12 again, it has gone 360 degrees. A straight line drawn on the face of that watch from 12 straight down to 6 cuts the face of the watch in half: All straight lines create an angle of 180 degrees.

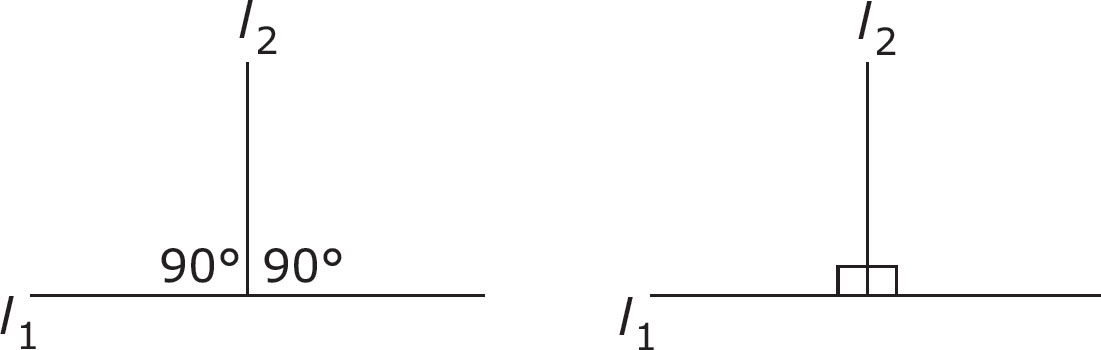
If that line is cut by another line, it divides that 180 degrees into two angles whose measures together add up to 180 degrees.

If the two lines cut across each other in such a way that they form two angles of 90 degrees each, then the two lines are called perpendicular. A 90-degree angle is also known as a right angle. On GED® diagrams, this is sometimes indicated by a little box drawn into the corner of the angles.
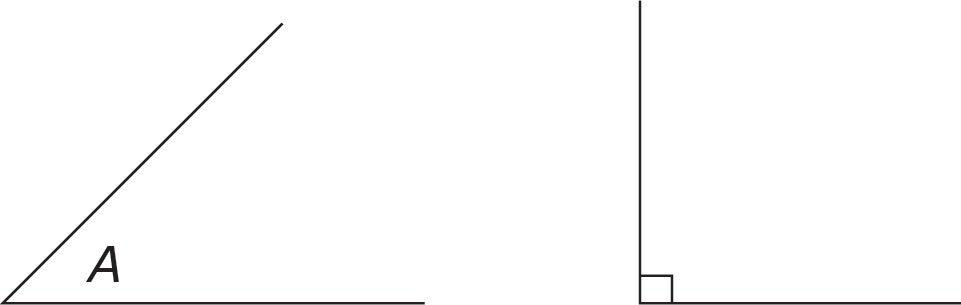
Whenever you see any angle on the Mathematical Reasoning test, it helps to compare it in your mind to a 90-degree angle. Take angle A below. Is it bigger or smaller than the 90-degree angle? If it’s bigger, then you can eliminate any answer choices that say that A is less than 90. If it is smaller, then you can eliminate any answer choices that say that A is more than 90. In this case, angle A is smaller than 90 degrees.
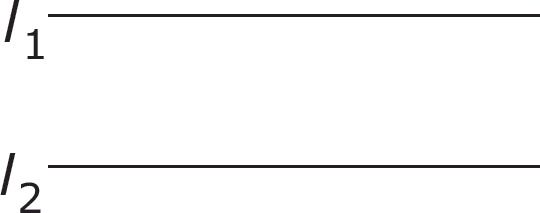
If two lines are drawn so that they could extend into infinity without ever meeting, these lines are considered parallel. The two lines below are an example of parallel lines.
You can check your answers in Part VIII: Answer Key to Drills.
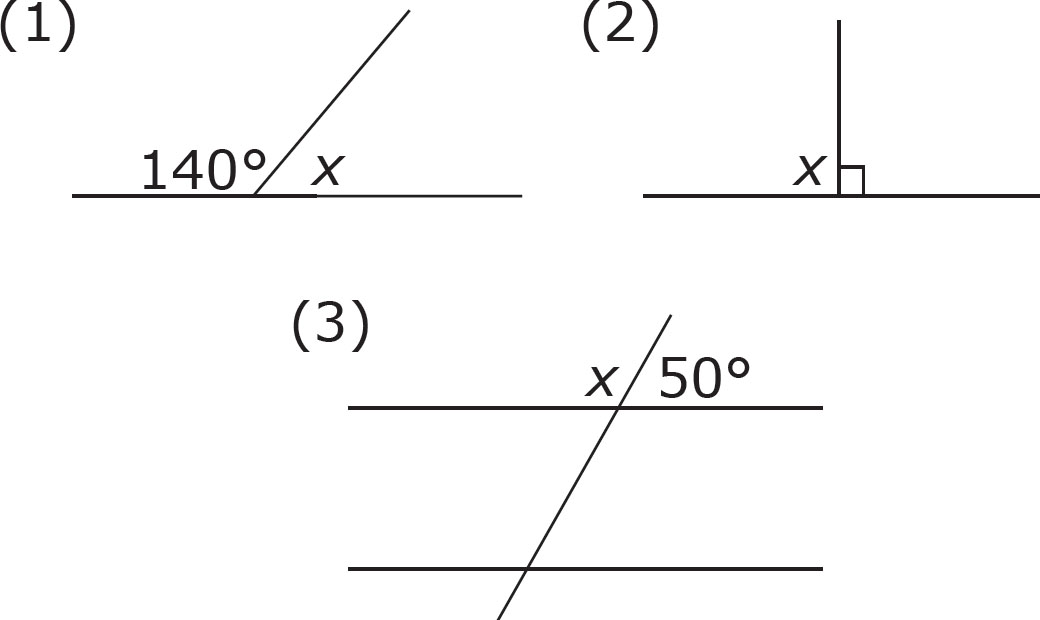
Determine the value of angle x in each of the diagrams below.
A rectangle is a four-sided object whose four interior angles are each equal to 90 degrees.
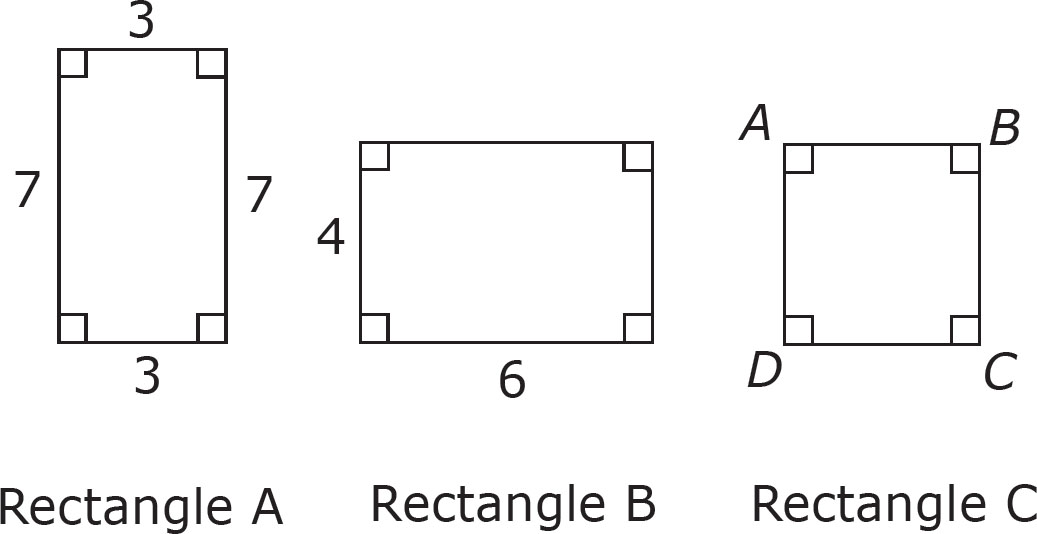
The area of a rectangle is found by multiplying its length by its width. The area of rectangle A is 7 × 3, or 21. The area of rectangle B is 4 × 6, or 24.
The lengths of the opposite sides of a rectangle are always equal to each other. For example, in rectangle C, side AB is equal to side DC, and side AD is equal to side BC. To find the perimeter of a rectangle, you simply add the four sides together. The perimeter of rectangle A is 20. The perimeter of rectangle B is also 20.
A square is a rectangle whose four sides all happen to equal one another. The area of a square can still be found by multiplying length by width, but because the length and width in a square are the same, you can also say that the area of a square equals side squared.
Let’s look at an example:


1. If rectangle ABCD has a perimeter of 26 and an area equal to that of square WXYZ, what is the length of segment XY?
A. 4
B. 6
C. 13
D. 36
Here’s How to Crack It
Since opposite sides in a rectangle are equal, side DC is also 9. Sides AD and BC are still unknown, but they must be equal, so call them x. Since the perimeter is the sum of the sides and the perimeter of ABCD is 26, then 9 + 9 + x + x = 26. Simplify the left side to get 18 + 2x = 26. Subtract 18 from both sides to get 2x = 8. Divide both sides by 2 to get x = 4. The question says that ABCD and WXYZ have equal areas, so get the area of ABCD. The area of a rectangle is A = lw. Since the length and width are 9 and 4, respectively, A = (9)(4) = 36. Thus, WXYZ also has an area of 36. In the case of a square, since all four sides are equal, use the simplified version of A = lw, which is A = s2. In this case, since the area of the square is 36, 36 = s2. Take the square root of both sides to get 6 = s. The question asks for segment XY, which is one of the sides of the square, so its length is 6. The correct answer is (B).


Square Rectangle Quiz
Q: Is a rectangle always a square, or is a square always a rectangle?
Turn to this page for the answer.
While area is always a two-dimensional measurement of flat objects on a page, volume is a three-dimensional measurement. Imagine a square metal lunch box. The volume of the box would represent how much space there is inside.

For rectangular solid objects, it is always easy to find the volume.
The formula for the volume of a cube is very simple. If you remember, the area of a square is side squared. The volume of a cube is side cubed. For the cube shown above, the volume would be 2 ³, or 8 cubic feet.
The formula for the volume of a rectangular solid is also simple. It is length × width × depth. For the rectangular solid shown above, the volume would be 2 × 3 × 4, or 24 cubic feet.
Here’s how this might look on the Mathematical Reasoning test:
2. If Judy wants to fill a rectangular pool with water, approximately how many cubic feet of water will she need if the pool’s dimensions are 10 feet wide by 12 feet long by 5 feet deep?
A. 1,200
B. 600
C. 300
D. 150
Here’s How to Crack It
The key words in this problem are volume and rectangular. As soon as you see these words, you should know just what to do. The volume of a rectangular solid is length × width × depth. In this case, that means 12 × 10 × 5 = 600. The correct answer is (B).
Rectangular solids and cubes also have surface area (SA), which is the combined areas of all of the two-dimensional sides combined. You could calculate the areas of each of the six sides, and then add all six together, or you could use the formulas for surface areas of each solid. For a cube, the formula is SA = 6 times the side squared. For the cube above, the surface area is 6 × 22, or 24 square feet.
For a rectangular solid, the surface area is 2 times the length × width, plus 2 times the length × depth, plus 2 times the width × depth. For the rectangular solid above, that would give us (2 × 2 × 3) + (2 × 3 × 4) + (2 × 2 × 4) = 12 + 24 + 16, or 52 square feet.
Square Rectangle Quiz
A: A square is always a rectangle. But a rectangle doesn’t have to be a square.
You can check your answers in Part VIII: Answer Key to Drills.
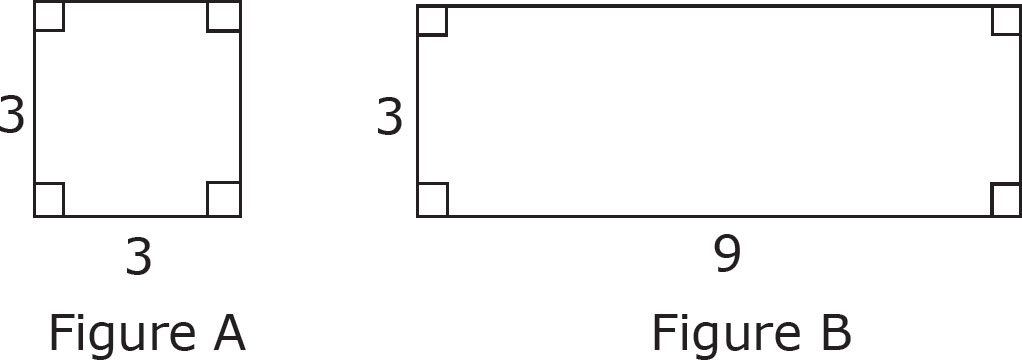
Answer the following questions based on the two figures above.
1. Identify Figure A.
2. Identify Figure B.
3. What is the area of Figure A?
4. What is the perimeter of Figure B?
5. How many Figure As would fit inside Figure B?
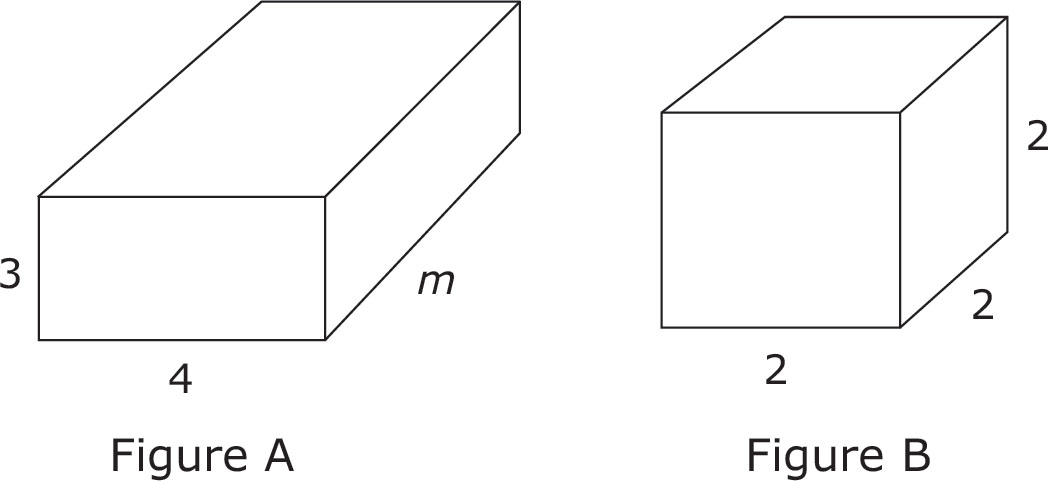
Answer the following questions based on the two figures above.
6. If the volume of figure A is 60 cubic feet, then what is the length of segment m?
7. Figure B is a tank in the shape of a cube. If this tank is to be filled halfway to capacity, how many cubic units will be in the tank?
8. Chen plans to wallpaper a rectangular room with the dimensions 10 feet by 12 feet by 9 feet high. If there are no windows, and only one door measuring 2 feet by 7 feet, and she does not wallpaper the ceiling or floor, approximately how much will it cost to wallpaper the room?
A. $395
B. $400
C. $412
D. Not enough information is given.
A triangle is a geometric figure with three sides. The three angles inside a triangle always add up to 180 degrees, no matter how the triangle is drawn.
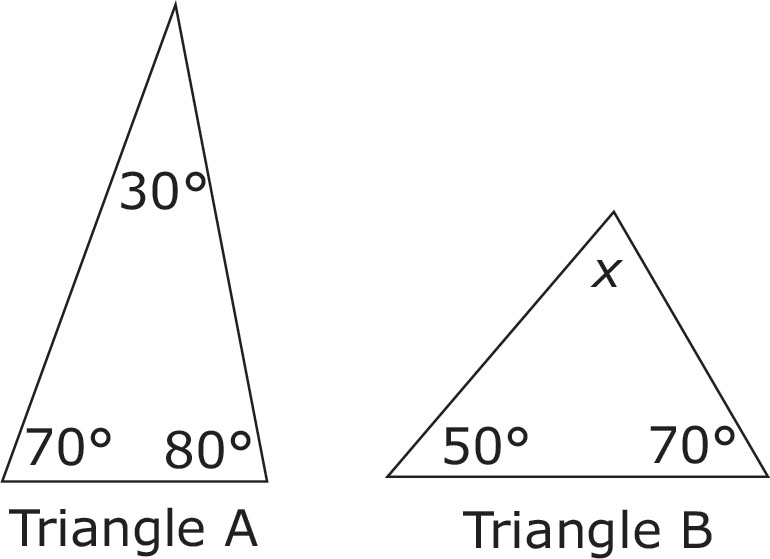
In triangle A, if you add up the three angles, you will notice that they add up to a total of 180 degrees. In triangle B, in order for the same thing to be true, how many degrees does angle x have to be? To find this out, add up the two other angles (50 + 70 = 120), and then subtract this from 180 (180 – 120 = 60).
Let’s see how this would look on the GED® test.
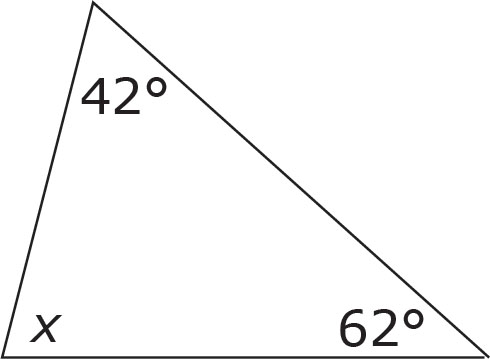
1. In the figure above, the triangle has three internal angles. One angle measures 42 degrees. Another angle measures 62 degrees. How many degrees does the third angle measure?
A. 104 degrees
B. 76 degrees
C. 52 degrees
D. Not enough information is given.
Here’s How to Crack It
The three interior angles of every triangle have a total of 180 degrees. If the GED® test writers give you two out of the three angles, then you can find the third. Add up the two angles whose values you know (42 + 62 = 104). Now, just subtract the sum of the two angles from 180 (180 – 104 = 76). The correct answer to this question is (B).
Could you have ballparked? Of course. Look at the missing angle in the figure. Is it greater than or less than 90 degrees? Obviously it’s a bit less, so we can eliminate (A). Now, compare it with the 62-degree angle directly across from it. Is it larger or smaller than 62 degrees? Come to think of it, it’s still a little bit larger, isn’t it. This lets us eliminate (C) as well.
The test writers have certain favorite triangles that they use over and over again on the tests. These are the isosceles triangle and the right triangle.
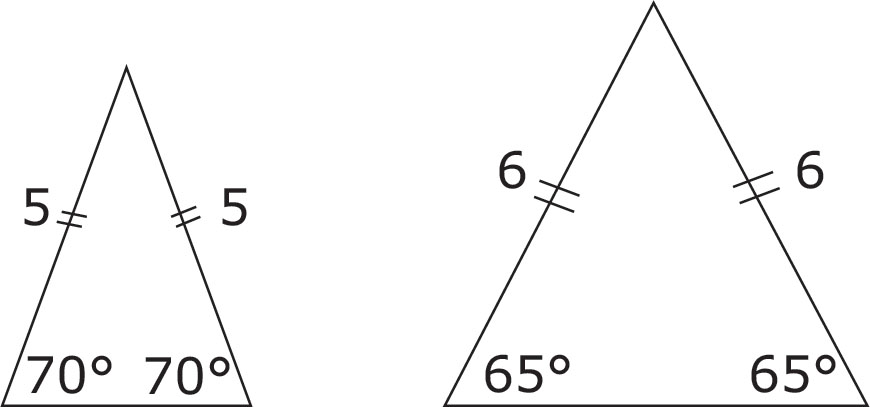
There are two important things to know about an isosceles triangle: First, it has two equal sides; second, the angles opposite those sides turn out to be equal as well.
Triangle Facts
• The number of degrees in a triangle always adds up to 180°.
• An isosceles triangle has two equal sides and two equal angles.
• An equilateral triangle has three equal sides and three equal angles.
Generally, the test writers will tell you one of these two important things and then ask you to supply the other. Here’s an example:

1. In the triangle above, if AB = BC, then what is the measure, in degrees, of angle A?
Here’s How to Crack It
If side AB equals side BC, then the two angles opposite those sides (angles A and C) must be equal to each other as well. Although the problem doesn’t mention it, this is in fact an isosceles triangle because of its two equal sides. First, find out the value of angle A plus angle C. The entire triangle has 180 degrees in it. If you subtract angle B (40 degrees) from the entire triangle, that leaves 140 degrees. Now, remember that angle A and angle C are equal to each other. How do you get the value of angle A alone? Divide by 2. The correct answer to this question is 70 degrees.
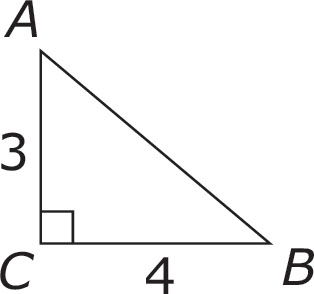
A right triangle contains one angle that equals 90 degrees.
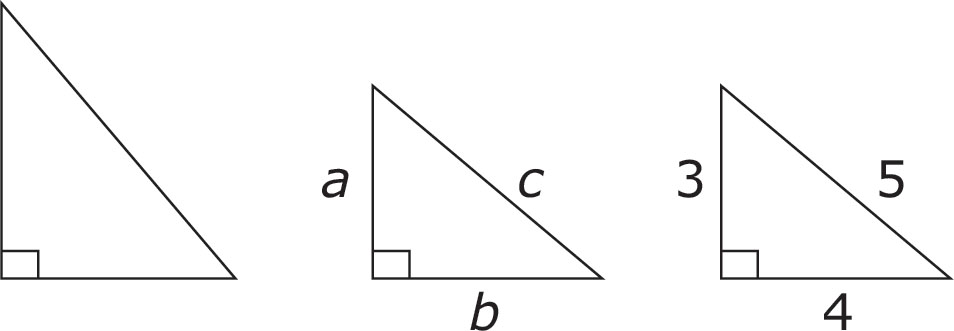
Pythagoras, a Greek mathematician, discovered that the sides of a right triangle always have a particular relationship, which can be expressed by the formula a2 + b2 = c2, in which a and b are the two shorter sides of the triangle, and c is the longest side opposite the 90-degree angle. This longest side is called the hypotenuse.
The most common right triangle on the Mathematical Reasoning test is a triangle whose sides are in a ratio of 3-4-5 (shown above). Let’s see if Pythagoras knew what he was talking about, by trying out his theorem with the 3-4-5 triangle. According to the formula, 32 + 42 should equal 52. Does it? Yes! 9 + 16 does equal 25. The Pythagorean formula is provided on the Mathematical Reasoning test along with all the other formulas, and you may need it for other right triangles. But you won’t need it for the writers’ favorite, the 3-4-5 triangle, since that one you can just remember. Here’s a sample problem:

1. To get to her office, Susan must drive due east for 3 miles and then due north for 4 miles, as shown in the figure above. If she could drive directly from her home to her office, how many miles would that route be if Susan traveled in a straight line?
A. 2 miles
B. 3 miles
C. 5 miles
D. 6 miles
Here’s How to Crack It
The shortcut from her office to her home forms the hypotenuse of a right triangle, as the diagram shows. One side of the triangle is 3; the other side is 4. Do you need to plug these numbers into the Pythagorean Theorem? Not if you memorized the 3-4-5 triangle. The correct answer to this question is (C).
The perimeter is the distance around the outside edge of any two-dimensional object. The perimeter of a triangle is the sum of the lengths of the three sides. What was the perimeter of the triangle in that last problem? 3 + 4 + 5 = 12.
The formula for the area of a triangle is
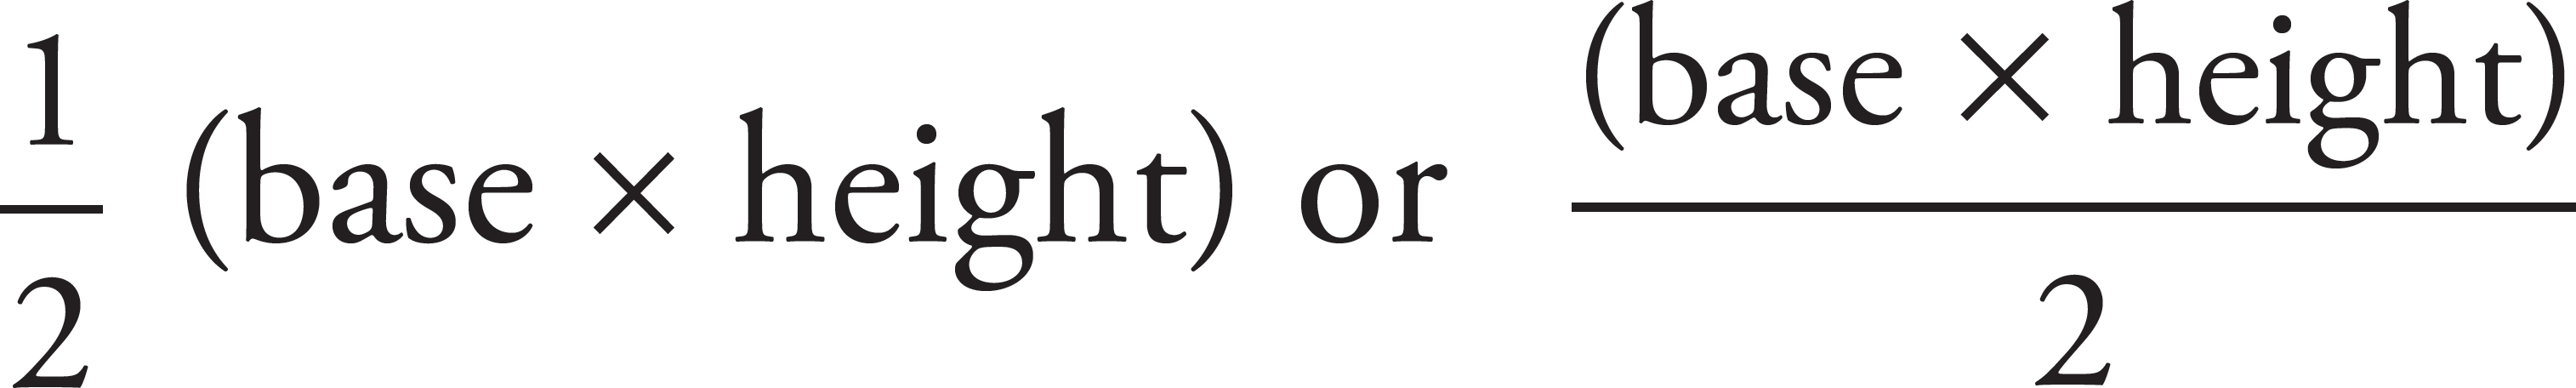
where the base equals the length of the bottom side of the triangle, and the height equals the length of a perpendicular line from the base of the triangle to the triangle’s highest point.
In triangle A, the base equals 5, and the height equals 6, so the area is  (5 × 6), or 15.
In triangle B, the base and height again equal 5 and 6, and the area of the triangle is again 15. However, note that because this is a right triangle, the height in this case is also the side of the triangle.
In triangle C, the base equals 10, and the height equals 3, so the area is (10 × 3), or 15.
Triangle Quiz
Q: What’s the area of a triangle with base 3 and height 6?
Turn this page for the answer.
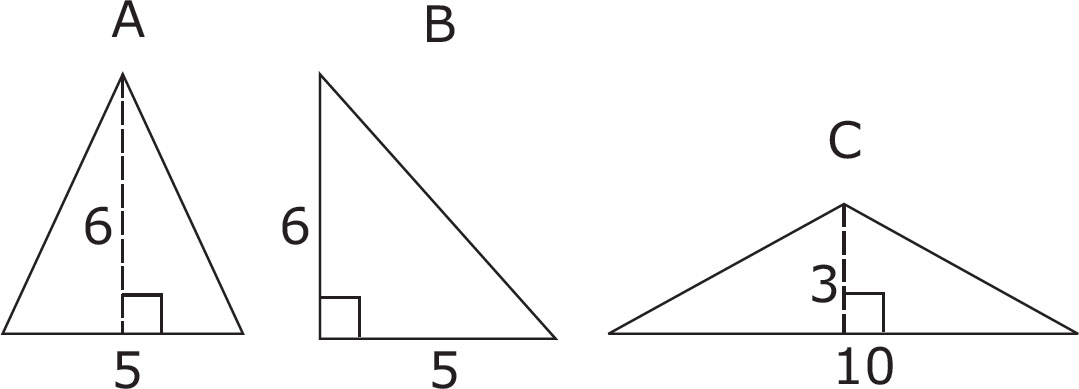
1. What is the area of the triangle above?
A. 7
B. 24
C. 48
D. Not enough information is given.
Here’s How to Crack It
To find the area of a triangle, you need the base and the height. In this triangle, you know the base (8) but not the height. The number 6 is simply the length of one of the other sides of this triangle and would have been the height only if this were a right triangle with angle A equal to 90 degrees. Therefore, the correct answer to this question is (D), Not enough information is given.
Let’s look at another one.
2. If a triangle has an area of 24 and a height of 8, what is the length of the base?
A. 1.5
B. 3
C. 6
D. 12
Here’s How to Crack It
The question gives the area of a triangle. The formula for area of a triangle is A = bh. The question states that the area is 24 and the height is 8, so plug these into the formula to get 24 = b(8). Simplify the right side (by multiplying × 8) to get 24 = 4b. Divide both sides by 4 to get b = 6. The correct answer is (C).
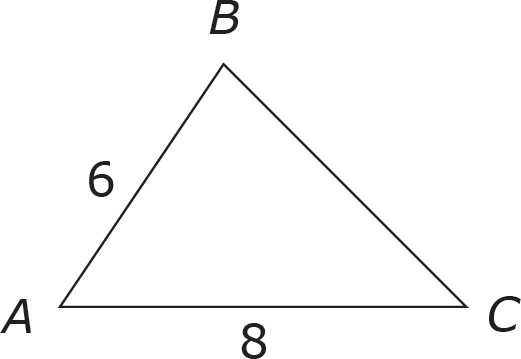
A pyramid is a three-dimensional shape made of triangular sides that sit atop a two-dimensional base. On the GED® test, this base will typically be a rectangle, so there will be four triangular sides.
To find the volume of a pyramid, you must first find the area of the rectangular base, B, and the height, h, from the base to the top of the pyramid. The volume is the amount of space inside the shape.
V =  Bh
Bh
In the above example, the volume would be
V = (3 × 4)(5) = 20.
The area of the base, B, is 3 × 4 = 12. After that point, simply plug in values for the variables in the equation.
To find the surface area (SA), you will need the perimeter, p, of the base, and the slant height, s, of a side of the pyramid. The surface area essentially adds up the areas of each side of the pyramid, including the base, B.
SA = ps + B
Again, let’s try this formula out with an example:
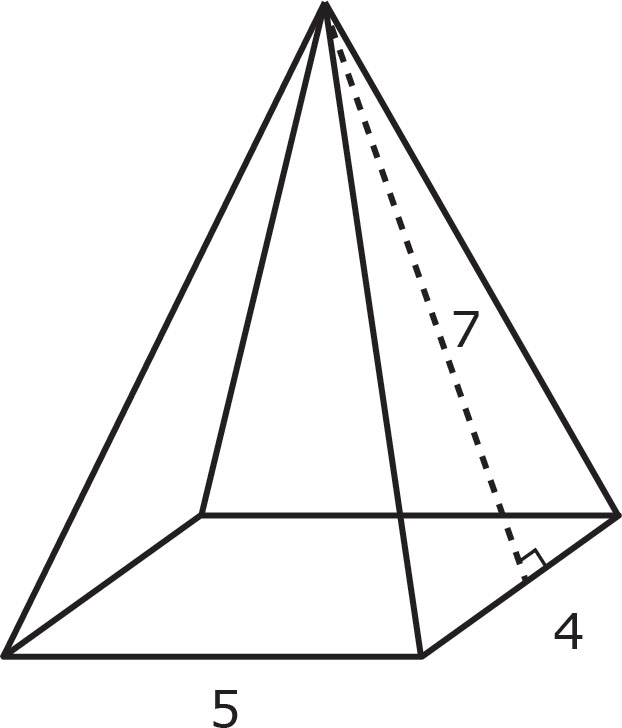
SA = (18)(7) + (4 × 5)
SA = 63 + 20 = 83
The perimeter, p, of the base in the above example can be found by adding 4 + 5 + 4 + 5 = 18.
Don’t worry about memorizing these formulas—they will be provided to you on the formulas page when you take the GED® test. Just familiarize yourself with them so that you know how to use them.
Triangle Quiz
A:  (3 × 6) = 9
You can check your answers in Part VIII: Answer Key to Drills.
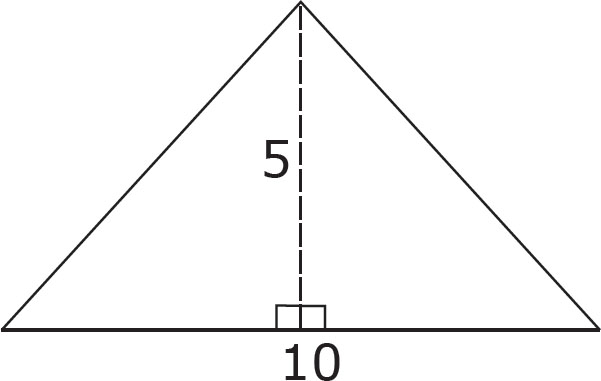
1. Michael is constructing a triangular garden as shown above. If the base of the garden is 10 feet long and the perpendicular distance from the base to the endpoint of the garden is 5 feet, then what is the area of the garden?
A. 50
B. 25
C. 15
D. Not enough information is given.
2. The distance from point A to point B is how much longer than the distance from point A to point C ?

3. If a triangle has interior angles of 27 degrees and 53 degrees, then what is the measurement, in degrees, of the third angle?
A. 26
B. 80
C. 100
D. 154
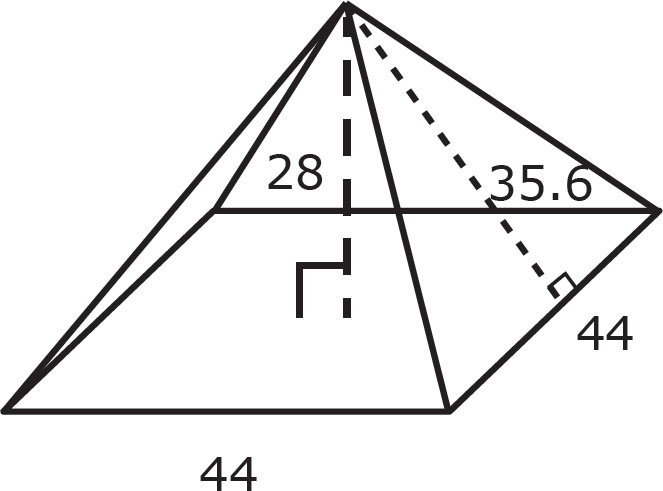
4. Sara is making a model of the Great Pyramid for math class. She has the dimensions labeled on the drawing above, in inches. The paint she plans to use on the outside of the model says that 1 can will cover 1,296 square inches. How many cans will Sara need to paint all the surfaces of her model pyramid?
A. 1
B. 2
C. 3
D. 4
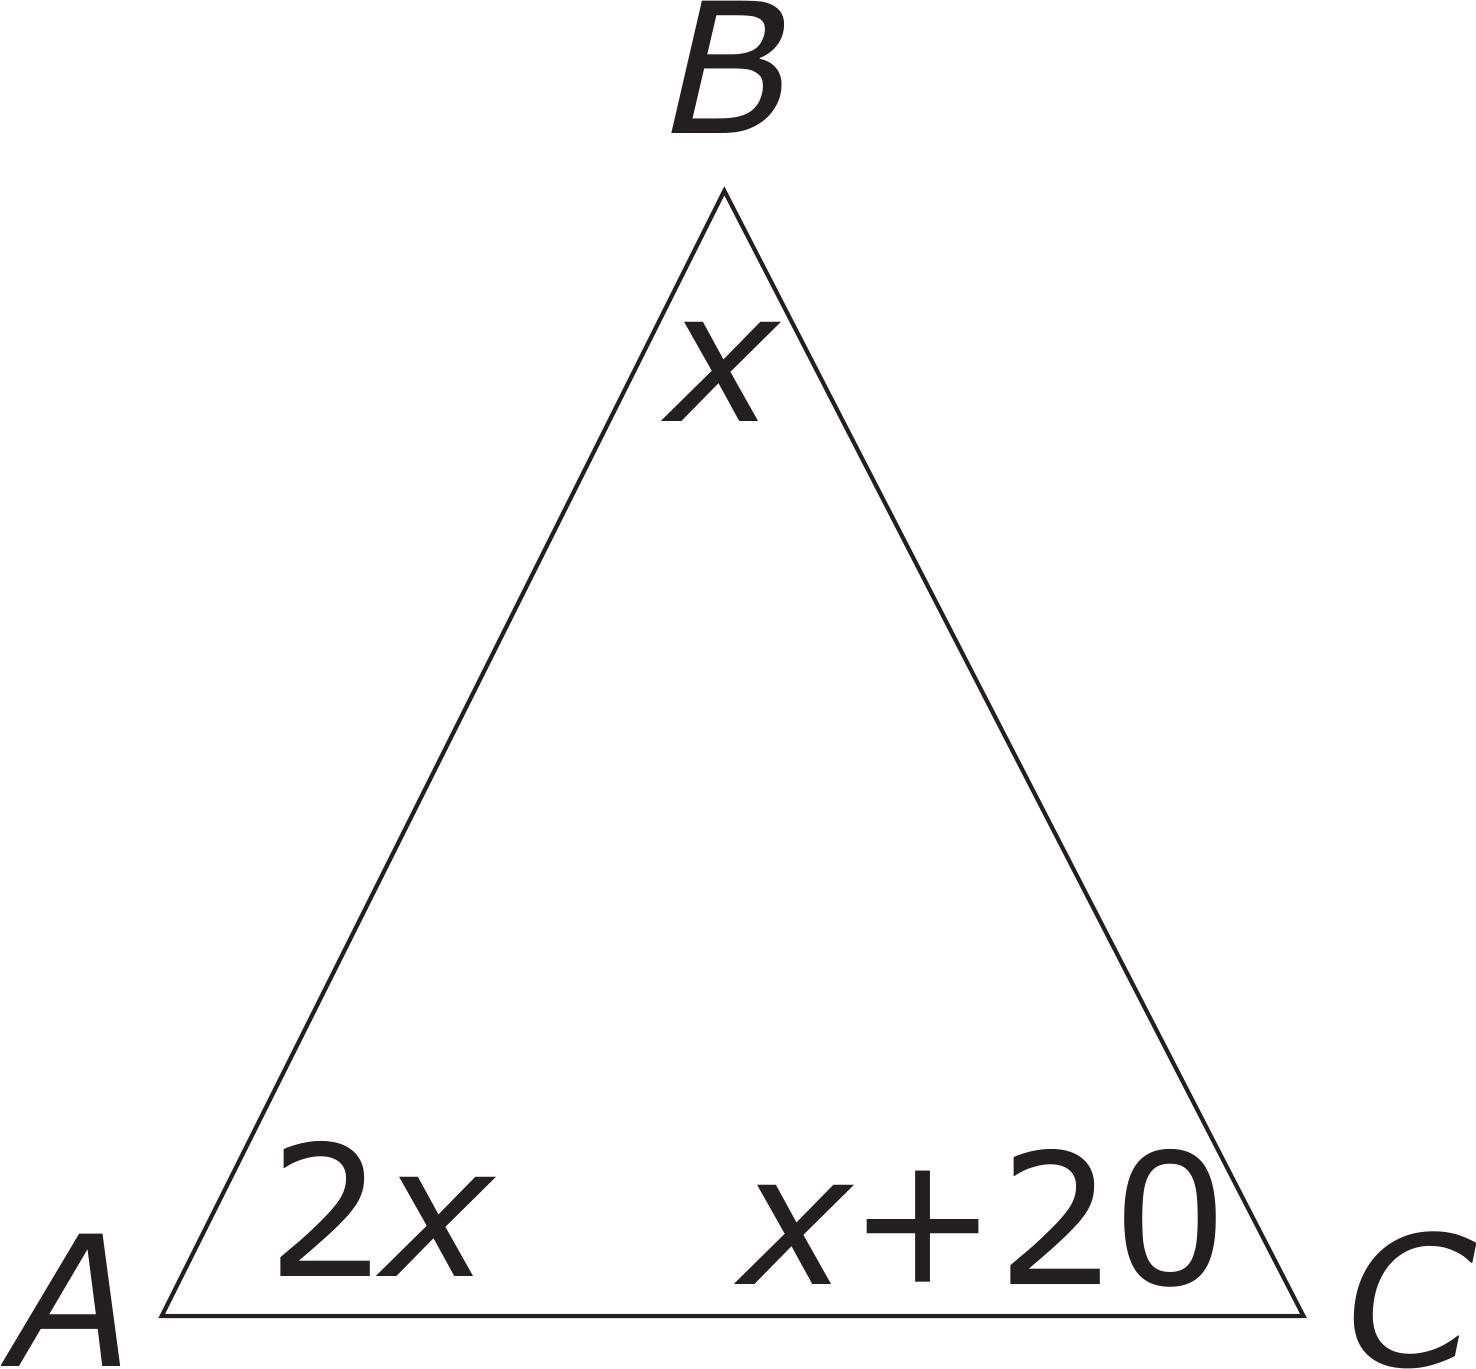
5. In triangle ABC above, the measures of the angles are shown in terms of x. What is the measure, in degrees, of angle A?
A. 40 degrees
B. 45 degrees
C. 70 degrees
D. 80 degrees
6. A pyramid with a square base has a volume of 320 and a height of 15. What is the perimeter of the base?
A. 8
B. 16
C. 32
D. 64
A polygon is a closed figure made up of line segments. Squares, rectangles, and triangles are all examples of polygons. Although those are the most common types of polygons on the GED® test, other polygons will also appear on the test. Pentagons (five-sided polygons), hexagons (six-sided polygons), heptagons (seven-sided polygons), octagons (eight-sided polygons), and other polygons can appear of the GED® test. A regular polygon is one in which the measures of all sides are equal and the measures of all angles are equal. Squares and equilateral triangles are examples of regular polygons.
One concept tested on other polygons is perimeter. Luckily, determining perimeter on less common polygons is not very different from determining perimeter on the more common ones. Either way, the perimeter is just the sum of the sides. Let’s look at an example.

1. What is the perimeter of the polygon above?
Here’s How to Crack It
To find the perimeter, add the length of each of the sides. In this case, the perimeter is 8 + 8 + 6 + 7 + 9 + 6 + 5 = 49. The correct answer is 49.
Other times they will ask you to find the area. Anytime this is done, they will provide you with the area formula.

2. The area of a regular hexagon can be found with the formula A =  s2, where s is the length of the side. What is the area of the regular hexagon shown above?
A. 18
B. 27
C. 54
D. 108
Here’s How to Crack It
The question gives a formula for the volume in terms of the side of the hexagon. The figure gives you that the side is 6, so plug this in for s to get A =  (6)2 = (36) =
  = 54
= 54 . The correct answer is (C).
You can check your answers in Part VIII: Answer Key to Drills.
1. The figure above has a perimeter of 40. What is the value of x ?
A. 4
B. 8
C. 16
D. 72
2. A regular octagon has a perimeter of 56. If the area of a regular octagon can be found using the formula A = 2(1 +  )s2, where s is the side of the octagon, what is the area of the octagon?
A. 49 + 49
B. 98 + 49
C. 49 +98
D. 98 + 98
The distance from the center of a circle to any point on the circle is called the radius. The distance from one side of a circle through the center of the circle to the other side is called the diameter. The diameter of a circle is always equal to twice the radius. In the circle below, the radius is equal to 3, so the diameter is 2 × 3, or 6.
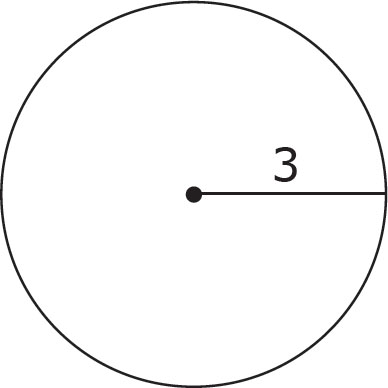
The circumference of a circle is the distance all the way around the outside edge of the circle. In other words, circumference is the name for a circle’s perimeter. The formula for the circumference of a circle is πd, where d is the diameter of the circle, and π is a number with the approximate value of 3.14. A long time ago, mathematicians discovered that this number, when multiplied by the diameter, gave the value for a circle’s circumference. The area of a circle is given by the formula πr2.
What is the circumference of the circle above? The diameter of this circle is twice the radius, or 6. Therefore, using the circumference formula, the circumference of this circle is 6π. What is the area of the circle above? Using the formula for the area, we get π32, or 9π.
One concept that is helpful on circle questions is CArd. CArd stands for Circumference, Area, radius, and diameter. If you know of one these, you can determine the other three. Look at the table below. In each row, there is one piece of the CArd puzzle. Fill in the other three.
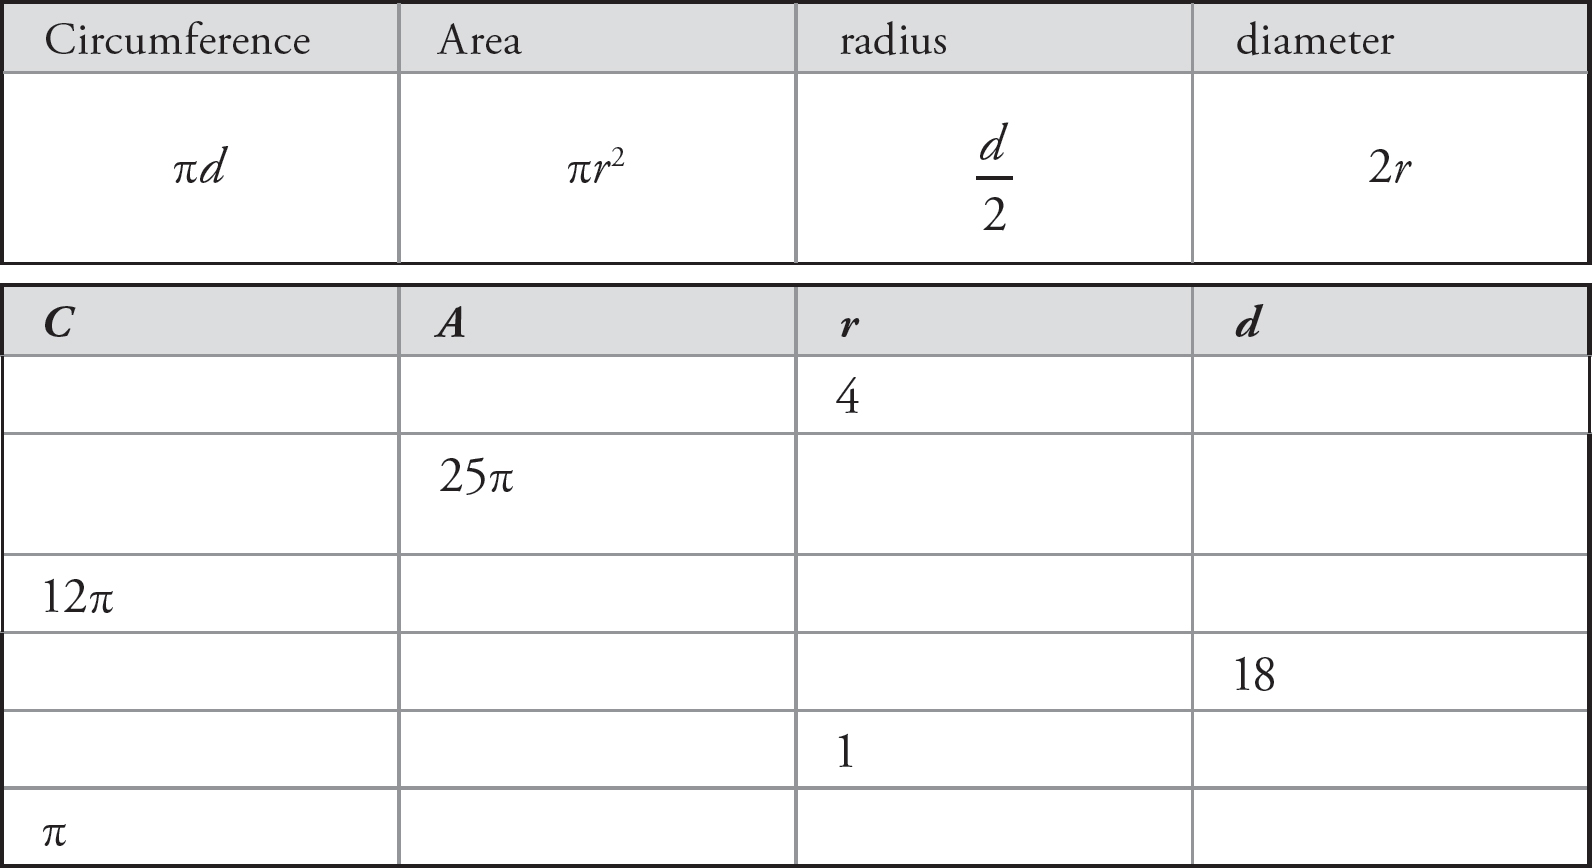
In the first row, r = 4. Therefore, d = 2r = 8, C = πd = 8π, and A = πr2 = 16π.
In the second row, A = 25π. Since A = πr2, r = 5, d = 2r = 10, and C = πd = 10π.
In the third row, C = 12π. Since C = πd, d = 12, r =  = 6, and A = πr2 = 36π.
In the fourth row, d = 18. Therefore, C = πd = 18π, r = = 9, and A = πr2 = 81π.
In the fifth row, r = 1, so d = 2r = 2, C = πd = 2π, and A = πr2 = π. (Remember that 12 = 1 and 1π = π.)
In the last row, C = π. Since C = πd, d = 1, r = = , and. A = πr2 = π =
=  π =
π =  .
.
With more practice, you’ll be able to fill out CArd nearly instantaneously. Therefore, it can be a good habit to fill it out as routine anytime you’re given one piece of CArd. You won’t always need all four pieces. However, it will often take longer to figure which pieces you need than it will take you to figure out all four pieces. CArd can actually be a time-saver in the long run!
Many objects, such as basketballs and baseballs, are spherical.
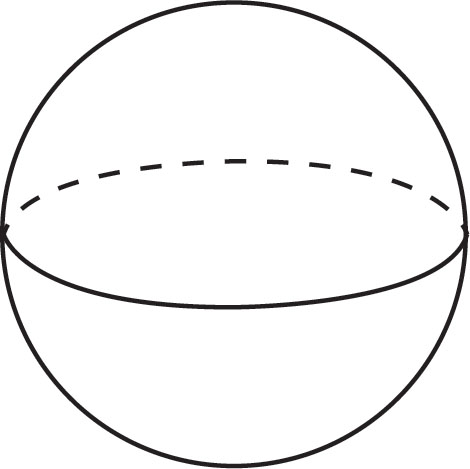
A sphere has a radius, r, and a diameter just like a circle. To find the volume of a sphere, use this formula (which is also provided on the formula page when you take the GED® test):
V =  πr2
πr2
To find the surface area of a sphere, use
SA = 4πr2
You need only the radius in order to find both the volume and the surface area.
A cylinder is essentially a circle with depth. Take a look at the following figure:

To find the volume of any cylinder, you must multiply the area of the circle at one end of the cylinder by its height. The formula for the area of a circle is πr2. So the volume of a cylinder is πr2h. Thus, the volume of the cylinder in the figure above is π32(4), or 36π.
The surface area of a cylinder can be found by taking 2πrh + 2πr2. In the example above, the surface area would be 42π.
Again, all of these equations are provided to you on the formulas page when you take the test.
A cone has a circular base that has a radius, r. The height, h, is measured from the center of the circle to the tip of the cone.
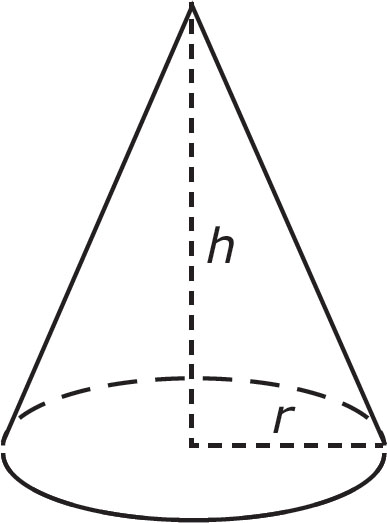
The volume of a cone can be found by taking
V = πr2h
And the formula for surface area looks like
SA = πrs + πr2
where s is the slant height, or the length from the outer edge of the base to the tip of the cone.
You can check your answers in Part VIII: Answer Key to Drills.
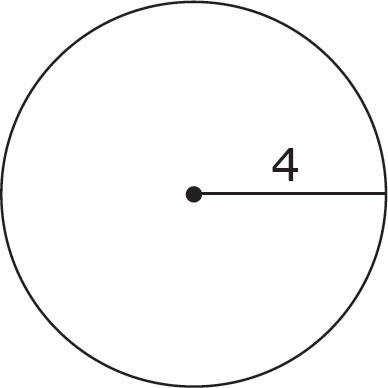
Using the figure above, answer the following questions.
1. What is the radius of this circle?
2. What is the diameter?
3. What is the circumference of this circle?
4. What is the area of this circle?
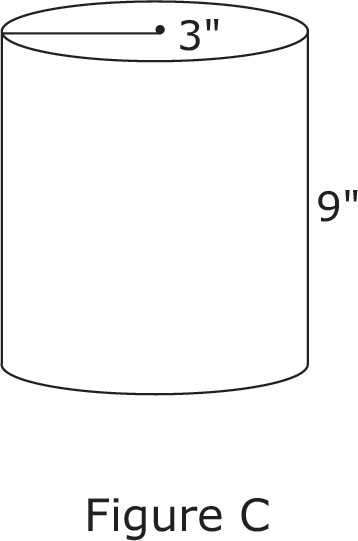
5. The cylindrical box in Figure C is 9 inches tall. If the radius of the cylinder is 3 inches, what is the maximum volume that can fit in the box?
6. The diameter of a rubber ball is 4 inches. What is the total surface area of the ball?
A. 16π
B. 64π
C. 128π
D. 144π
7. If a cone has a volume of 100π and a circular base with an area of 25π, what is its height?
A. 4
B. 8
C. 12
D. 24
8. A sphere has a volume of 36π, what is the length of the diameter?
A. 3
B. 6
C. 9
D. 12
A few GED® problems will ask you to set up a geometry problem but then not solve it. Just like the setup problems we saw in the “Applied Arithmetic” chapter—which tested the same arithmetic concepts as all the other arithmetic problems—setup geometry tests the same concepts as regular geometry. Here’s an example of a setup problem:
1. The dimensions of a rectangular box are 3 inches wide by 4 inches long by 2 inches deep. Which of the following expressions represents the volume (in cubic inches) of the box?
A. 3(2)(4)
B. 3 + 2 + 4
C. 3(2) + 4
D. 3(4) + 2
Here’s How to Crack It
Essentially, this is almost exactly the same problem you just saw before. The key words again are volume and rectangular. The only real difference is that this time the question does not ask you to find the volume, but to set up the work involved in finding the volume.
As we said in the “Applied Arithmetic” chapter, take your time with these problems. It’s easy to pick an answer choice that is almost (but not quite) right. You need to multiply length by width by depth. In this problem, that means 4 × 3 × 2. The correct answer is (A).
Graphing is a way of representing a point in two dimensions on what is known as a Cartesian grid or coordinate plane. This may sound intimidating, but it’s actually pretty simple. Here’s a Cartesian grid:
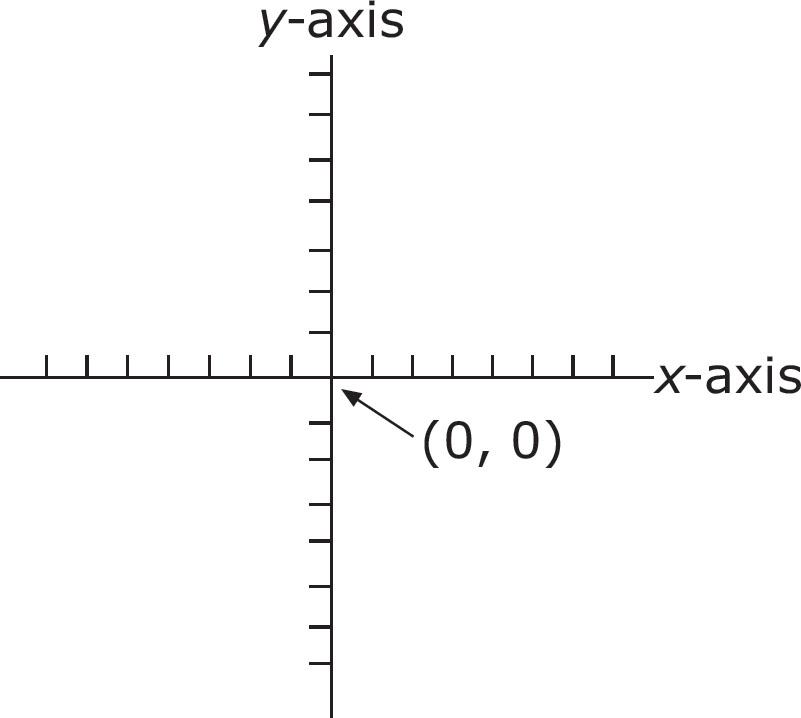
Graphing is a way of assigning points to this grid. Both the x-axis and the y-axis are number lines (as we discussed in Chapter 13) with positive and negative sides. These number lines cross at their zeros. Every point has two numbers assigned to it: an x-coordinate and a y-coordinate. Let’s take the point A (3, 1). The first number is considered the x-coordinate. The second number is the y-coordinate. To plot this point on the graph, we start at (0, 0) and count over three to the right (the positive side) on the x-axis, and then count one up (the positive side of the y-axis). To find point B (5, 4), we count over five places to the right on the x-axis and then up four places.
Try plotting these two points on the graph above. Then, check your work by looking at the graph below.
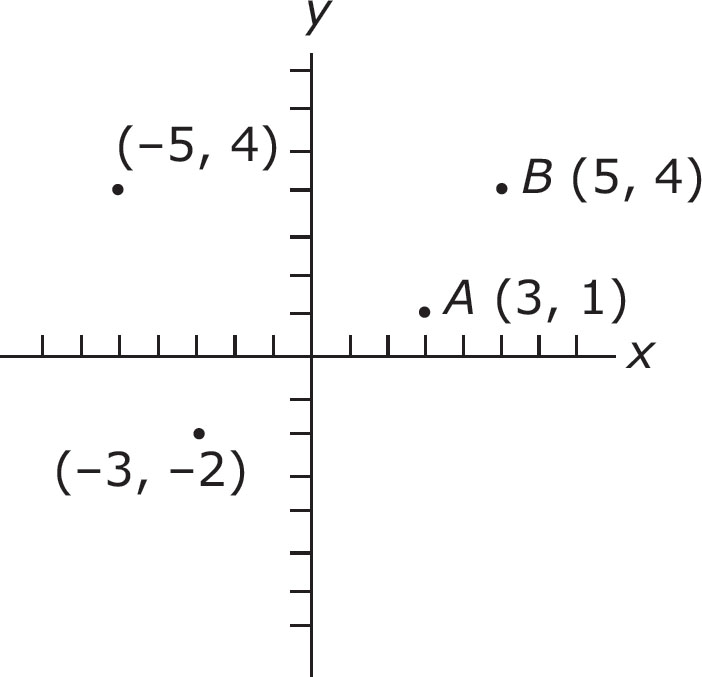
If the first number in an (x, y) point (in other words, the x-coordinate) is negative, then to graph this point, you count to the left along the x-axis. If the second number in an (x, y) point (in other words, the y-coordinate) is negative, then you count downward. Look at the graph above and see how points (–5, 4) and (–3, –2) were plotted.
GED® questions about graphing are fairly rare. There are three types of GED® graphing questions: questions in which you graph a point on the coordinate plane, questions about the slope of a line, and questions about the distance between two points.
The slope of a line tells you how sharply a line is inclining. To find the slope, you need to know two points anywhere on the line. The slope formula (which always appears on the formula page of the Mathematical Reasoning test) looks like this:
Slope = 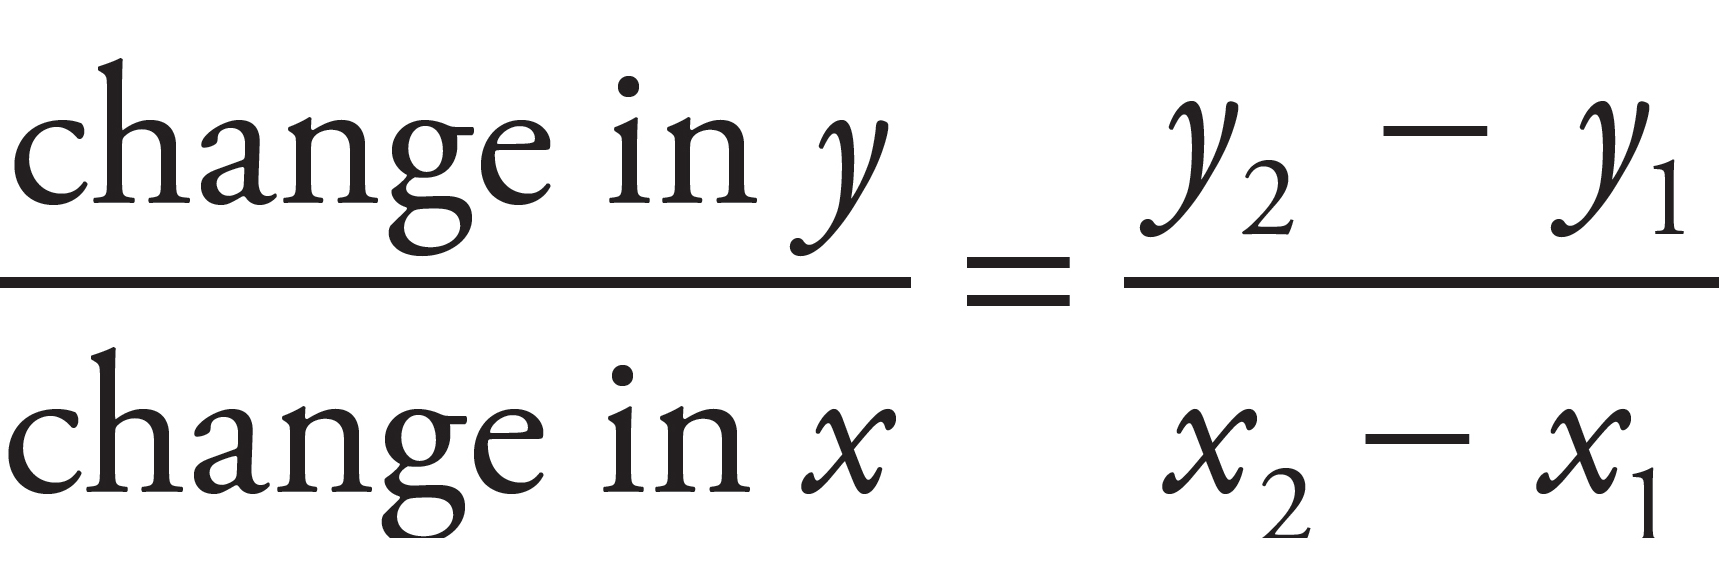
For example, to find the slope of a line that went through points (5, 6) and (3, 2), all you have to do is subtract one y-coordinate from the other (the result of this subtraction becomes your numerator—also sometimes known as the rise) and subtract one x-coordinate from the other (the result of this subtraction becomes your denominator—also known as the run):
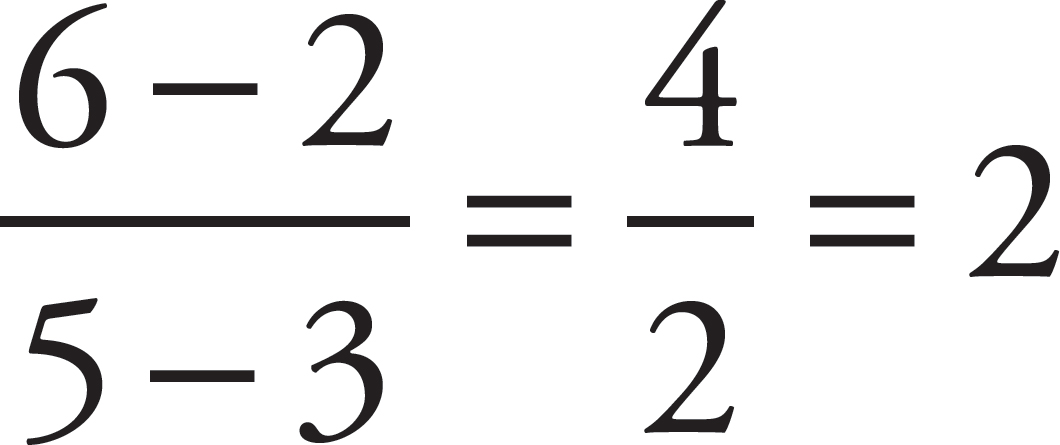
Therefore, the slope of the line that goes through points (5, 6) and (3, 2) is 2.
To find the distance between two points on a Cartesian grid, there is a long formula that we think is one equation you shouldn’t bother to memorize. It’s too complicated, it comes up too rarely on the test, and besides, it’s printed on the formula page of the test.
Just for practice, here it is:
Distance between two points = 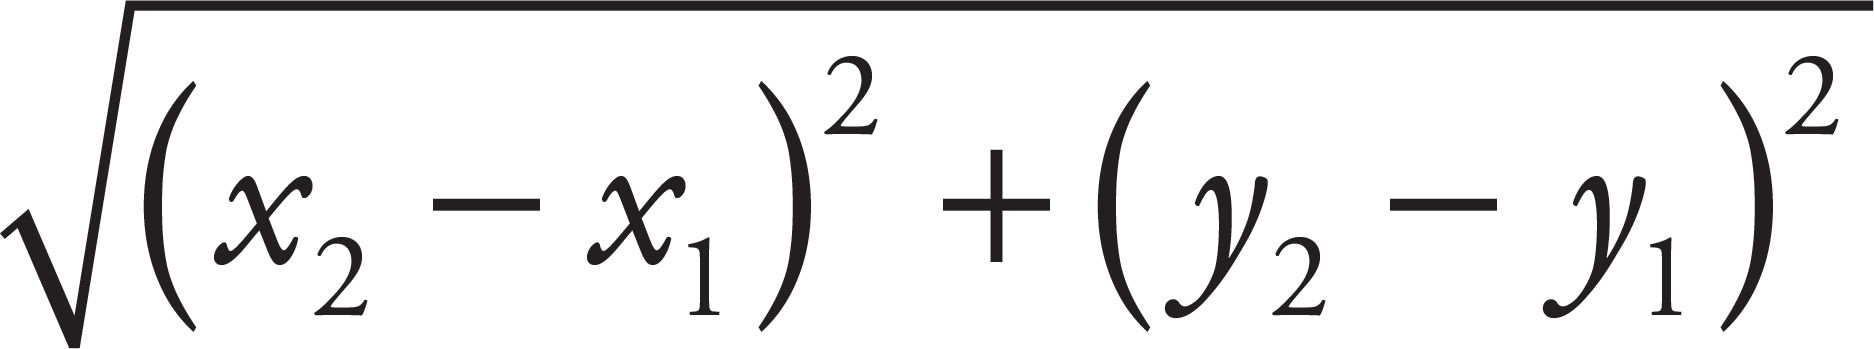
where (x1, y1) and (x2, y2) are two points in a plane.
Let’s find the distance between points (1, 2) and (5, 6). What we have to do is carefully plug these numbers into that long equation. Here’s what it should look like:

You can see why this doesn’t come up often.
Most of the graphing problems on the Mathematical Reasoning test concerning slope or distance will actually give you a graph to look at. This can be very helpful in Ballparking your answers. Take a look at the following question:
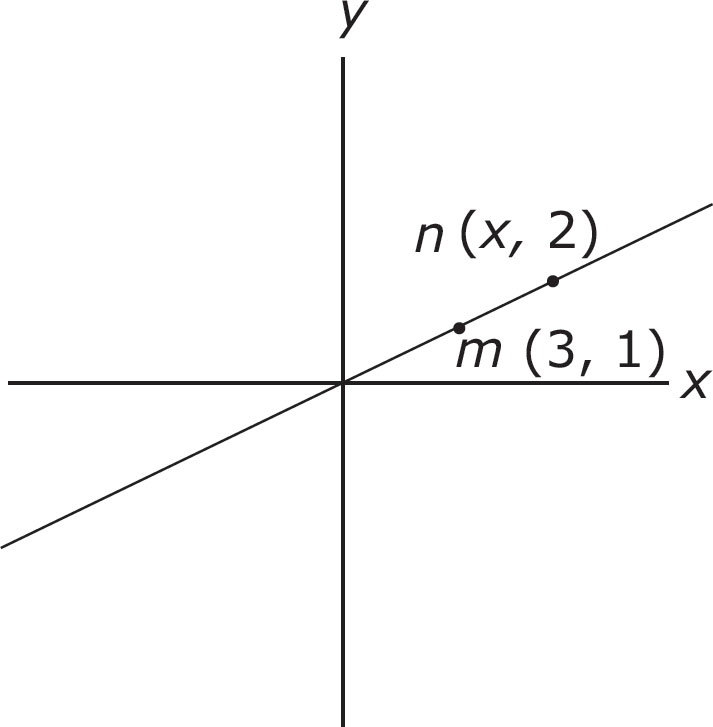
1. In the graph shown above, what is the x-coordinate of point n if the slope of the line mn is  ?
?
A. 9
B. 6
C. 3
D. 2
Here’s How to Crack It
First, let’s get an idea of which answer choices are out of the ballpark. We are looking for the x-coordinate of point n. Well, before we start using complicated formulas, let’s do a little measuring. The x-coordinate for point m is 3. This means that the horizontal distance from 0 to m is 3. Mark off this distance on your scratch paper. Now, try measuring the horizontal distance between 0 and point n. Did you get about 6? That’s what we got. Because these figures are drawn only roughly to scale, we can’t guarantee that the answer is going to be exactly 6, but it ought to be close to 6 anyway. So which answer choices can we get rid of? Choices (A), (C), and (D) are all out of the ballpark. The only possible answer this time is (B).
If you needed to get this one the traditional way, you would have to use the slope formula backward.

The correct answer is (B).
You can check your answers in Part VIII: Answer Key to Drills.
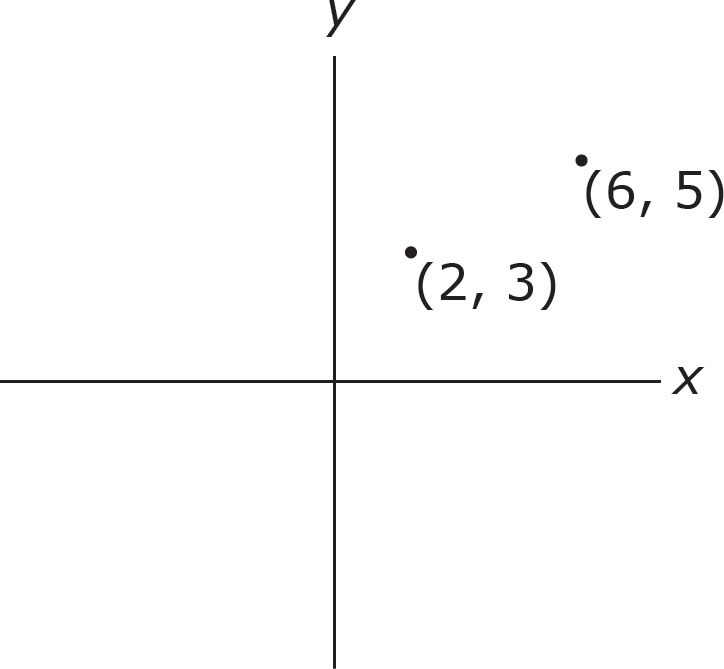
1. A line passes through the points (6, 5) and (2, 3). What is the slope of this line?
A. – 
B. 
C. 
D. 3
2. What is the distance between points (5, 0) and (12, 0) on the coordinate plane?
A. 12
B. 9
C. 7
D. 4
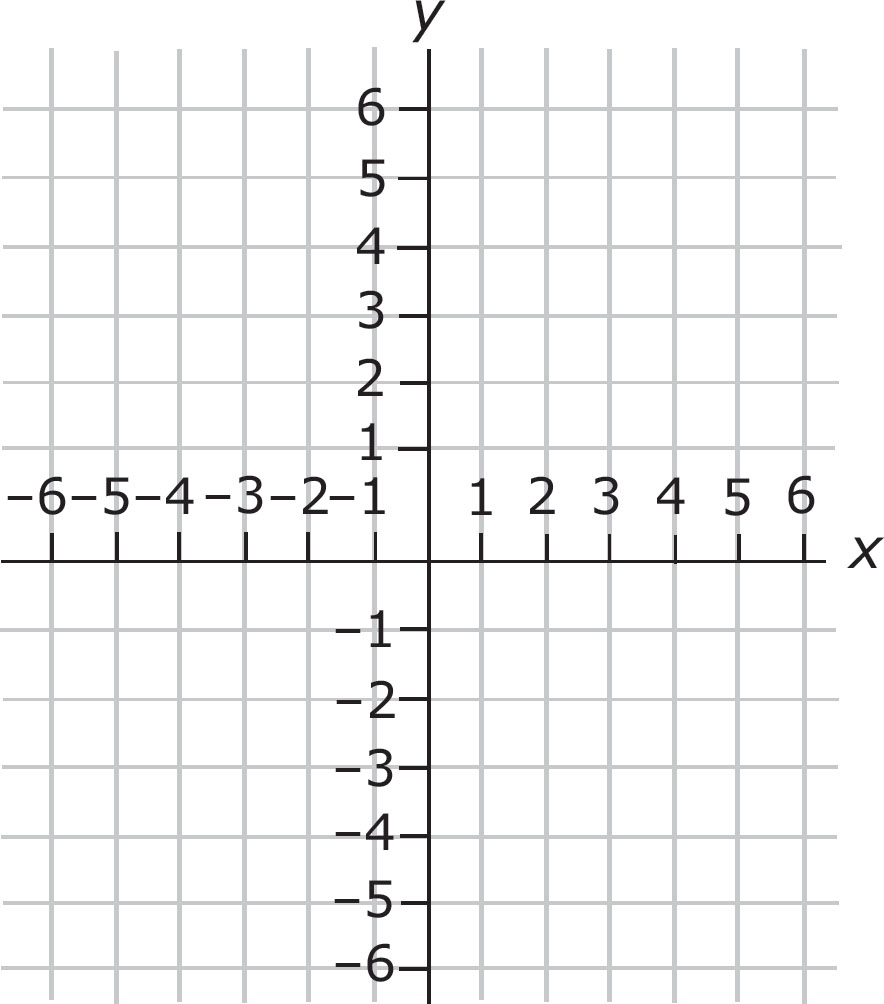
3. On the graph below, plot the following points: Point A (–3, –4), Point B (2, 3), and Point C (3, 5).
Sometimes the GED® test writers will give you an equation with two variables and ask you to graph a line representing the equation. The key is to get the equation into slope-intercept form
y = mx + b
in which m represents the slope and b represents the y-intercept. The y-intercept is the y-coordinate of the point on the line that crosses the y-axis and has an x-coordinate of 0.
If you need to sketch a graph of the equation y = 2x + 3, start out with the y-intercept, 3. Since the y-intercept is 3, the graph includes the point (0, 3). Plot this on the graph as below.

The slope is 2, so the y-coordinate increases by 2 as the x-coordinate increases by 1. Use this to plot additional points. Start with point (0, 3) and increase the x-coordinate by 1 and y-coordinate by 2 to get (1, 5). Do this again to get (2, 7) and (3, 9). Similarly, you can go backward. Go back to the point (0, 3) and decrease the x-coordinate by 1 and the y-coordinate by 2 to get (–1, 1) and again to get (–2, –1) and (–3, –3). Plot these points as well.
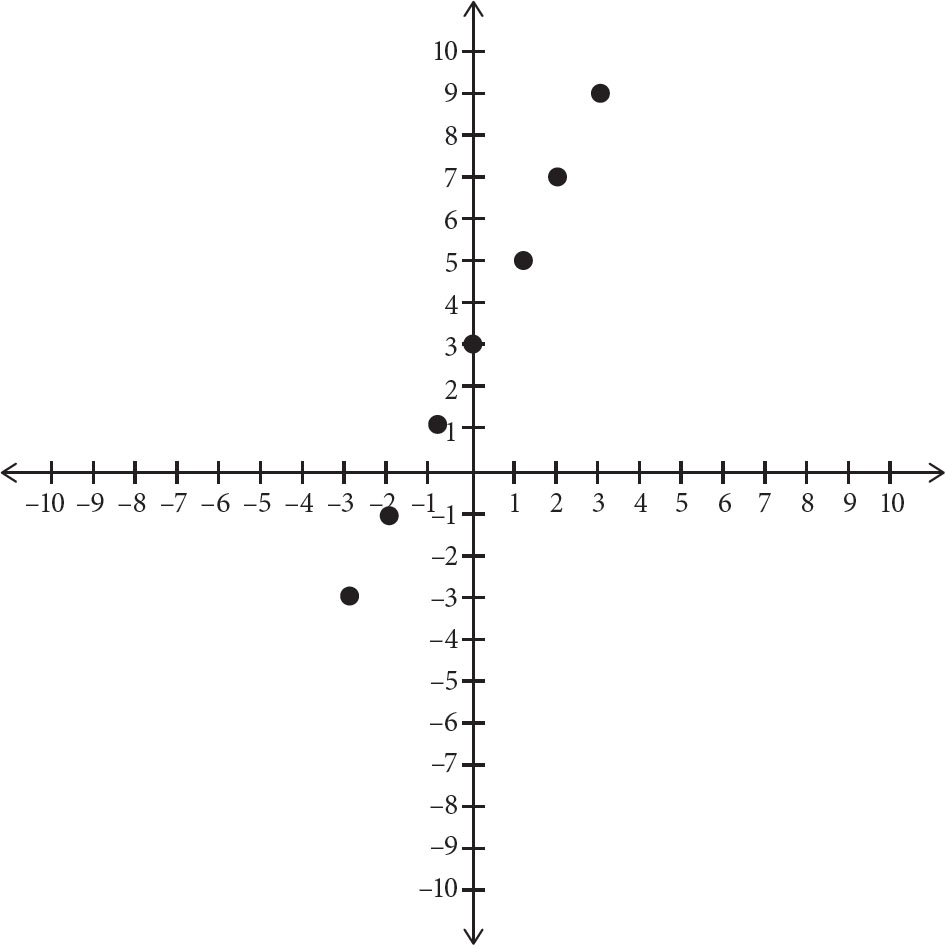
Finally, draw a line that goes through all these points as below.
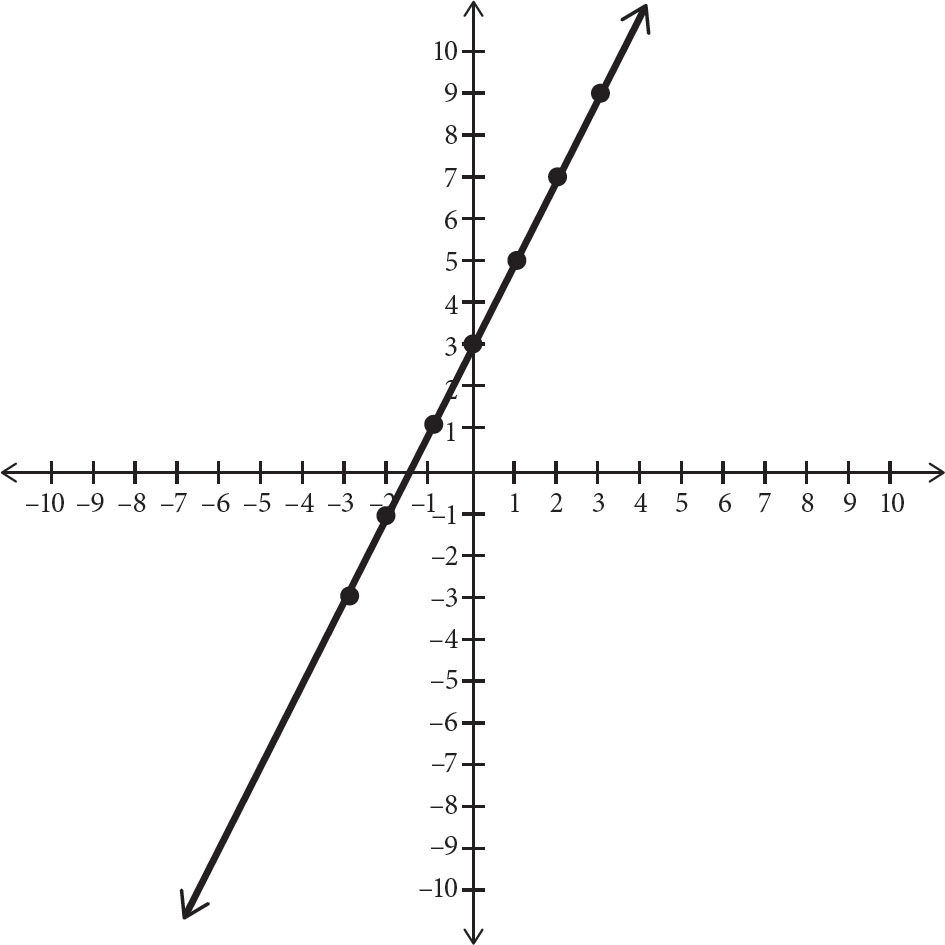
This line is a graphical representation of the equation. Try another one.
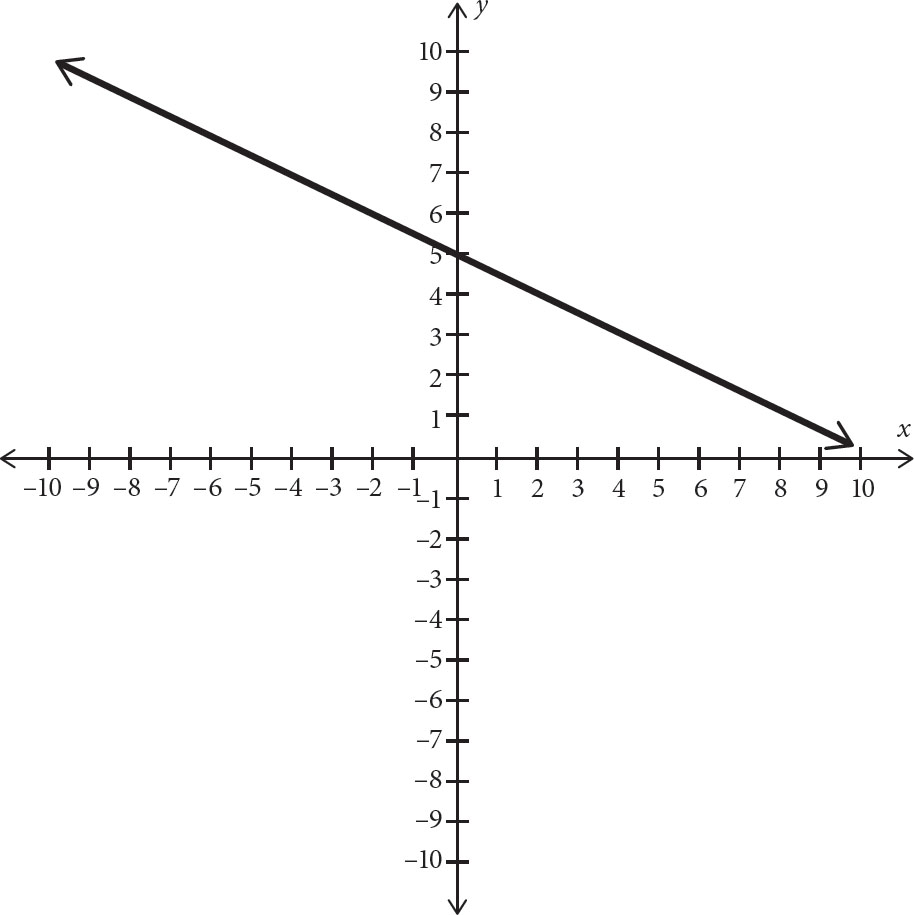
1. Which of the following represents the graph of the line 2x + 3y = 6?
A. 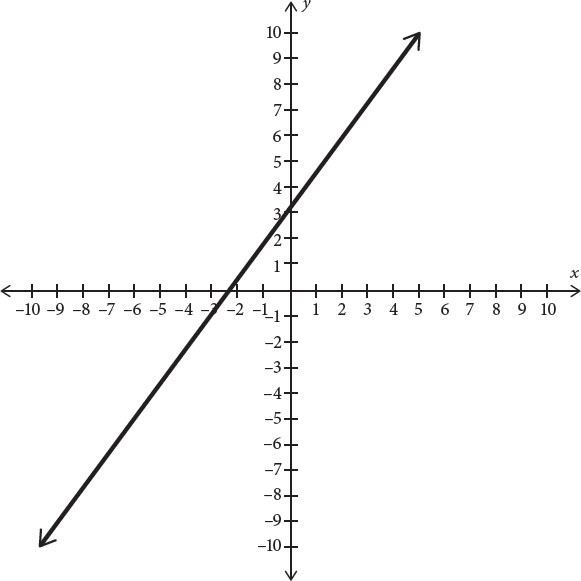
B. 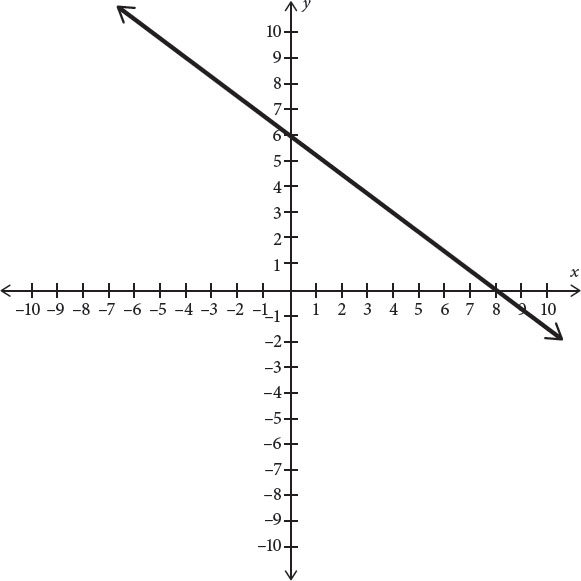
C. 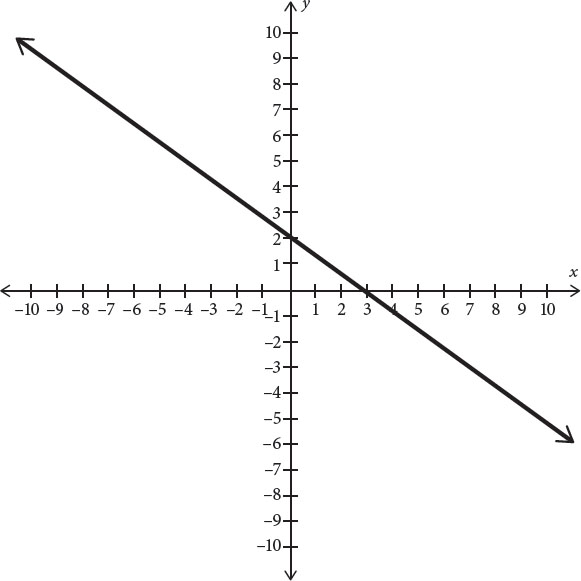
D. 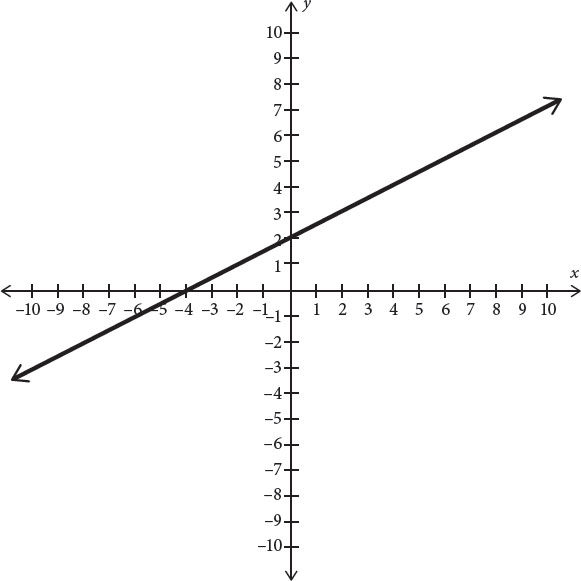
Here’s How to Crack It
First, get the equation into y = mx + b form. Take the given equation, 2x + 3y = 6 and isolate y. First subtract 2x from both sides to get 3y = –2x + 6. Now divide both sides by 3 to get y = − x + 2. This equation has y-intercept 2, so eliminate (B). The equation also has a negative slope, meaning that the graph has to decrease as it goes from left to right. Eliminate (D). Now, since the slope is −, the y-coordinate has to decrease by 3 as the x-coordinate increases by 2. Eliminate (A). The correct answer is (C).
Now try another one.
1. If 3x + 6y = 30 and 2x + 5y = 26, choose two numbers below that are possible values of x and y.
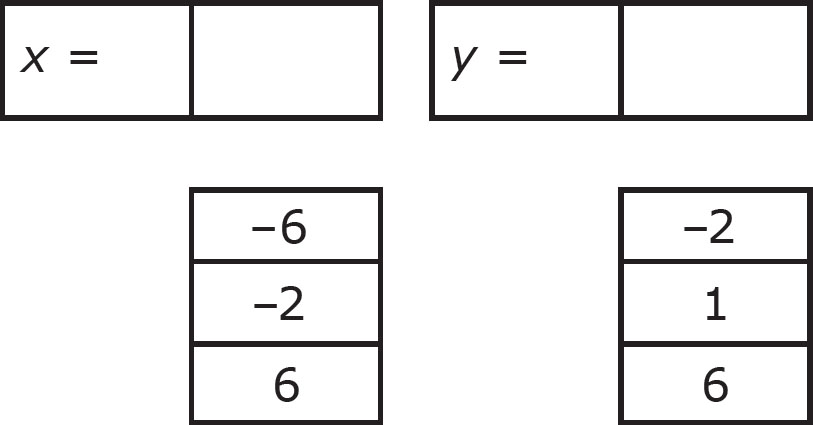
Here’s How to Crack It
If this problem looks familiar, it’s because you solved it in the previous chapter. Last chapter, you solved it using the linear combination method. This time, you’ll solve it graphically. Graph one equation at a time. Start with 3x + 6y = 30. Get this into slope-intercept form. Subtract 3x from both sides; then divide both sides by 6 to get y = −x + 5. This graph has a y-intercept of 5 and a slope of −. Graph this as follows.
Now sketch the graph of the other line in the same axes. Take 2x + 5y = 26, subtract 2x from both sides, and then divide both sides by 5 to get y = − x +
x +  . Therefore, this graph has a slope of − and a y-intercept of = 5.2. Graph this to get the following:
Look to see where the lines intersect. This appears to be at the point (–2, 6). Therefore, x = –2 and y = 6.
Some GED® questions will ask you to determine the equation of a line. You know the slope-intercept form of a line equation, y = mx + b. Therefore, if given the slope and the y-intercept, you can plug the slope in form m and the y-intercept for b and get the equation of a line. For example, suppose you were told that a line had a slope of 3 and contained the point (0, –2). You’re given slope, so you can plug this value in for m and get y = 3x + b. But what about the y-intercept? Since the y-intercept is the point on the line for which the x-coordinate is 0, the y-intercept of this line must be –2. Therefore, the equation of this line would have to be y = 3x –2. What if they gave you the slope and a point other than the y-intercept? Let’s look at an example below.
1. What is the equation of a line that goes through the point (1, 3) and has a slope of –2?
A. y = 5x – 2
B. y = –2x + 3
C. y = –2x + 5
D. y = 3x + 2
Here’s How to Crack It
The equation of any line can be put into the form y = mx + b, with slope m and y-intercept b. Since the question tells you that the slope is –2, plug this in for m to get y = –2x + b. Therefore, you can eliminate (A) and (D), because they have the wrong slope. But what about the y-intercept? You don’t have the y-intercept, but you do have a point on the line, (1, 3). This means that you have one pair of values for x and y. Plug these into the equation to get 3 = –2(1) + b. Now, solve this equation for b. Multiply on the right side to get 3 = –2 + b. Now, add 2 to both sides to get 5 = b. Now, plug this into the original equation to get y = –2x + 5. The correct answer is (C).
Let’s look at another one.
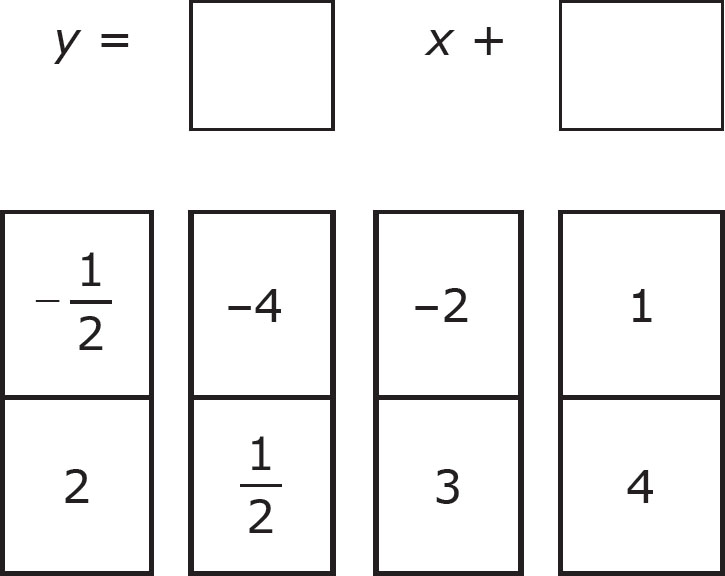
2. What is the equation of the line that goes through the points (–2, 5) and (8, 0)?
A. y = −x + 4
B. y = −x + 8
C. y = –2x + 4
D. y = –2x + 8
Here’s How to Crack It
Once again, the equation of any line can be put into the form y = mx + b, with slope m and y-intercept b. You are not given the slope and, while it may appear that you’re given the y-intercept, you’re given a point in which the y-coordinate is 0, so this is actually the x-intercept. However, you can determine both the slope and the y-intercept. Remember the slope formula, m = 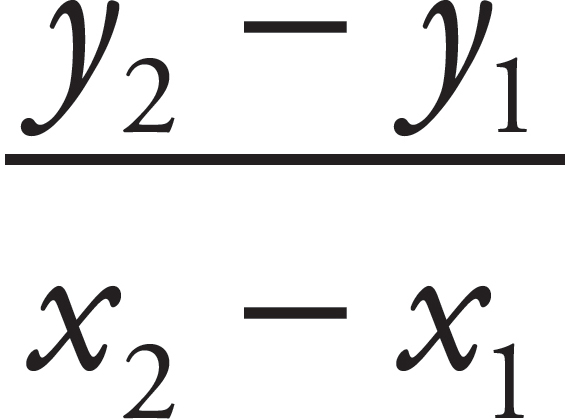 . Plug the points you’re given into this formula to get m =
 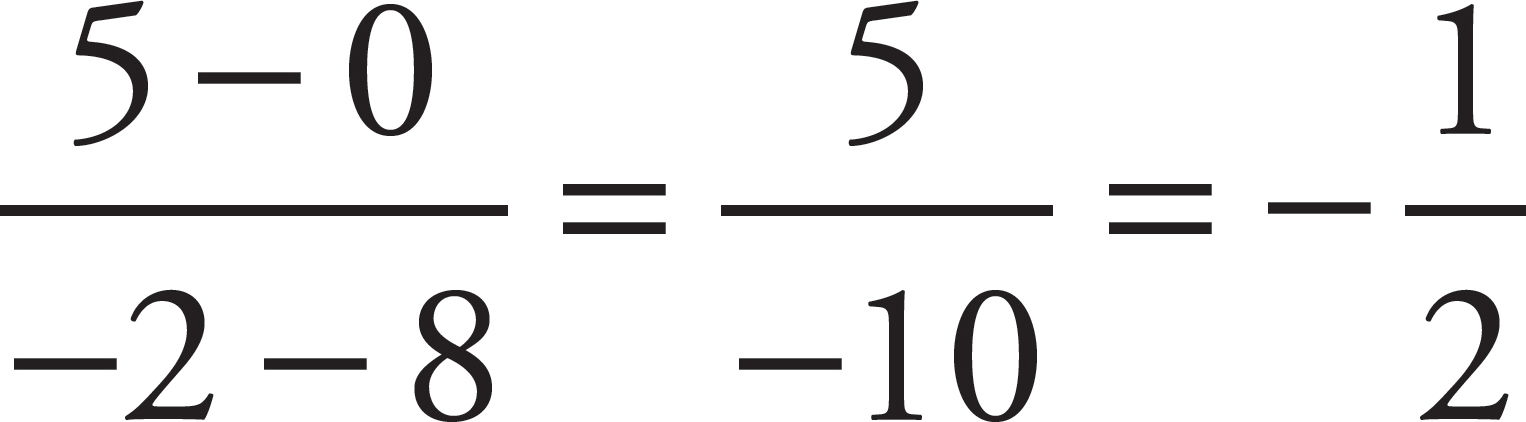 . Plug this into the slope-intercept form of the line to get y = −x + b. To get the value of b, plug in one of the points you’re given. Try (8, 0). Plugging in this point gives you 0 = −(8) + b. Multiply on the right side to get 0 = –4 + b. Add 4 to both sides to get 4 = b. Plug this into the equation to get y = −x + 4. The correct answer is (A).
Earlier in this chapter, we talked about parallel and perpendicular lines. In plane geometry, parallel means not intersecting, and perpendicular means intersecting at right angles. In coordinate geometry, this is also true, but parallel and perpendicular lines also have another interesting property relating to their equations. That’s right; if you know the equations of the two lines, you can determine whether they’re parallel and whether they’re perpendicular without even needing to look at the graph. Simply use the facts that the slopes of parallel lines are equal and the slopes of perpendicular lines are negative reciprocals. (A reciprocal is a fraction flipped upside down, so a negative reciprocal is a fraction flipped upside down and with its sign reversed. The negative reciprocal of  is −. The negative reciprocal of 8 is −
 .) Let’s look at an example.
1. Which of the following represents the equation of a line that is parallel to the line represented by the equation y = –3x + 1?
A. y = 2x + 1
B. y = –3x + 5
C. y = 3x + 1
D. y = x + 5
Here’s How to Crack It
The question asks for which line is parallel to the given line. Your instinct might be to sketch the graph, but in this question there is no need. Parallel lines have equal slopes. Since the given line and the answer choices are in the form, y = mx + b, m represents the slope. The slope of the original equation is –3. Find the equation in the answer choices with the same slope, i.e. the same value of m. This is the equation y = –3x + 5. The correct answer is (B).
Let’s look at another.
2. The line represented by the equation 3x + 6y = 4 is perpendicular to the line represented by which of the following equations?
A. –4x – 8y = –5
B. 3x + 2y = 4
C. 2x – y = –1
D. –3x + 6y = –4
Here’s How to Crack It
The slopes of perpendicular lines are negative reciprocals, which are any two numbers that have a product of –1 when multiplied together. However, neither the equation of the line given in the question nor those in the answer choices are in y = mx + b form. Put them in this form. Start with the equation in the question: 3x + 6y = 4. Subtract 3x from both sides to get 6y = –3x + 4. Now, divide both sides by 6 to get y = −x + . Now that this is in y = mx + b form, the slope is equal to m, which is −. The slope of the perpendicular line is the negative reciprocal of −, which is  , or 2. Now, do the same to the answer choices and stop when you find a line with a slope of 2. Choice (A) is –4x – 8y = –5. Add 4x to both sides to get –8y = 4x + 5. Divide both sides by –8 to get y = −x −
 . This is a possible trap answer since it is parallel to the line in the question. However, it is not perpendicular, so eliminate (A). Choice (B) is 3x + 2y = 4. Subtract 3x from both sides to get 2y = –3x + 4. Divide both sides by 2 to get y = −
 x + 2. The slope is not 2, so eliminate (B). Choice (C) is 2x – y = –1. Subtract 2x from both sides to get –y = –2x – 1. Divide both sides by –1 to get y = 2x + 1. Since the slope of this line is 2, the correct answer is (C).
You can check your answers in Part VIII: Answer Key to Drills.
1. Which of the following is the equation of a line through the point (0, –2) with a slope of 4?
A. y = 4x – 2
B. y = 4x + 4
C. y = –2x – 2
D. y = –2x + 4
2. A line goes through the points (2, 2) and (–4, –1). Show below a possible equation for the line.
3. Of the equations below, which best represents a line with a slope of –2 that goes through the point (–1, 3)?
A. y = –2x + 3
B. y = 3x – 1
C. y = –2x + 1
D. y = 3x + 1
4. What is true of the lines represented by the equations 2x + 8y = –5 and 3x + 12y = 8?
A. They are parallel.
B. They are perpendicular.
C. They have the same x-intercept.
D. They have the same y-intercept.

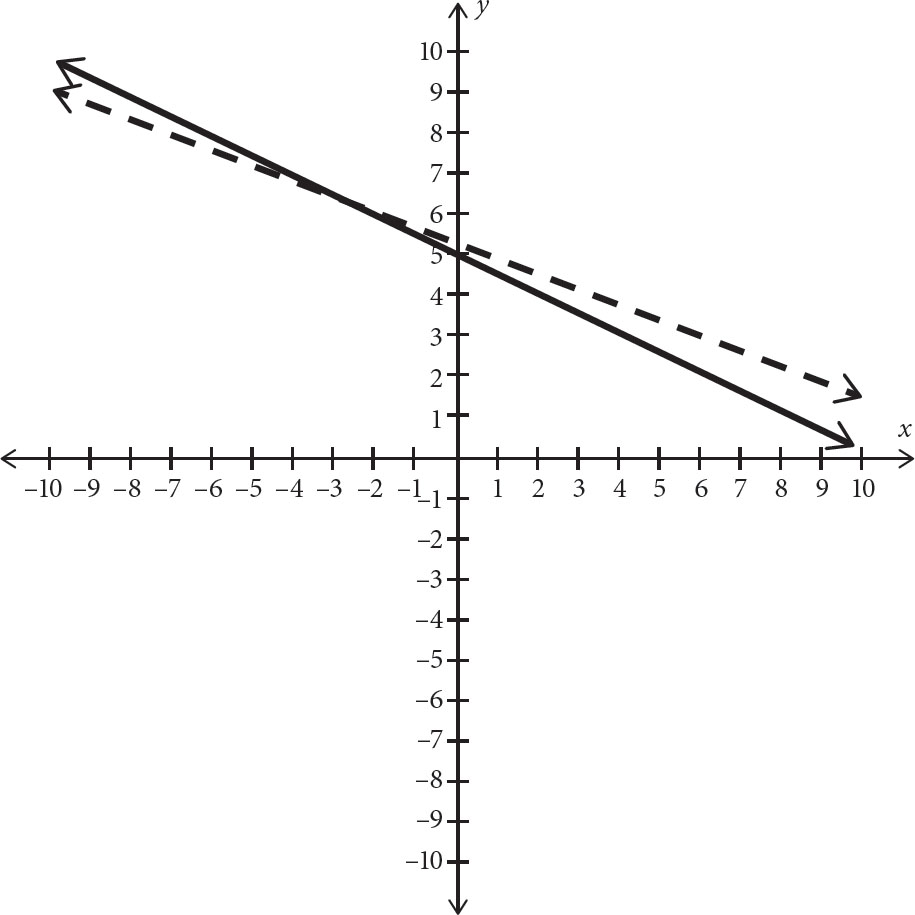
5. On the graph above, select the points on the line represented by the equation y = –2x + 4.
In Chapter 14, we talked about ratios and proportions. Proportions can also be described as linear graphs through the origin. Remember that equations of lines can be expressed in the form y = mx + b. Since lines representing proportions go through the origin, the y-intercept, and therefore b is 0, so these lines can be expressed by the equation y = mx. In graphical terms, m represents the slope. In proportional terms, m represents the rate. Let’s look at an example.

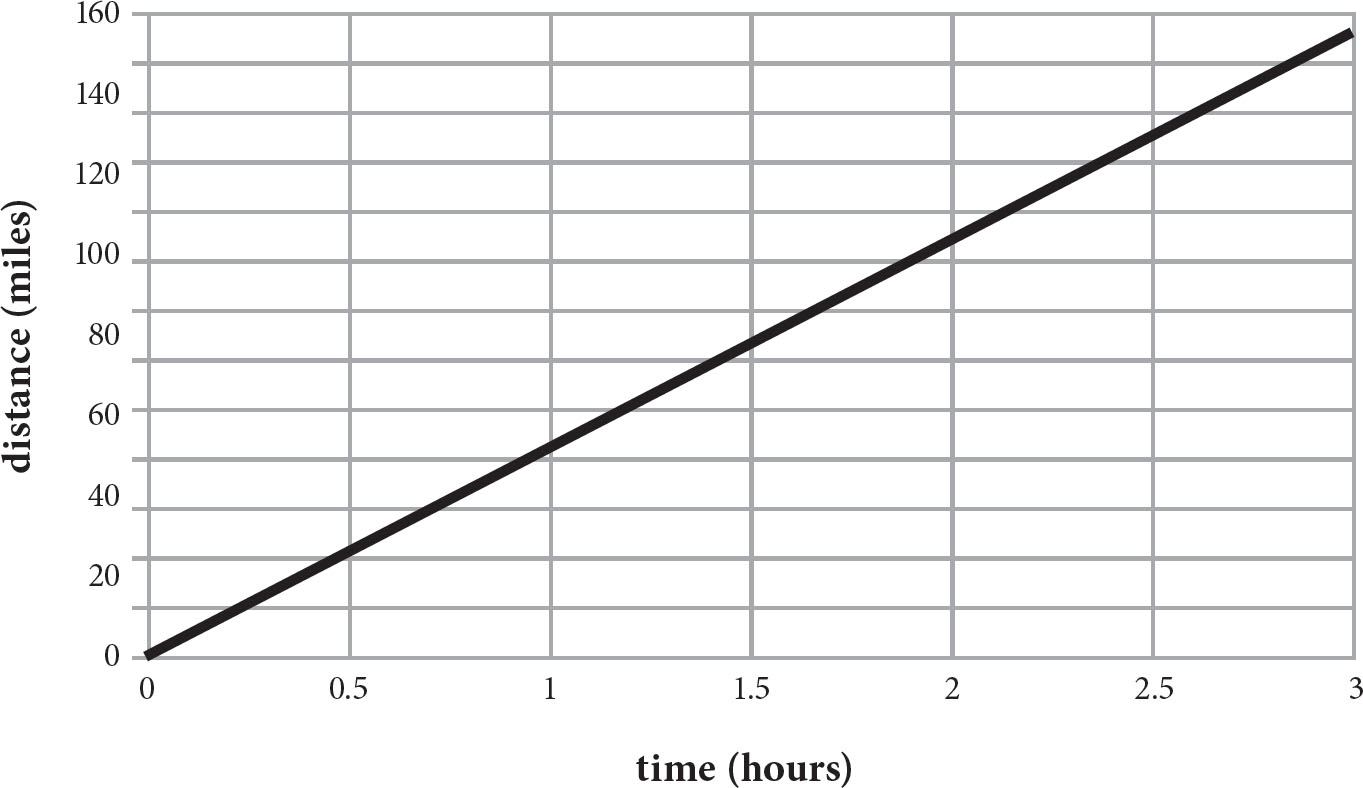
1. The graph above represents the distance traveled by a car driving at a constant speed. Which of the following is the constant speed?
A. 10 mph
B. 15 mph
C. 30 mph
D. 45 mph
Here’s How to Crack It
Remember that the rate, in this case speed, is always equal to the slope of the line. To determine the slope, find two points on the line. To make this as easy as possible, make one of those points the origin (0, 0). Choose another point, say (1, 30). Then, the slope, i.e. the speed, is 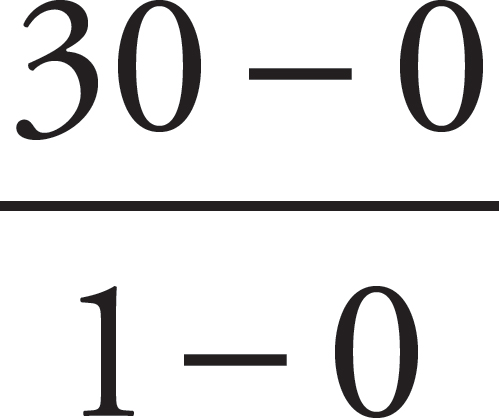 = 30. The correct answer is (C).
Let’s look at another example.
2. During a certain week, a company hires a constant number of new employees each day, and no one leaves the company. On Tuesday of that week, the company has 400 employees. On Friday of that week, the company has 550 employees. If the total number of employees the company has each day were to be graphed as a line, what would be the slope of that graph?
A. 25
B. 50
C. 100
D. 150
Here’s How to Crack It
The slope of the graph is the rate of increase. Look at the data given. On Tuesday, there were 400 employees, and on Friday, there were 550. Therefore, over the course of 3 days, the number of employees increased by 150. The rate of increase, therefore, is 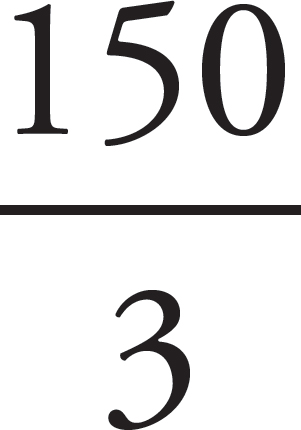 = 50. The correct answer is (B).
You can check your answers in Part VIII: Answer Key to Drills.
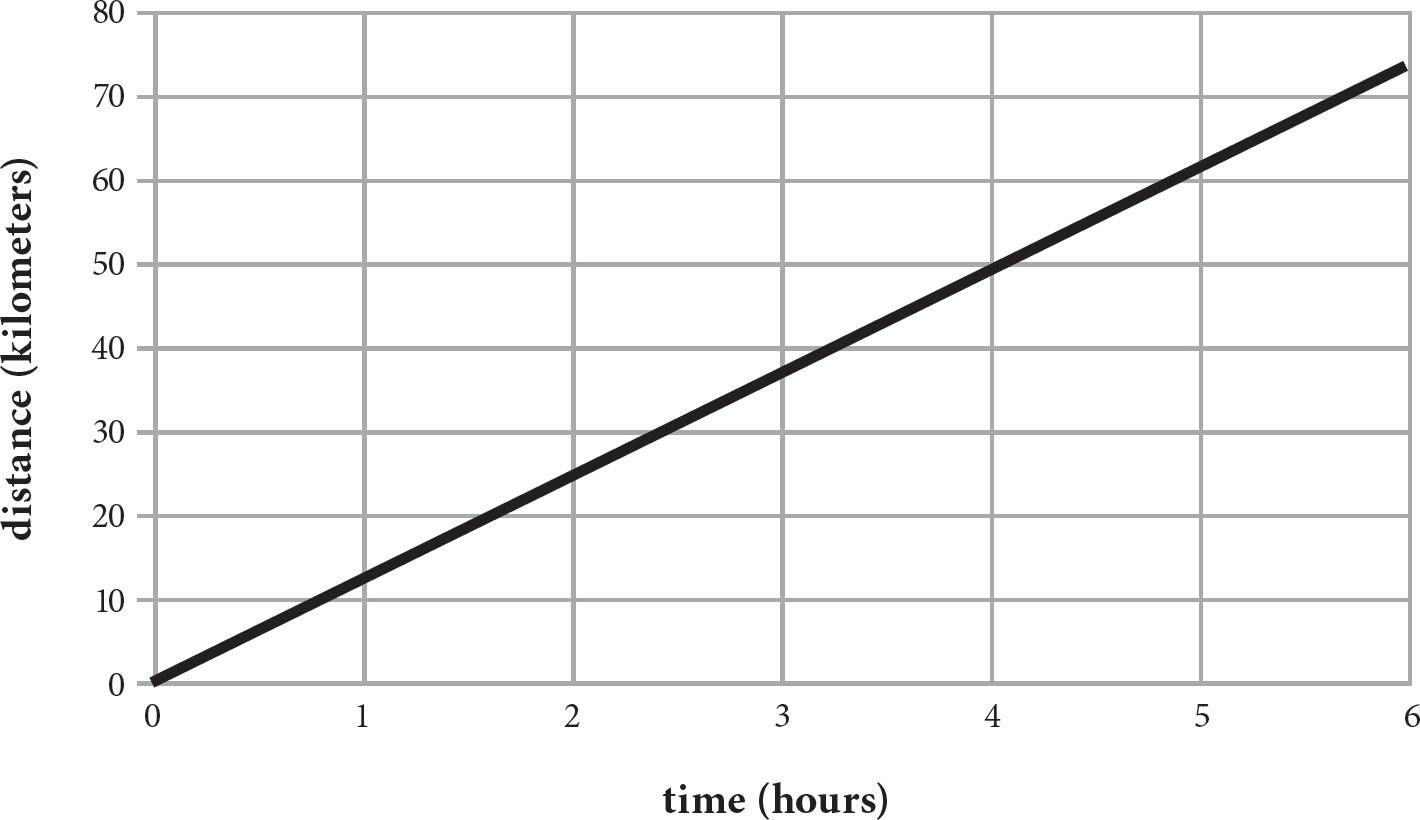
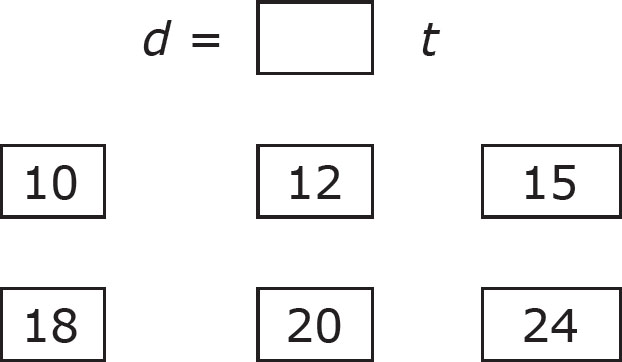
1. Elizabeth rides her bike over a period of 6 hours and records the distance she travelled in the graph above. If d represents her distance travelled in kilometers and t represents time, in hours, from the beginning of her trip, select the value that completes the equation below.
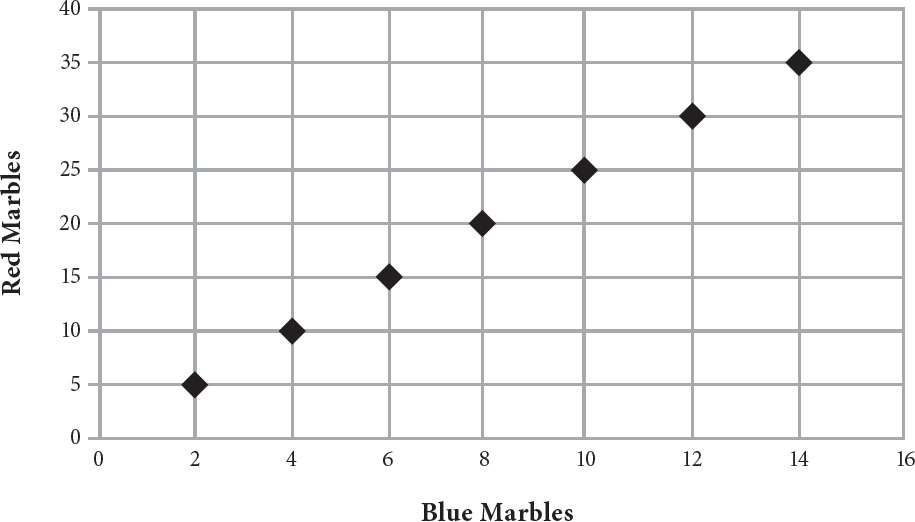
2. A certain toy store sells marbles only in boxes that contain 2 red marbles and 5 blue marbles. Which of the following plots the possible number of red marbles and blue marbles a customer can buy?
A.
B.
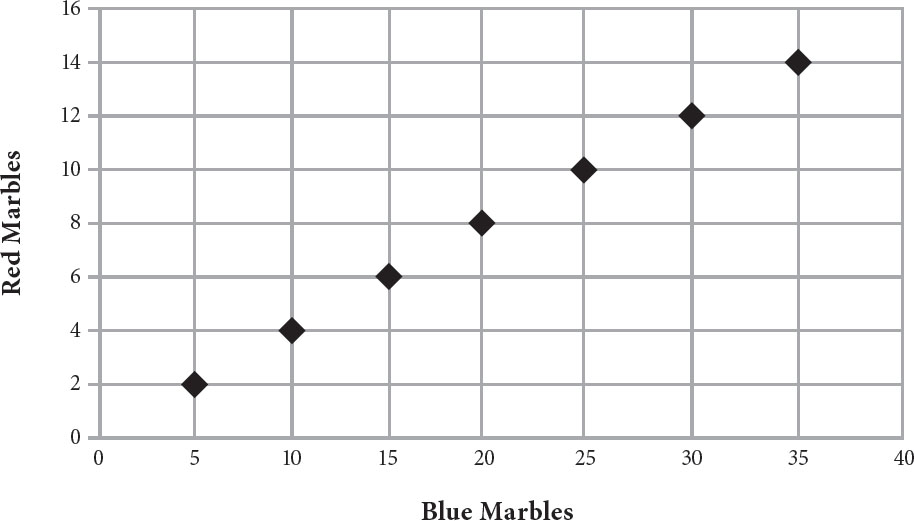
C.
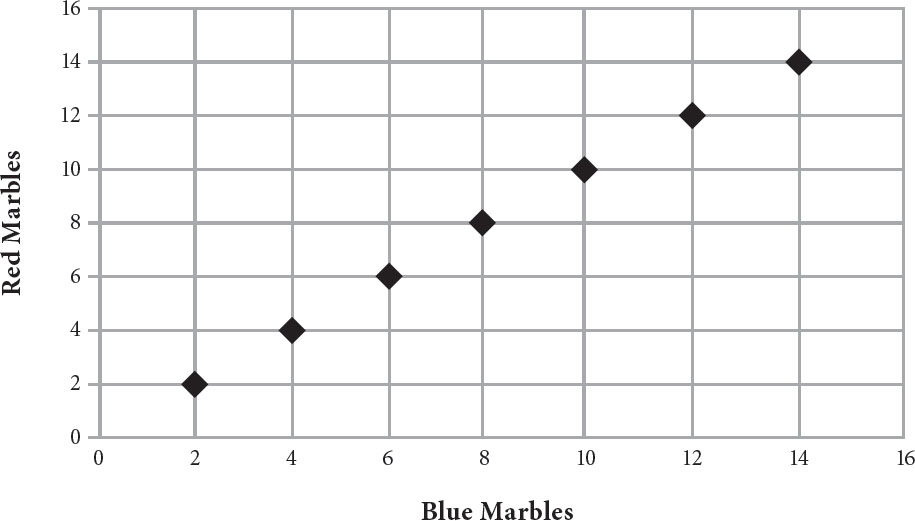
D.

3. Lisa and Frank are both driving on a highway at different constant speeds. Lisa’s driving is expressed by the graph above. Frank’s driving is expressed by the equation d = 40t. Lisa’s speed is  Frank’s speed.
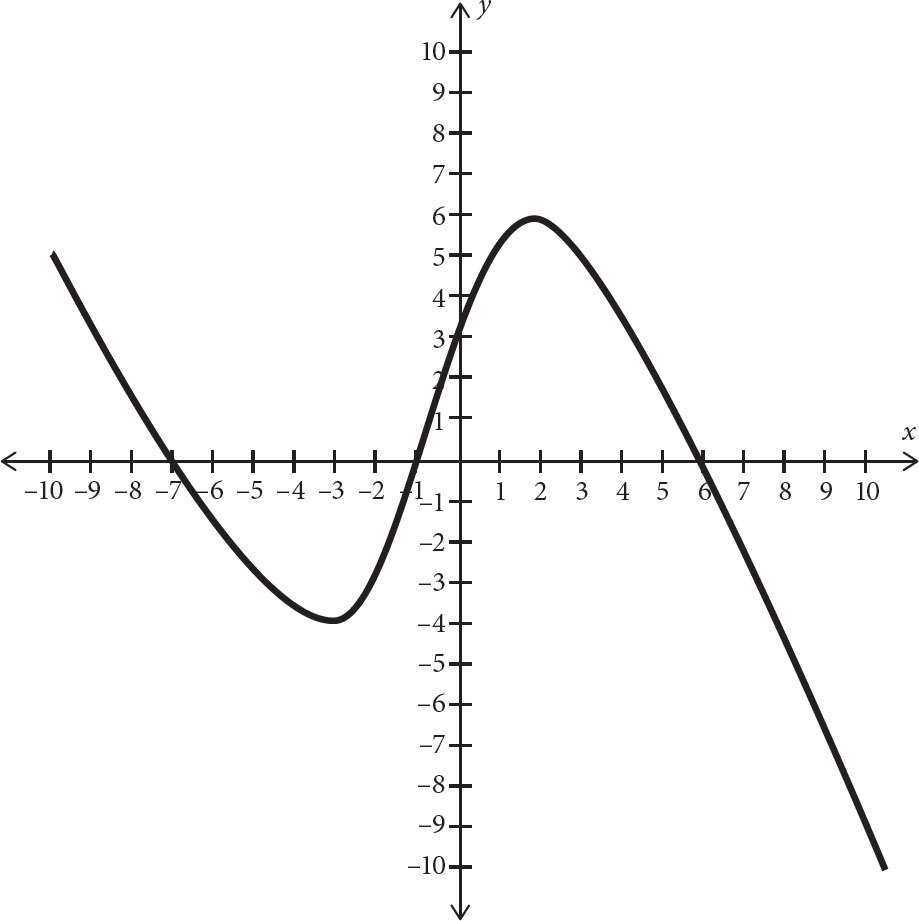
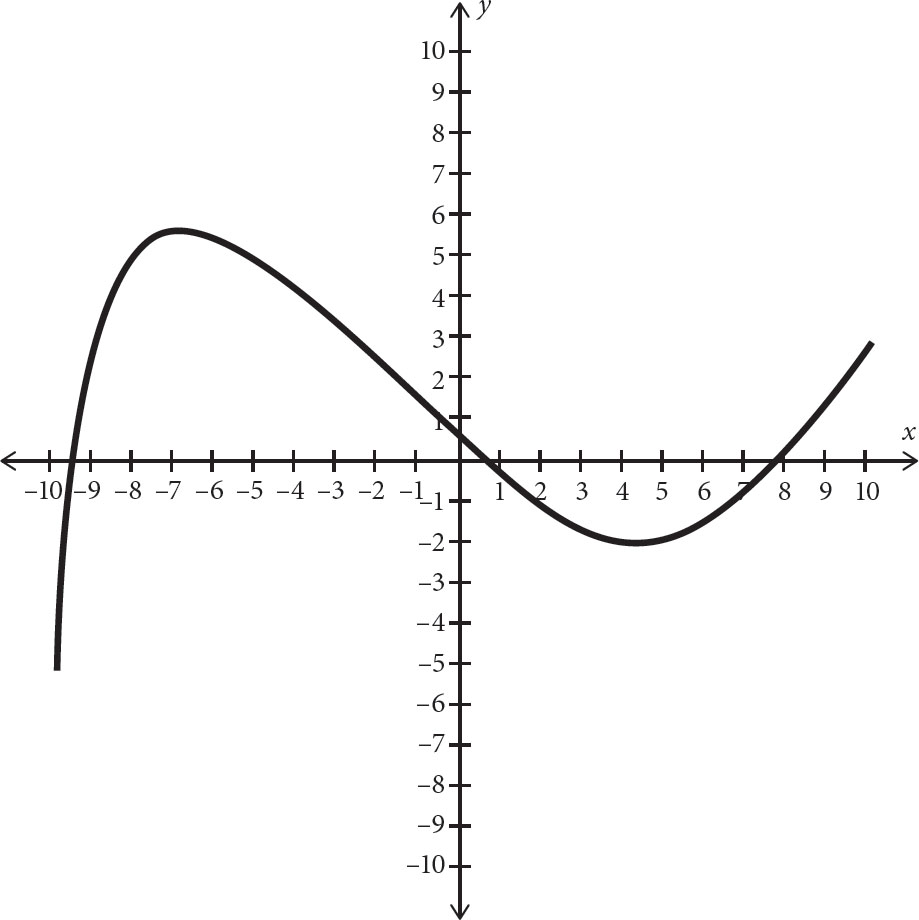
Some graph questions will require you to determine certain elements of the graphs. Look at the graph below.

Let’s identify some key elements. Start with the x- and y-intercepts, i.e., where the graph crosses the x-axis and y-axis, respectively. A graph, particularly a nonlinear graph, may have multiple x-intercepts. Where does the graph cross the x-axis? It crosses at three points: (–9, 0), (–2, 0), and (4, 0). Therefore, these are the x-intercepts. If a graph is of a function, it can have only one y-intercept (otherwise it would fail the vertical line test). Where does this graph cross the y-axis? It crosses it about halfway between the hashmarks for –3 and –4, so the y-intercept is about (0, –3.5).
Now determine where this graph is positive and negative. A graph is negative when it is below the x-axis and positive when it is above the x-axis. Use the x-intercepts to your advantage. The x-intercepts are –9, –2, and 4. To the left of the –9, the graph is below the x-axis, meaning that it is negative. Between –9 and –2, the graph is above the x-axis, meaning that it is positive. Between –2 and 4, the graph is below the x-axis, meaning that it is negative. To the right of 4, the graph is above the x-axis, meaning that it is positive. Therefore, the graph is negative at –2 < x < 4 and 4 < x < 10 and positive at –9 < x < –2 and 4 < x < 10.
Now determine relative maximums and minimums. These are points for which the y-coordinate is either greater or less than all the surrounding points. Look for peaks and valleys in the graph. The graph reaches peaks at about (–6.5, 7.5) and at about (7.5, 8). These are the relative maximums. The graph reaches a valley at (1.5, –4.5). This is the relative minimum.
Now determine where the graph is increasing and decreasing. Use the relative maximums and minimums. The graph is increasing to the left of its relative minimum at x = –6.5. Then, it decreases to its relative minimum at x = 1.5. Then, it increases to its other relative maximum at x = 7.5. Then, it decreases to the right of this point. Therefore it increases from –10 < x < –6.5 and 1.5 < x < 7.5 and decreases from –6.5 < x < 1.5 and 7.5 < x < 10.
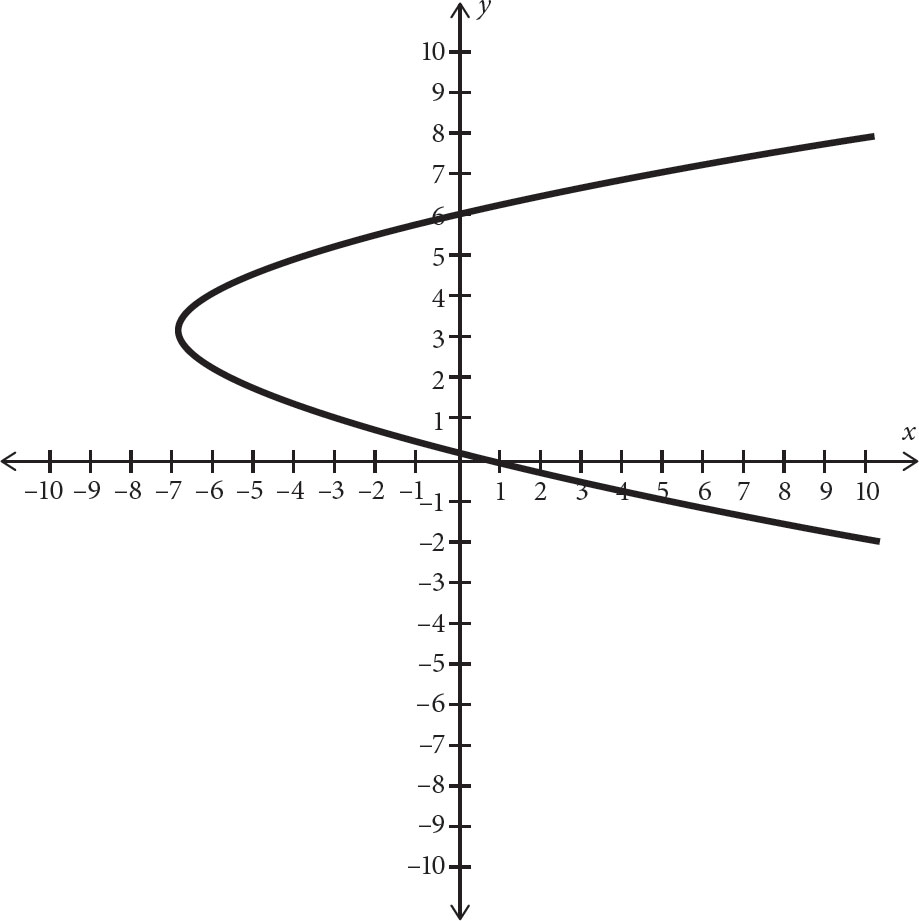
On the side of some graphs will be a mirror image of the other. Let’s look at an example.

1. Which of the following represents the axis of symmetry in the graph above?
A. x = 2
B. x = –3
C. y = 2
D. y = –3
Here’s How to Crack It
The axis of symmetry is the line that divides that graph into two mirror images. First, determine whether the axis of symmetry is horizontal or vertical. Since the left side of the graph is a reflection of the right side, the axis of symmetry is the vertical line separating the two sides. Since vertical lines have a constant x-value, they must be represented by “x =” and some constant. Eliminate (C) and (D). Imagine the lines represented by the two remaining choices. The line x = 2, the vertical line though 2 on the x-axis, does appear to divide the graph into mirror images. The line x = –3, the vertical line though –3 on the x-axis, clearly does not. The correct answer is (A).
Some graphs are periodic. Periodic means that the graph is made up of a repeating section. The horizontal length of this section is called the period. Let’s look at an example.
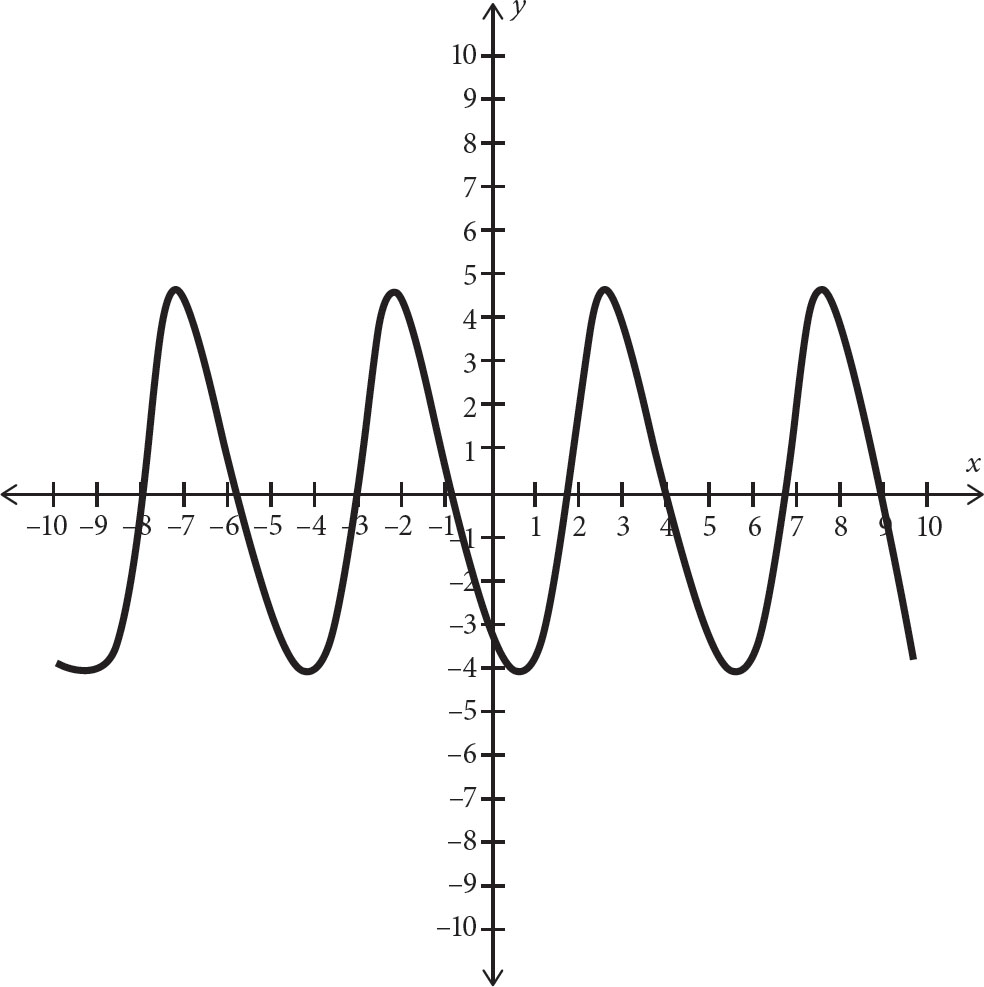
2. What is the period of the graph above?
A. 2
B. 5
C. 8
D. 10
Here’s How to Crack It
This graph has a section that’s repeating. To determine the length of this section, look at the relative maximums. The graph has a relative maximum at about x = –7, x = –2, x = 3, and x = 8. Since the difference between each of these relative maximums is 5, the period is 5. The correct answer is (B).
You can check your answers in Part VIII: Answer Key to Drills.

1. In the graph above, on which interval is the graph negative?
A. –10 < x < 0
B. –4 < x < 7
C. 3 < x < 9
D. 5 < x < 7

2. If a linear graph is represented by the equation y = 2x + 4, mark the point that represents the x-intercept and the point that represents the y-intercept on the graph above.
3. In the graph above, which of the following intervals represents the interval on which the graph is increasing?
A. –7 < x < –1 and 6 < x < 10
B. –3 < x < 2
C. –10 < x < –3 and 2 < x < 10
D. –1 < x < 6
4. In the graph above, which of the following equations represents the axis of symmetry?
A. x = 3
B. x = –7
C. y = 3
D. y = –7

5. Which of the following is the period of the graph above?
A. 3
B. 6
C. 12
D. 24
Now that you’ve seen the basics of geometry one topic at a time, we’re going to give you a drill that mixes up all the different geometric concepts we’ve discussed in this chapter. This drill will help show you whether you’re having trouble recognizing individual types of problems, as we’ve discussed in all the previous chapters. As you do this drill, make it a point to identify each question before you start calculating:
“This one is a triangle question.”
“That is a setup volume problem.”
“This one is a graphing question.”
Examine every diagram to see if you can eliminate any answers that are out of the ballpark. Remember, if two answers are close together, you can’t rely on the diagram to tell you which is exactly right. The figures are drawn only roughly to scale.
If there is no diagram provided, try to make your own. By taking something conceptual and making it concrete, you may be able to ballpark your own diagram.

Need More Math Practice?
Math Workout for the GED® Test contains nearly 500 practice questions.
You can check your answers in Part VIII: Answer Key to Drills.
Click here to download a PDF of Practice Test 1
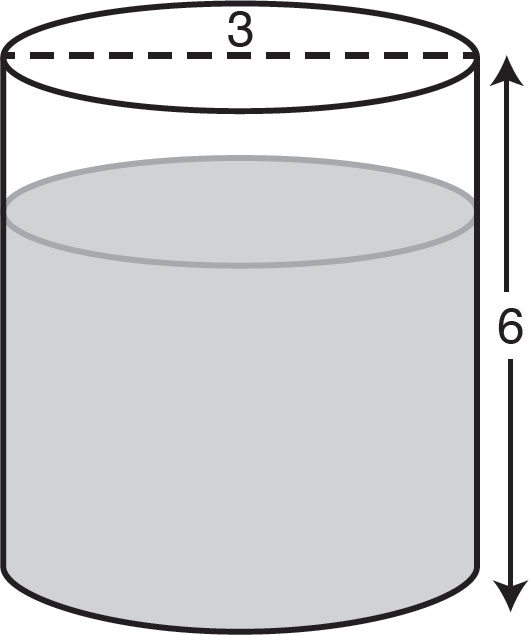
1. The cylindrical glass above is filled  with water. What volume of water is in the glass, rounded to the nearest unit?
A. 170
B. 127
C. 42
D. 32
2. The radius of a circular traffic island is 7 feet. What is the approximate area of the traffic island?
A. 154
B. 148
C. 21
D. 15
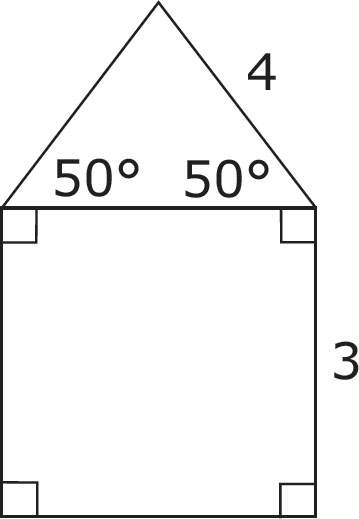
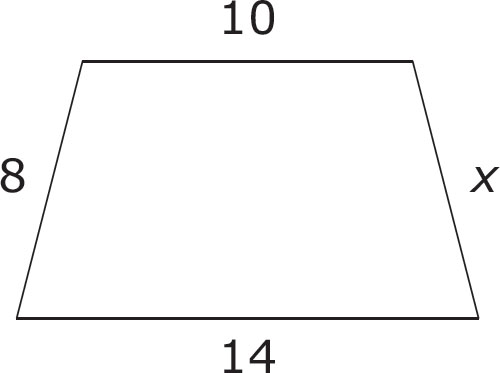
3. The figure above shows a square attached to a triangle. If the triangle is isosceles, what is the perimeter of the entire figure?
A. 12
B. 17
C. 20
D. 34
4. A three-sided figure has sides in a ratio of 2 : 2 : 1. What type of figure is this?
A. an equilateral triangle
B. a square
C. an isosceles triangle
D. Not enough information is given.
5. If a cube has a volume of 27, which of the following is the length of one side of the cube?
A. 3
B. 9
C. 81
D. 144
6. An isosceles triangle has one internal angle of 45 degrees. What is the sum of the other two interior angles?
A. 180 degrees
B. 135 degrees
C. 90 degrees
D. 45 degrees
7. A rectangular flower garden has an area of 168 square feet. If the width of the garden is 12 feet, then what is the length of the garden?
A. 23
B. 20
C. 15
D. 14
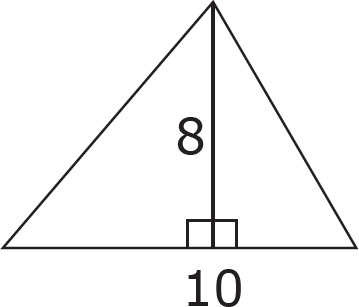
8. The triangle above has a base of 10 and a height of 8. Which of the following expressions gives the area of the triangle?
A. (10)(8)
B. 2(10 + 8)
C. (10 + 8)
D. (10 – 8)

9. Two circles with identical radii are inscribed inside a third circle, as shown above. If the diameter of the large circle is 20, what is the radius of one of the small circles?
A. 40
B. 20
C. 10
D. 5
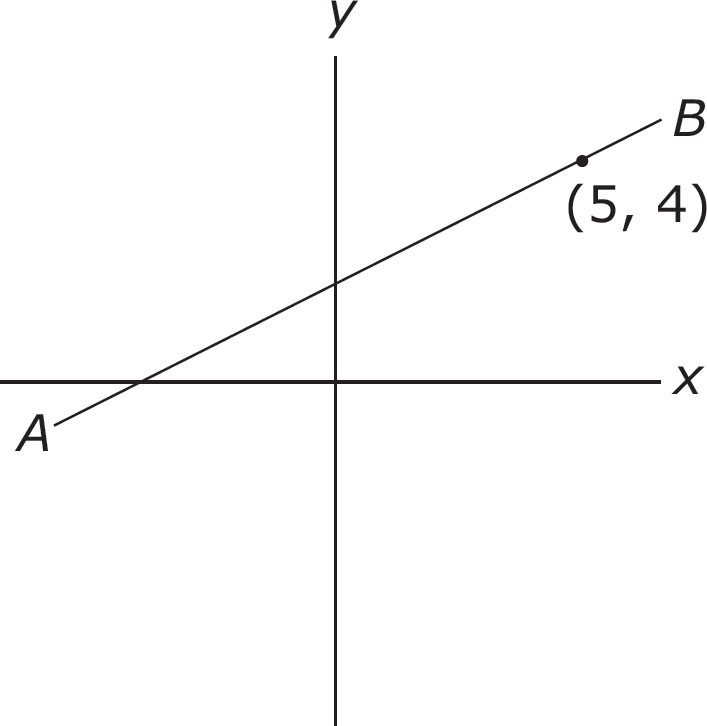
10. Point (5, 4) is on line AB as shown. Which of the following represents the slope of line AB?
A. 
B. 
C. 
D. Not enough information is given.
11. Which of the following represents the equation of a line that goes through the points (1, 2) and (–2, 8)?
A. y = –2x – 4
B. y = –2x + 4
C. y = 2x + 4
D. y = 2x – 4
12. Which of the following intervals on the above graph is positive?
A. –9.5 < x < 1 and x > 8
B. x < –9.5 and 1 < x < 8
C. x < –6.5 and x > 4
D. –6.5 < x < 4
13. A regular hexagon has an area of 24. If the area of a regular hexagon can be computed using the formula A =  s2, where s is the side of the hexagon, what is the perimeter of the hexagon?
A. 2
B. 4
C. 16
D. 24
The GED® Mathematical Reasoning test concentrates on only a few areas of math (and even these topics are not covered inclusively):
Quantitative Problem Solving with Rational Numbers: 25%
Quantitative Problem Solving in Measurement: 20%
Algebraic Problem Solving with Expressions and Equations: 30%
Algebraic Problem Solving with Graphs and Functions: 25%
There are 46 questions on the Mathematical Reasoning test, to be done in 115 minutes. The first five questions will be in Part 1, in which calculators are not permitted. The rest will be in Part 2, in which calculators ARE permitted.
At least 50 percent of the problems will be multiple choice. In these problems, a version of POE called Ballparking enables you to eliminate answer choices on the Mathematical Reasoning test that are out of the ballpark.
Even if you know how to do the problem, Ballparking is useful as a reality check.
Ballparking is even more useful if you don’t know how to do the problem—as a guessing strategy.
Look out for partial answers—answers that are on the way to the correct answer but stop too soon.
Look out for red herrings—pieces of information in the problem that aren’t necessary for its solution.
Do each section of the Mathematical Reasoning test in two passes:
The first pass for the problems you know immediately how to do
The second pass for the problems you aren’t sure of
Because you can’t write on the computer screen, you’ll have to get comfortable with using scratch paper. You will receive three erasable note boards on test day, but you can use scratch paper on our practice tests. Label each problem on your scratch paper so you can find your work again if you come back to it on the second pass.
Numbers to the left of zero on the number line are negative. Numbers to the right of zero on the number line are positive. Zero is neither positive nor negative.
Absolute value is the distance a number is from zero. It is always nonnegative.
When multiplying positive and negative numbers:
positive × positive = positive
positive × negative = negative
negative × negative = positive
When doing several operations, use PEMDAS to decide which operation to perform first.
A fraction is a  . To compare fractions, use the Bowtie as outlined in Chapter 13.
You must know how to add, subtract, multiply, and divide fractions.
Always reduce fractions (when you can) before doing a complicated operation. This will reduce your chances of making a careless error.
A decimal is just another way of expressing a fraction.
A percentage is just a fraction whose denominator is always 100. You should memorize the percentage shortcuts we outline in Chapter 13.
In the setup problems on the GED® test, you don’t have to find the answer—just the equation that will get the answer.
An average (or arithmetic mean) is the sum of all items, divided by the number of items. The median is the middle number of a group of ordered numbers. The mode is the number that appears the most often.
Any problem that uses the word “per” can be solved by the equation rate × time = distance.
An exponent is a shorter way of expressing the result of multiplying a number several times by itself.
When you multiply numbers with the same base, you simply add the exponents. When you divide numbers with the same base, you simply subtract the exponents.
The square root of a positive number x is the number that, when squared equals x. The square root of 9 =  = 3.
= 3.
To find the probability that something is going to happen, you take the number of chances that the thing could happen and compare that to the total number of possible outcomes. Probabilities are usually expressed as fractions in which the number of chances that the thing could happen is the numerator and the total number of possible outcomes is the denominator.
Many algebra problems can be solved by Backsolving—working backward from the answer choices to see which one solves the problem.
Some problems can be “translated” from English to math:
is means =
of means ×
more than means +
less than means –
A line contains 180 degrees. A circle contains 360 degrees.
Triangles contain 180 degrees. A right triangle contains one 90-degree angle. An isosceles triangle has two equal sides, and two equal angles. An equilateral triangle contains three equal sides with three angles of 60 degrees each.
The area of a triangle is  .
.
The circumference of a circle is 2πr. The area of a circle is πr2.
The volume of a rectangular solid is length × width × depth.
To graph an x,y-coordinate on a coordinate plane, count over to the right (for positive) or left (for negative) to plot the x-coordinate, then up (for positive) or down (for negative) to plot the y-coordinate.
The slope of a line is the change in y values (rise) divided by the change in x values (run). It is generally expressed as a fraction. Slope is just another word for the rate of change.