15
Intermittent Suspension and Transport of Fine Sediment over Natural Tidal Bedforms
ABSTRACT
In the tidal environment of the Elbe estuary (German North Sea coast) the intermittent suspension of sediment over large tidal bedforms is revealed by the periodic appearance of large (10–20 m diameter) sediment-laden clouds at the water surface. In this environment, two separately acting sedimentary regimes are identified: active ebb-directed tidal bedforms (1.5–4 m high, 50–100 m long, lee-side angles 10–15°) of medium to coarse sands, and a fine sediment load (< 170 μm) repeatedly forming an ephemeral fluid mud layer at low energy tidal stages in the bedform troughs. Hydroacoustic and optical measurements reveal coherent flow structures forming in the lee of the bedforms linked to formation of the clouds, the upward transfer and maintenance in the water column. Turbidity cloud appearance is restricted to accelerating flow conditions and occurs only after a hydrodynamic threshold has been overcome. Around this time, suspended sediment transport is governed by large coherent flow structures. Under maximum current velocities, although flow structures continue to prevail, suspended sediment transport appears to be decoupled from the initial flow structures, resulting in a homogenous sediment mixture. Estimates of the frequency of surface clouds and coupled flow structures are within the range of previously observed coherent flow structures in laboratory and field studies.
15.1 Introduction
The processes leading to the entrainment, transport and deposition of fine-grained sediment in estuarine environments are governed by complex feedback mechanisms between the hydrodynamic forcing, sediment characteristics and seabed topography. Previous studies have documented the fundamental role of intermittent turbulent events on sediment entrainment and have proposed coherent flow structures to be the principal mechanism involved in the vertical mixing of fluid momentum, temperature, nutrients and sediment (e.g. Lapointe, 1992; Kostaschuk and Church, 1993; Venditti and Bennett; 2000). In the Elbe Estuary (German North Sea Coast) the intermittent nature of fine-grained, cohesive sediment transport is revealed by the appearance of large (10–20 m) sediment-laden clouds at the river surface. The occurrence of clouds is restricted to certain tidal stages and appears to be linked to the presence of boils, the surface expression of large, low-velocity, upward-tilting vortices originating near the seabed (Matthes, 1947; Coleman, 1969; Jackson, 1976; Rood and Hickin, 1989; Babakaiff and Hickin, 1996; Winter et al., 2007).
Boils are common features in river flows and the literature on boil origin and associated eruption frequencies is widespread: several researchers attribute boils to macroturbulent phenomena associated with roughness elements on the seabed. In dune fields with flow separation, large vortices are believed to be generated at the brink point and the reattachment point of the separation streamline (e.g. Kostaschuk and Church, 1993; Bennett and Best, 1995; Venditti and Bennett, 2000) or from ‘flapping’ of the wake layer (e.g. Nezu and Nakagawa, 1993; Best, 2005b). In the case of low angle dunes and in absence of flow separation, it has been suggested that vortices originate at intermittent shear gradients in the dune lee (Kostaschuk and Villard, 1999; Best et al., 2001; Best and Kostaschuk, 2002). Furthermore, in the absence of bedforms, several authors have attributed boil-producing turbulent motions to microturbulent boundary layer bursting phenomena (Jackson, 1976; Yalin, 1992).
Several studies report increased suspended sediment concentrations (SSC) in boil structures compared to the ambient flow (e.g. Lapointe, 1992; Best, 2005a; Czuba et al., 2011). However, it is still unclear what mechanisms promote entrainment of sediment from the seabed (Coleman and Nikora, 2011), what are the characteristics of the sediment entrained (both in terms of grain size and quantity) and how interaction with the free surface may affect the dispersal of sediment transported upward within these structures (Best, 2005a). Particularly in tidal environments, subject to strong velocity gradients and regular reversal of the flow, in situ measurements of the turbulent flow and suspended sediment transport are rare due to the difficulties encountered when measuring in the field. This study therefore aims at a high-resolution in situ monitoring of processes involved in the formation of the turbidity clouds above a series of tidal bedforms. Focusing on the time scale of a tidal cycle will enable acquisition of process-based insights into the generation mechanisms of clouds and their dependence on tidal flow conditions, the propagation of clouds to the surface, and the mechanisms maintaining the sediment in suspension and inside the compact fluid structures. Our findings will add to the current understanding of short-term suspended sediment transport variability, vital in the attempt to predict sediment transport in such complex environments.
15.2 Field site and data acquisition
15.2.1 Setting
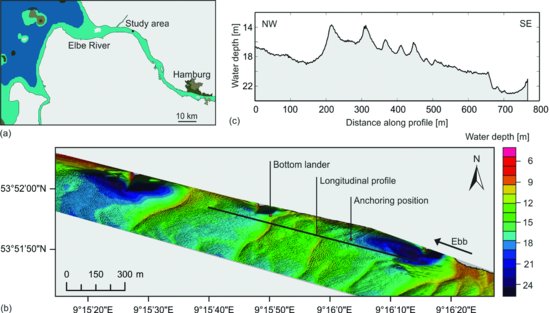
The Elbe River is the largest tidal river in Germany with a catchment area of 132 000 km2 and an annual mean freshwater discharge of 720 m3s−1 (Kerner, 2007) into the German Bight. A spring tidal range of 4 m places the Elbe between the classifications of meso- and macro-tidal estuaries (Kappenberg and Grabemann, 2001). Tides are semidiurnal with a distinct asymmetry towards ebb (Kappenberg et al., 1995). The study area is located 30 km upstream of the Elbe estuary mouth at the northern margin of a river bend (Figure 15.1a). At this location large compound tidal bedforms cover the seafloor in water depths of 10–30 m. Under average discharge conditions the study area is located in the reach of the turbidity maximum zone, which stretches approximately 30 km along the river, the midpoint situated circa 10 km further upstream (Grabemann et al., 1995). Annual mean concentration of suspended matter in the Elbe is 0.035 g L−1 and can reach values tenfold within the turbidity maximum zone (Kappenberg and Grabemann, 2001).
Figure 15.1 (a) The location of cloud monitoring in the Elbe Estuary, 30 km upstream the river mouth. (b) Bathymetry [m] in the study area. The location of the bottom lander, the anchoring position for June 23 and the longitudinal transect are indicated. The large ebb-directed bedforms are on average 3 m high and 100 m long with lee-side angles of 10–15°. The topography is interspersed by large depressions associated with sluices at the river margin. (c) Vertical transect of the monitored longitudinal profile.
15.2.2 Field campaign
A field campaign was carried out in June 2010, combining optical and hydroacoustic measuring techniques: equipped with a downward-looking acoustic Doppler current profiler (ADCP; 1200 kHz, TRDI Workhorse), a bottom lander was deployed for five days, located in the upper lee-side close to a tidal bedform crest (Figure 15.1b). Additionally, data were collected on longitudinal transects along a series of tidal bedforms, using a downward-looking ADCP (600 kHz, TRDI Workhorse) and a multibeam echo sounder (MBES; 455 kHz, SeaBat 8125 RESON). Covering a profile length of approximately 1 km, profiles were collected every 30 min during one 12.5 h tidal cycle. A single transect took between 10 and 15 min, during which the ship was navigated against the main current direction at low speed, normal to the bedform crests. Surface sediments were taken by means of a Shipek grab sampler along the same transect.
During a second tidal cycle, stationary shipborne measurements were conducted at anchor; the location is indicated in Figure 15.1b. In addition to the shipborne ADCP, a multi-sensor probe was deployed at a constant water depth of 1.1 m recording turbidity, salinity and temperature variations at the water surface. In order to derive water samples for the calibration of ADCP backscatter and optical turbidity sensor data regarding suspended sediment concentration, the multi-sensor probe was in a third deployment repositioned to a water depth of 2 and 5 m every half hour for a tidal cycle to collect water samples (via pumping); meanwhile the shipborne ADCP was continuously recording.
The ping rate of the shipborne ADCP was set to 2.3 s, with a bin size of 0.5 m. Taking into account the deployment depth of 1.35 m and the blanking distance of 1.05 m, the first measurement was located in a depth of 2.4 m. The ADCP mounted on the bottom lander was deployed at a height of 2.5 m above the seabed. Considering a blanking distance of 0.6 m, the uppermost measurement was located at a height of 1.9 m above the seabed. Ping rate and cell size were 4 s and 0.1 m, respectively.
15.3 Data analysis methods
15.3.1 Sediment analysis
A total number of 32 bed samples and 46 water samples were collected during the field campaign. The bed samples and 34 water samples were analysed for particle size distributions (PSD) by means of a Coulter Beckmann Laser Particle Sizer (laser diffraction method) covering the range 0.04–2000 μm. It is noted that the PSD analysis was performed on dispersed material, i.e. flocs and aggregates were destroyed before processing. All water samples were filtered, dried, and weighed to derive suspended sediment concentrations.
15.3.2 Flow velocities
The ADCP current velocity measurements were converted to earth coordinates (RD Instruments, 2008). Shipborne ADCP data were geo-referenced using the onboard LRK GPS and corrected for ship speed using ADCP bottom track velocities. Then, stream-wise (u) and transverse (v) velocity components were determined by projecting current velocity vectors with respect to the ebb current direction.
15.3.3 Turbulence parameters
The ADCP-derived flow velocity profiles were analysed to derive information on turbulence statistics throughout the water column (e.g. Lu and Lueck, 1999). Stream-wise (u′) and vertical (w′) velocity fluctuations were determined by subtracting instantaneous velocity values (u, w) from their mean ( ) at each depth. In order to include large-scale turbulent motions but to yield quasi-stationarity with respect to tidal variations an averaging window of 10 min was chosen (cf. Dyer, 1997; Soulsby, 1980). For stationary ADCP measurements, this implied averaging of 260 and 150 ensembles along equal bins for the ship-based and lander-based ADCP, respectively. In the case of moving vessel ADCP transects, mean streamwise and vertical velocity at each depth (bin) were determined by spatiotemporal averaging of all ensemble measurements of one profile, assuming that during the profiling period of approximately 10 min no significant changes occurred in the overall tidal flow.
Streamwise and vertical velocity fluctuations were used to specify coherent fluctuation signatures in the flow field. Following quadrant analysis (Lu and Willmarth, 1973), velocity fluctuations for each bin were classified into a specific quadrant field: Q1 (+u′+w′), Q2 (−u′+w′), Q3 (−u′-w′) and Q4 (+u′−w′). Since velocity fluctuations in this study were derived not only from time- but also from spatially averaged values, we differentiate the two methods by indexing t for temporal and s for spatial consideration (e.g. Q1t vs. Q1s). In the case of the stationary data, only velocity patterns meeting the condition |u′w′| > 2 rms(u′) rms(w′) = 0.001 were considered, where rms is the root-mean square value, in order to distinguish low velocity fluctuations from events capable of suspending sediment (cf. Cellino and Lemmin, 2004).
In the following, we refer to larger structures comprising several velocity measurements of one quadrant in the ADCP reading as ‘coherent structures of common velocity signature’ or simply ‘coherent flow structures’.
15.3.4 ADCP backscatter and optical turbidity probe calibration
The ADCP echo intensity backscatter signal was calibrated to SSC profiles using 34 water samples as described by Gartner (2004), Hill et al. (2003), Hoitink and Hoekstra (2005) and Kostaschuk et al. (2005). Following Deines (1999), echo intensities recorded by the ADCP were corrected for beam spreading and water absorption. The water absorption coefficient was calculated according to Ainslie and McColm (1998). The backscatter intensity was further corrected for absorption due to suspended sediment, implementing the iterative algorithm described by Thorne et al. (1994) and applied, by Holdaway et al. (1999) on single-frequency hydroacoustic data. The sediment absorption coefficient was determined according to Urick (1948).
The CTD turbidity sensor (Seapoint OBS) on the multi-sensor probe was calibrated for SSC by using the same water samples and a linear regression model (SSC = 0.522 OBS + 3.7304; coefficient of determination R2 = 0.818).
15.4 Results
15.4.1 Bedform dimensions
Large ebb-directed compound tidal bedforms characterized the sea bed topography at the field site in an approximate water depth of 17 m. Bedform dimensions along the longitudinal profile (Figure 15.1b) were estimated from MBES surveys. Primary bedforms were 1.5–4 m high with lengths of 50–100 m and lee-side angles varying between 10–15°. These primary bedforms were super-imposed by smaller secondary bedforms with heights ranging between 0.3–0.8 m and lengths of 5–15 m.
15.4.2 Hydrodynamic and sedimentological characteristics
The tidal range during the observation period was 3.2 m. Maximum depth-averaged ebb currents were 1.4 ms−1, while flood currents reached maximum values of 1.3 ms−1. Increased freshwater discharge (1400 m3s−1 at Neu Darchau (130 km upstream), WSA Lauenburg) at the time of measurement relocated the turbidity maximum zone downstream of the field site, resulting in temporally relatively low ambient suspended sediment concentrations.
Suspended sediment concentrations derived from 34 water samples in 2 and 5 m water depth ranged between 0.02–0.22 gL−1 throughout the tidal cycle, the minimum concentration occurring shortly after slack water. The samples showed only minor variation in terms of grain size distribution over the tidal cycle (cf. exemplary curves in Figure 15.2). Sediment in suspension was generally smaller than 170 μm with a dominant mode between 40 and 60 μm (Figure 15.2a).
Figure 15.2 (a) Grain size distributions of suspended sediment from water samples, (b) of the fluid mud layer forming in the tidal bedform troughs shortly after slack water and (c) bed samples. The similarity of grain size distributions of fluid mud and sediment samples indicates that the source of the material suspended can be found in tidal bedform troughs.
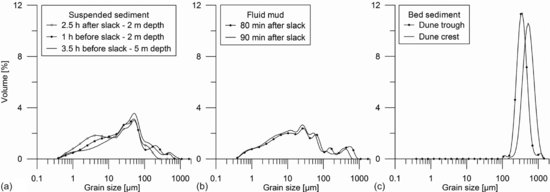
Particle sizes of bed sediments across the tidal bedform field ranged from 150-700 μm with median values of the uni-modal distribution lying between 336 and 546 μm (medium to coarse sands). Material from primary bedform troughs was characterized by a slight shift of the dominant mode towards finer material compared to bedform crest (cf. exemplary curves in Figure 15.2c). For a short period after slack water a thin layer of fluid mud covered the sandy bed material in bedform troughs. Isolate grain size analysis of the fluid mud layer showed characteristics similar to the suspended sediments in the water samples (Figure 15.2b).
15.4.3 Turbidity cloud description at the water surface
Turbidity clouds were visually observed at the water surface as circular features with a distinct brownish surface colour at the onset of the accelerating tide, during the transition from flood to ebb, approximately 80 min after slack water. Cloud diameters varied between 10 and 20 m. The clouds were advected by the ambient flow and slowly increased in diameter. They partly merged to form larger structures, in which the original clouds were separated by thin bands of less turbid water. These characteristics were observable for up to 1 hour following the first cloud appearance.
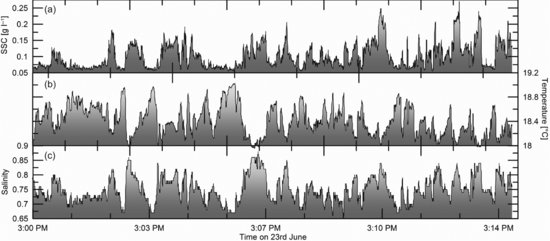
The turbidity clouds showed upwelling characteristics, i.e. smooth patches of surface water, slightly elevated compared to the ambient water surface (Figure 15.3). Wind-induced capillary waves refrained from propagating into the interior of the clouds but steepened and broke at the boundary of corresponding patches. The multi-sensor probe equipped with a CTD and held at a water depth of approximately 1.1 m at the mooring position on 23 June revealed distinct changes in temperature, salinity and suspended sediment concentration as clouds were advected past the sensors (Figure 15.4): abrupt increases in SSC (up to 0.25 gL−1) were accompanied by decreases in temperature (up to 1 °C) and increases in salinity (up to 0.15).
Figure 15.3 Turbidity clouds in the Elbe Estuary. (a) Clouds are clearly distinguishable from the surrounding clearer water by increased suspended sediment concentration (b) and topographic surface.
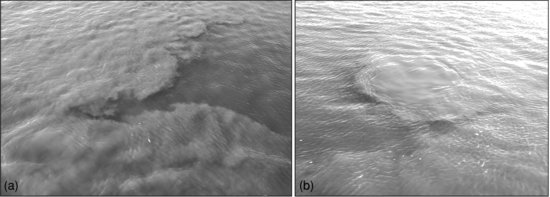
Figure 15.4 CTD record of period with clouds at the surface. (a) High SSC structures (increase of up to 0.075 g L−1) are accompanied by (b) a drop in temperature (up to 1 °C) and (c) an increase in salinity (up to 0.15).
15.4.4 Turbidity cloud detection in the water column
Elongated structures of increased SSC appeared on calibrated ADCP backscatter profiles coinciding with cloud appearance on the water surface. Figure 15.5a depicts one of the profiles on 22 June. The profile shows SSC distribution during accelerating ebb flow conditions (mean velocity of 1 m s−1) 75–90 min after slack water. Structures of high SSC (up to 0. 3 gL−1) are clearly distinguishable from the ambient water (average concentration below 0.05 g L−1). Only a few structures extended down to the sea bed and were located on the stoss-side of the primary tidal bedforms.
Figure 15.5 Longitudinal transect across bedforms: (a) Suspension clouds are clearly distinguished by increased SSC values over the profile forming columnar structures. (b) Streamwise velocity fluctuations (m s−1) show accelerated flow over the tidal bedform stoss and crest and flow deceleration in the tidal bedform lee. (c) Vertical velocity fluctuations (m s−1) indicate upward velocity over the stoss-side and crest and downward flow in the tidal bedform lee. (d) Coupled Q2s (−u′ +w′)/Q3s (−u′ −w′) events are associated with the clouds. Stationary measurements by shipborne ADCP (e-g) and lander ADCP (h): (e, f) Increased SSC in columnar structures around 15:00 UTC coinciding with near-bed velocities of 0.6 m s−1. (g) Directional fluctuation analysis: velocity fluctuations reach above threshold and alternating common velocity signatures occupy the entire water column. (h) Near-bed measurements show alternations of Q2t (−u′ +w′) and Q4t (+u′ −w′) events above threshold to be most common. For more explanation see text.
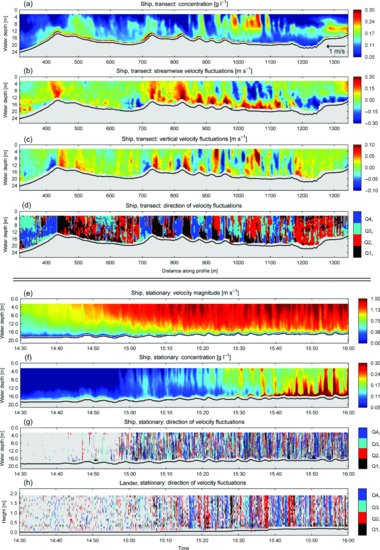
15.4.5 Flow structure during cloud observation
The topographic forcing of the flow in the presence of tidal bedforms is shown by transects of ADCP flow velocity profiles (Figures 15.5b-d). Streamwise velocity fluctuations (Figure 15.5b) showed accelerated flow over the stoss-side and the crest of the large compound bedforms and decelerated flow in the lee-side throughout the entire water column, while vertical velocity fluctuations (Figure 15.5c) were positive over the stoss-side and crest and negative in the lee-side. The secondary bedforms exhibited a similar control on the flow, although the deceleration in the lee seemed less pronounced and acceleration affected the flow only close to the bed. In general, the topographic forcing was evident over much of the water column and along the entire profile, apart from the range between metre 600 and metre 800 where areas of low streamwise velocity overlaid the acceleration over the stoss-side.
Common signatures of velocity fluctuations (Figure 15.5d) show coherent structures of accelerated upwelling flow (Q1s ( ) immediately coupled with areas of accelerated downwelling flow (Q4s (
 ) at the crests of the primary tidal bedforms. Above the lee-side and troughs alternations of decelerated upward (Q2s (
 ) and downward flow (Q3s (
 ) prevailed. Over the stoss-sides of the primary bedforms the two coupled patterns coexisted; a combination of Q3s/ Q2s type structures in the upper water column and of Q1s /Q4s structures in the lower water column prevailed (cf. meter 1200–1250).
15.4.6 Coherent flow and SSC structure variability on a tidal cycle
The occurrence of clouds during accelerating flow and the associated change in flow structure was assessed on the basis of stationary ADCP measurements. The lander-based ADCP measured the near-bed water column in the upper lee of a large primary tidal bedform while the vessel (ship-based ADCP) was moored above the mid-stoss-side (Figure 15.1b). Examples of flow structures and SSC dynamics in the entire water column are shown in Figure 15.5e-h for a period of 1.5 h during accelerating ebb currents on 23 June, starting 50 min after slack water (13:40 UTC) (Figure 15.5e). Initially, SSC was at a minimum of less than 0.05 g L−1 except for the area 3–4 m above the seabed (Figure 15.5f). Around 15:00 UTC (80 min after slack water) a vertical pattern of SSC, alternating between low and high SSC structures developed. This coincided with the first observation of clouds at the water surface. SSC increased further during accelerating ebb; the alternating pattern of high SSC and low SSC structures, however, prevailed. Simultaneously with the appearance of this vertical SSC pattern, the velocity fluctuations exceeded the threshold level to form vertical coherent structures with common velocity signatures (Figure 15.5g).
The near-bed velocity fluctuations, derived from the lander-based ADCP, support this observation: the first appearance of clouds coincided with the occurrence of coherent structures with common velocity signatures, occupying the entire profiling range of 1.9 m (Figure 15.5h). Coherent structures of Q2t ( ) and Q4t (
 )-type signatures dominated, with periods of successive decelerated upwelling structures ranging between 60 and 150 s and a duration of single upwellings of 30–60 s.
15.5 Discussion
The observed compound tidal bedforms exert similar spatial control on the flow and on suspended sediment transport patterns as previously observed in laboratory studies (e.g. McLean et al., 1994; Bennett and Best, 1995; Venditti and Bennett, 2000) and field measurements of bedforms under unidirectional currents (cf. review by Best, 2005a). The frequent changes in flow velocity and direction associated with the tides however, induce a temporal variability that is much more complex and significantly affects sediment transport in such environments (Lefebvre et al., 2011). In our efforts to create accurate predictors of suspended sediment transport for application in inlet maintenance strategies, this study on the intermittency of suspended sediment transport and the associated turbulent flow field contributes to our current knowledge on estuarine morphodynamics. The following will provide a discussion on the origin of the suspension clouds in the Elbe River, the reasons behind their restricted occurrence on a tidal cycle and the processes maintaining the clouds in the upper water column in the light of previous studies.
15.5.1 The origin of the suspension clouds
15.5.1.1 Frequency estimates of turbidity clouds and flow structures
Flow passing over a fluid body, which is restrained in its motion tends to oscillate at a specific frequency causing the generation of turbulent structures with equal periodicity (Levi, 1983; Kostaschuk and Church, 1993; Babakaiff and Hickin, 1996). The specific frequency of turbulent production (f) is related to a characteristic length scale (l) and a characteristic velocity U) by the Strouhal Number (Sr = f l /U) (Strouhal, 1878; Levi, 1983). Depending on the seabed relief and scales of turbulence observed, several variations of the law have been proposed differing in length and velocity scales, i.e. flow depth scale or bedform scale. The characteristic velocity has been substituted, for example by the free shear velocity, mean flow velocity or shear velocity, while the length scale has been defined as flow depth, separation zone length, or bedform height (e.g. Rao et al., 1971; Itakura and Kishi, 1980; Driver et al., 1987; Simpson, 1989; Kostaschuk and Church, 1993). Venditti and Bauer (2005) summarized observed eddy frequencies in the lee-side of bedforms from field and laboratory measurements (authors cited therein) to derive a range of Strouhal numbers characteristic of both flow depth scale and bedform scale. Accordingly, Strouhal numbers based on mean flow velocity ( ) and mean water depth (d) ranged between 0.19 and 0.6. Scaling mean flow velocity (
 ) and mean dune height (H) provided values between 0.05 and 0.25.
Turbulent structures specifically associated with flow separation are characterized by distinct frequencies: Simpson (1989) proposed two scale relationships based on laboratory observations in order to differentiate contributions of macroturbulent phenomena associated with eddy shedding (fv = 0.8 U0/xr) from those due to wake flapping (fw < 0.1 U0/xr), where U0 is the mean velocity upstream of the step and xr is the mean length of the separation zone (e.g. xr = 4.25 H (Bennett and Best, 1995)).
Application of these relations to the Elbe environment (d = 16.6 m, H = 3 m,  m s−1) by adopting the range of Strouhal numbers proposed by Venditti and Bauer (2005) provides an expected frequency range of 0.013–0.04 Hz (scaled with water depth and mean velocity) and 0.019–0.09 Hz (scaled with bedform height and mean velocity) for macroturbulent structures in the Elbe River. The predicted frequencies for macroturbulence specifically associated with eddy shedding and wake flapping are fv = 0.07 Hz and fw<0.009 Hz, respectively.
Near-bed detection of common velocity signatures in this study indicated that coherent flow structures capable of suspending sediment occur with a frequency of 0.007–0.017 Hz. A visual estimate of suspension cloud periodicity based on surface measurements of SSC on 23 June yielded 30–200 s, with an average value of 69 s (0.014 Hz). Despite this rather crude estimation, the observed frequencies of both clouds and flow structures in the Elbe environment agree with predicted frequencies, if at the lower end, based on previously observed Strouhal numbers. This indicates that surface clouds and associated boils originate from turbulent processes similar to ones described in previous studies. It is however, not possible to relate the occurrence of clouds to a particular turbulence-producing mechanism associated with the formation of a flow recirculation cell.
15.5.1.2 Observations in the field
The turbidity clouds in the upper water column are associated with an alternating pattern of upward and downward directed decelerating flow as revealed by spatial observations of SSC and flow structures. A similar velocity signature can be found in the bedform lee and trough, indicating the origin of the clouds at this location in the field of bedforms. Several studies have considered boil-producing vertical fluid motions to originate in the lee of bedforms related to separation of the flow (e.g. Lapointe, 1992; Nezu and Nakagawa, 1993; Bennett and Best, 1995; Venditti and Bennett, 2000; Venditti and Bauer, 2005). In a laboratory analysis of turbulence structure and sediment transport over dunes, Bennett and Best (1995) found accelerated upward motions (Q2 events) along the separation zone layer and near flow reattachment. They attributed sediment entrainment and suspension in boils to the more energetic of these events. Decelerated downward motions were confined to the reattachment point, while inrushes of accelerated downward flow (Q4 events) were coupled with the sediment entraining upward fluid motions above the dune troughs. In the field, Shugar et al. (2010) correlated high SSC structures with near-bed areas of streamwise velocity deceleration over the crests and troughs of a large fluvial sand dune. The structures were inversely correlated with vertical velocities and linked to the vertical flux of fluid to the water surface.
Although the observed velocity characteristics associated with the turbidity clouds are similar, it cannot be determined in this study whether or not the low-velocity vortices associated with the Elbe turbidity clouds form due to flow-separation processes. ADCP velocity measurements do not show any evidence of flow reversal in the lee of the large compound tidal bedforms. Lee-side angles of 10–15° fall within the range of angles for which it is still debated whether permanent flow reversal occurs in the field. Kostaschuk and Villard (1996) suggested that flow separation may occur only intermittently for lee side slopes of up to 19° while Paarlberg et al. (2009) observed persistent flow separation for laboratory dunes with lee angles >10°. The failure of detection might therefore be due to the ADCP's methodological limitation for measuring in the near-bed bedform troughs (Kostaschuk et al., 2005) or the absence of persistent flow separation. In the absence of flow separation similar macroturbulent flow structures have been observed in the deceleration zone behind the crests of low angle dunes (Kostaschuk and Villard, 1999; Best et al., 2001; Best and Kostaschuk, 2002). Regardless of their formation, it is these upward motions that entrain material from the bedform troughs. The sediment is suspended and advected upward, confined in the vertical flow structures. The observation of lower temperature and higher salinity, therefore higher density, of fluid within the clouds, indicating the origin of the water masses close to the seabed, support this conclusion. Further indications are the periodic existence of a fluid mud layer in the bedform troughs, the linked grain size distributions of the fluid mud and suspended sediment, and the similar nature of coherent structures in the bedform troughs and within the suspension clouds.
15.5.2 Hydrodynamic threshold for the occurrence of suspension clouds
The occurrence of turbidity clouds at the water surface of the Elbe is restricted to certain tidal stages exhibiting strong velocity gradients. Similarly, Matthes (1947) and Kostaschuk and Church (1993) observed a restriction of boils to rapid flow stages in fluvial environments. Rood and Hickin (1989) associated the evidence of larger macroturbulence at the water surface with higher turbulent stresses during decelerating flows. Near-bed observations of turbulent structure under tidal flows in the laboratory (Anwar, 1981) and field (Gordon, 1975) indicated that the accelerating and, predominantly, the decelerating phases of the tide were characterized by higher turbulent intensities and enhanced sediment transport compared to the condition at maximum flow velocities. The confinement of the Elbe clouds to the accelerating stage of the tide is thus believed to be the result of higher turbulence due to flow unsteadiness. Following maximum flow velocity, the now almost homogenous sediment mixture in the water column and the absence of significant amounts of fine material on the seabed are believed to prohibit any distinction of increased suspension during flow deceleration.
While coherent flow structures exist early during the tidal cycle, it requires a mean near-bed velocity of 0.6 m s−1 before sediment is brought into suspension by these structures. The strongest velocity fluctuations around this time are associated with the decelerated upward (Q2 type) and accelerated downward (Q4 type) flow structures providing the necessary turbulent shear stress to entrain sediment and to sustain material in suspension.
15.5.3 Suspension cloud sustainment in the water column
ADCP records and visual observations show the persistence of the suspended sediment and coherent flow structures. The advected compact shapes at the water surface are sustained for up to 1 hour, a considerably longer period than previously reported (e.g. Rood and Hickin, 1989; Babakaiff and Hickin, 1996). To the authors' knowledge it has also never been reported that suspension clouds associated with boils over dunes occupy much of the water colum (∼8 m) with little inhomogeneity of SSC. In contrast, Shugar et al. (2010) observed a loss of energy and lateral spread as flow structures migrate upwards through the water column due to the increased velocity in the upper flow region and induced shear dispersion. Suspension and coherent flow structures have also been reported to show distinct advection angles of 20–25° (Nezu and Nakagawa, 1993; Kostaschuk and Villard, 1999; Kostaschuk, 2000), which were much less inclined in this study.
These deviations from previous descriptions are attributed to the well-mixed water column of the Elbe and the difference in transported matter entrained in such boils. Previous studies documented the ability of boils to entrain sandy material whereas, in this study, even under maximum flow conditions the grain size in suspension remained predominantly in the mud-silt spectrum. Higher settling velocities in the case of sandy material will lead to a more rapid fall-out and deposition from the confined fluid motion (Matthes, 1947). Rood and Hickin (1989) observed the grain size distribution of sediment within boils to depend on the tidal stage and thus turbulent energy in the flow structures. In this study, at no point do we see changes in the grain size distribution of sediment in the water column. The sandy material of the compound bedforms is believed to be transported predominantly as bedload. These findings suggest that the environment of the Elbe compound tidal bedforms is characterized by two apparently decoupled sedimentary regimes: grains smaller than 170 μm (main mode of about 50 μm) are transported predominantly in suspension and form a fluid mud layer around slack water in the tidal bedform troughs. The active tidal bedforms on the seabed are composed of sand larger than 170 μm (main modes at 350 and 500 μm). The suspended fine sediment is believed to travel up to several kilometres within the coherent flow structures. It is the large, compound tidal bedforms, themselves products of the interaction of flow and coarser sediment, which provide the mechanisms and controls on the fine sediment budget of the Elbe.
15.6 Conclusions
The mobile bed sediment of the Elbe estuary can be regarded as a dynamic two component system: one component consists of the sandy bed material (∼500 μm) which, under the influence of tidal currents, river discharge and macroturbulence, forms the ebb-directed primary and smaller secondary bedforms in focus in this study. The second component is composed of fine material (∼50 μm), which, under the influence of tidal currents, periodically settles towards the bed to form a fluid mud layer in the bedform troughs or is transported in suspension in the form of distinct clouds.
This study made use of hydroacoustic and optical measuring techniques to gain insights into the governing processes involved in the cyclic transport behaviour of this latter component. Although ADCP measurements, due to sensor configuration and resolution achievable, are somewhat limited (cf. Kostaschuk et al., 2005), general patterns of macroturbulence associated with the clouds can be observed. In order to derive a more detailed view on the origin of tidal bedform-related turbulence and turbulent motions associated with the suspension clouds long after their formation however, high frequency measurements of simultaneous 3D velocity and SSC fluctuations will be necessary.
The following provides a conceptual model of the governing processes:
- Suspended sediment in the water column is at its minimum ca. one hour after slack water. Formerly suspended sediment has settled and accumulated to form a fluid mud layer in the bedform troughs.
- As the tidal currents accelerate, the flow over the bedforms is altered to characteristic flow patterns controlled by topography: flow acceleration above the stoss-side and deceleration in the dune lee. Coherent structures evolve with distinguishable patterns of upwelling and downwelling fluid motions. Alternating low-velocity upward and downward structures at the troughs entrain fine material and transport the clouds into the upper water column, once a turbulent energetic threshold is overcome.
- Low-velocity upwelling and downwelling fluid motions maintain suspended sediments in a compact structure and induce an upward-directed momentum, resulting in suspended sediments and water of higher density being transported towards the water surface. The low-velocity fluid motions persist and maintain the clouds at the water surface.
- As the tidal flow accelerates the clouds disperse and then merge to form a homogeneous suspended sediment distribution.
- After slack water, the suspended fine sediments settle and reform the fluid mud layer, as observed in the tidal bedform troughs.
15.7 Acknowledgements
We acknowledge the comments of an anonymous reviewer and editor on an earlier stage of the manuscript. We thank the captain and crew of FK Senckenberg and the research institute Senckenberg am Meer for the ship time provided. Thanks are extended to Christian Maushake and Dierk Sellhorn from Bundesanstalt für Wasserbau (BAW) for technical support during the field survey. Inka Meyer performed the PSD analysis. Markus Benninghoff helped with the preparation of the sediment samples. This research was funded through the DFG-Research Center/Cluster of Excellence ‘The Ocean in the Earth System’.
References
Ainslie, M.A. and McColm, J.G. (1998) A simplified formula for viscous and chemical absorption in sea water. Journal of the Acoustic Society of America 103, 1671–1672.
Anwar, H.O. (1981) A study of the turbulent structure in a tidal flow. Estuarine, Coastal and Shelf Science 13, 373–387.
Babakaiff, C.S. and Hickin, E.J. (1996) Coherent flow structures in Squamish River Estuary, British Columbia, Canada. In Coherent Flow Structures in Open Channels (eds P.J. Ashworth, S.J. Bennett, J. Best and S.J. McLelland), John Wiley & Sons, Ltd, Chichester, pp. 321–342.
Bennett, S.J. and Best, J.L. (1995) Mean flow and turbulence structure over fixed, two-dimensional dunes: implications for sediment transport and bedform stability. Sedimentology 42, 491–513.
Best, J. (2005a) The fluid dynamics of river dunes: a review and some future research directions. Journal of Geophysical Research 110, F04S02. DOI: 10.1029/2004jf000218.
Best, J. (2005b) Kinematics, topology and significance of dune-related macroturbulence: some observations from the laboratory and field. In Fluvial Sedimentology VII (eds M.D. Blum, S.B. Marriott and S. LeClair), International Association of Sedimentologists Special Publication 35, 41–60.
Best, J. and Kostaschuk, R.A. (2002) An experimental study of turbulent flow over a low-angle dune. Journal of Geophysical Research 107, 3135.
Best, J., Kostaschuk, R.A. and Villard, P. (2001) Quantitative visualization of flow fields associated with alluvial sand dunes: results from the laboratory and field using ultrasonic and acoustic doppler anemometry. Journal of Visualization 4, 373–381.
Cellino, M. and Lemmin, U. (2004) Influence of coherent flow structures on the dynamics of suspended sediment transport in open-channel flow. Journal of Hydraulic Engineering 130, 1077–1088.
Coleman, J.M. (1969) Brahmaputra river: channel processes and sedimentation. Sedimentary Geology 3, 129–239.
Coleman, S.E. and Nikora, V.I. (2011) Fluvial dunes: initiation, characterization, flow structure. Earth Surface Processes and Landforms 36, 39–57.
Czuba, J.A., Oberg, K.A., Best, J. et al. (2011) Temporal characteristics of coherent flow structures generated over alluvial sand dunes, Mississippi River, revealed by acoustic Doppler current profiling and multibeam echo sounding. River, Coastal and Estuarine Morphodynamics (RCEM), Proceedings of the Conference held in Beijing, 6–8 September 2011: 1–6, http://hydroacoustics.usgs.gov/publications/Final-RCEM-ADCP-Dunes.pdf (accessed 25 March 2013).
Deines, K.L. (1999) Backscatter estimation using Broadband acoustic Doppler current profilers. Oceans 99 MTS/IEEE, San Diego, 13–16 September 1999, pp. 249–253, http://ieeexplore.ieee.org/xpls/abs_all.jsp?arnumber=755249 (accessed 25 March 2013).
Driver, D.M., Seegmiller, H.L. and Marvin, J.G. (1987) Time-dependent behavior of a reattachment shear layer. American Institute of Aeronautics and Astronautics Journal 25, 914–919.
Dyer, K.R. (1997) Estuaries: A Physical Introduction, John Wiley & Sons, Ltd, Chichester.
Gartner, J.W. (2004) Estimating suspended solids concentrations from backscatter intensity measured by acoustic Doppler current profiler in San Francisco Bay, California. Marine Geology 211, 169–187.
Gordon, C.M. (1975) Sediment entrainment and suspension in a turbulent tidal flow. Marine Geology 18, M57–M64.
Grabemann, I., Kappenberg, J. and Krause, G. (1995) Aperiodic variations of the turbidity maxima of two German coastal plain estuaries. Aquatic Ecology 29, 217–227.
Hill, D.C., Jones, S.E. and Prandle, D. (2003) Derivation of sediment resuspension rates from acoustic backscatter time-series in tidal waters. Continental Shelf Research 23, 19–40.
Hoitink, A.J.F. and Hoekstra, P. (2005) Observations of suspended sediment from ADCP and OBS measurements in a mud-dominated environment. Coastal Engineering 52, 103–118.
Holdaway, G.P., Thorne, P.D., Flatt, D. et al. (1999) Comparison between ADCP and transmissometer measurements of suspended sediment concentration. Continental Shelf Research 19, 421–441.
Itakura, T. and Kishi, T. (1980) Open Channel Flow with Suspended Sediment on Sand Waves. International Association of Hydraulic Research, Third International Symposium on Stochastic Hydraulics, Tokyo, Japan, pp. 589–598.
Jackson, R.G. (1976) Sedimentological and fluid-dynamic implications of the turbulent bursting phenomenon in geophysical flows. Journal of Fluid Mechanics 77, 531–560.
Kappenberg, J. and Grabemann, I. (2001) Variability of the mixing zones and estuarine turbidity maxima in the Elbe and Weser estuaries. Estuaries and Coasts 24, 699–706.
Kappenberg, J., Schymura, G. and Fanger, H.U. (1995) Sediment dynamics and estuarine circulation in the turbidity maximum of the Elbe river. Aquatic Ecology 29, 229–237.
Kerner, M. (2007) Effects of deepening the Elbe Estuary on sediment regime and water quality. Estuarine, Coastal and Shelf Science 75, 492–500.
Kostaschuk, R.A. (2000) A field study of turbulence and sediment dynamics over subaqueous dunes with flow separation. Sedimentology 47: 519–531.
Kostaschuk, R.A. and Best, J. (2005) Response of sand dunes to variations in tidal flow: Fraser Estuary, Canada. Journal of Geophysical Research 110, F04S04, DOI: 10.1029/2004jf000176.
Kostaschuk, R.A., Best, J., Villard, P. et al. (2005) Measuring flow velocity and sediment transport with an acoustic Doppler current profiler. Geomorphology 68, 25–37.
Kostaschuk, R.A. and Church, M.A. (1993) Macroturbulence generated by dunes: Fraser River, Canada. Sedimentary Geology 85, 25–37.
Kostaschuk, R.A. and Villard, P. (1996) Flow and sediment transport over large subaqueous dunes: Fraser River, Canada. Sedimentology 43, 849–863.
Kostaschuk, R.A. and Villard, P. (1999) Turbulent Sand Suspension over Dunes. In: Fluvial Sedimentology VI (eds N.D. Smith and J. Rogers), International Association of Sedimentologists Special Publication 28, 1–13.
Lapointe, M. (1992) Burst-like sediment suspension events in a sand bed river. Earth Surface Processes and Landforms 17, 253–270.
Lefebvre, A., Ernstsen, V.B. and Winter, C. (2011) Influence of compound bedforms on hydraulic roughness in a tidal environment. Ocean Dynamics 61, 2201–2210. DOI: 10.1007/s10236-011-0476-6.
Levi, E. (1983) A Universal Strouhal Law. Journal of Engineering Mechanics 109, 718–727.
Lu, S.S. and Willmarth, W.W. (1973) Measurements of the structure of the Reynolds stress in a turbulent boundary layer. Journal of Fluid Mechanics 60, 481–511.
Lu, Y. and Lueck, R.G. (1999) Using a Broadband ADCP in a tidal channel. Part II: Turbulence. Journal of Atmospheric and Oceanic Technology 16, 1568–1579.
Matthes, G.H. (1947) Macroturbulence in natural stream flows. Transactions of the American Geophysical Union 28, 255–262.
McLean, S.R., Nelson, J.M. and Wolfe, S.R. (1994) Turbulence structure over two-dimensional bed forms: Implications for sediment transport. Journal of Geophysical Research 99, 12 729–12 747.
Nezu, I. and Nakagawa, H. (1993) Turbulence in Open-Channel Flows, Balkema, Rotterdam.
Paarlberg, A.J., Dohmen-Janssen, C.M., Hulscher, S.J.M.H. and Termes, P. (2009) Modeling river dune evolution using a parameterization of flow separation. Journal of Geophysical Research 114, F01014, DOI: 10.1029/2007jf000910.
Rao, K.N., Narasimha, R. and Narayanan, M.a.B. (1971) The ‘bursting’ phenomenon in a turbulent boundary layer. Journal of Fluid Mechanics 48, 339–352.
RD Instruments. (2008) ADCP coordinate transformation formulas and calculations. Technical Report, P/N 951-6079-00. San Diego, RD Instruments.
Rood, K.M. and Hickin, E.J. (1989) Suspended-sediment concentration and calibre in relation to surface-flow structure in Squamish River estuary, southwestern British Columbia. Canadian Journal of Earth Sciences 26, 2172–2176.
Shugar, D.H., Kostaschuk, R.A., Best, J.L. et al. (2010) On the relationship between flow and suspended sediment transport over the crest of a sand dune, Río Paraná, Argentina. Sedimentology 57, 252–272.
Simpson, R.L. (1989) Turbulent boundary layer separation. Annual Review of Fluid Mechanics 21, 205–234.
Soulsby, R.J. (1980) Selecting record length and digitization rate for near-bed turbulence measurements. Journal of Physical Oceanography 10, 208–219.
Strouhal, V. (1878) Ueber eine besondere Art der Tonerregung. Annalen der Physik 241, 216–251.
Svenson, C., Ernstsen, V.B., Winter, C. et al. (2009) Tide-driven sediment variations on a large compound dune in the Jade tidal inlet channel. Journal of Coastal Research SI56, 361–365.
Thorne, P.D., Hardcastle, P.J., Flatt, D. and Humphery, J.D. (1994) On the use of acoustics for measuring shallow water suspended sediment processes. IEEE Journal of Oceanic Engineering 19, 48–57.
Urick, R.J. (1948) The absorption of sound in suspensions of irregular particles. Journal of the Acoustical Society of America 20, 283–289.
Venditti, J.G. and Bauer, B.O. (2005) Turbulent flow over a dune: Green River, Colorado. Earth Surface Processes and Landforms 30, 289–304.
Venditti, J.G. and Bennett, S.J. (2000) Spectral analysis of turbulent flow and suspended sediment transport over fixed dunes. Journal of Geophysical Research 105, 22035–22047.
Winter, C., Katoshevski, D., Bartholomä, A. and Flemming, B.W. (2007) Grouping dynamics of suspended matter in tidal channels. Journal of Geophysical Research 112, C08010, DOI: 10.1029/2005JC003423.
Yalin, M.S. (1992) River Mechanics. Oxford, Pergamon Press.