18
Coherent Secondary Flows over a Water-Worked Rough Bed in a Straight Channel
ABSTRACT
Results are presented from a series of laboratory experiments to investigate the development of coherent secondary flow cells in a 2 m wide, straight open channel over a rough, water-worked bed, a bed condition more representative of natural channels compared to the fixed beds used in previous studies. Flow velocities were measured in three dimensions using particle image velocimetry (PIV) across the half-width of the channel. Before measurements were taken, the bed was water-worked to produce a stable armour layer with a median surface grain diameter of ∼20 mm. Three flow conditions were analysed with width-to-depth ratios (b/h) of 5, 10 and 20. The results show that the flow cannot be assumed to be two-dimensional, even for wide channels, over water worked gravels. Coherent secondary flows cells were found across the entire channel with an average width of 1.15h and a time-averaged magnitude of approximately 1.6–3.6% of the bulk mean velocity. These cells are responsible for significant redistribution of the mean flow and turbulent kinetic energy. Previously it has been found that the ‘surface vortex’ near the channel bank dominates in channels with a fixed rough bed. The results presented here show that the ‘bottom vortex’ dominates over a water-worked gravel bed. This has implications for the near-bed flow direction and strength, which may be important for bank stability. For the narrow channel (b/h = 5), the secondary flow weakens towards the centreline, whilst in the wider channel (b/h = 20) secondary flows strengthen towards the centreline. Hence, the corner cell may not be responsible for propagating coherent secondary flow cells out from the channel wall to the centreline.
18.1 Introduction
It is a frequent assumption that flow in wide channels is two-dimensional and that the effects of secondary flow on turbulence near the centre of straight experimental channels is negligible (Nikora and Roy, 2012). However, secondary flows are common in natural river channels and laboratory flumes and may result in significant redistribution of mean and turbulent flow momentum. Prandtl (1952) classified secondary flows into two categories: (i) skew-induced, where the mean flow field is skewed due to channel curvature and/or a transverse pressure gradient; and (ii) turbulence-induced, produced by turbulence anisotropy in the cross-stream plane of the channel. Secondary flows in straight channels are produced by Prandtl's second mechanism as there is no channel curvature to skew the velocity field. Turbulence-induced secondary flows in straight channels are an important type of large-scale coherent flow structure because they redistribute flow momentum in the cross-stream plane of the channel, despite their small magnitude. This effect produces lateral variations in streamwise velocity and bed shear stress. The result of this spatial variability in flow can be the development of distinct lateral sediment sorting patterns and/or variations in bed topography.
In narrow, straight channels where b/h < 5, secondary flows are known to be driven by the corner-effect due to the anisotropy of turbulence between the perpendicular surfaces at the edge of the channel. In closed ducts, the secondary flows that develop in the corner (Figure 18.1a) are symmetrical about the corner bisector (e.g. Brundett and Baines, 1964; Gessner and Jones, 1965; Perkins, 1970). However in open channels, the upper vortex is known to be enhanced due to the damping of vertical velocity fluctuations at the water surface (e.g. Naot and Rodi, 1982; Nezu and Rodi, 1985; Nezu et al., 1989; Tominaga et al. 1989). As a result the bottom vortex is weakened (Figure 18.1b). Naot (1984) demonstrated that differences in wall and bed roughness may change the relative strength of the corner cells (Figure 18.1c and d). Using numerical simulations of a straight narrow channel with b/h = 4, Naot (1984) found that the surface vortex was strengthened relative to the bottom vortex and that flow velocity along the wall almost doubled in the case of a smooth wall and rough bed. McLelland et al. (1999) measured the flow pattern over mobile sand-sized sediments in a narrow channel (b/h = 3). Results showed the dominance of the surface vortex near the sidewall with a rough stripe adjacent to the smooth channel wall.
Figure 18.1 Sketches showing coherent secondary flow cells (a) flow in the corner of a square duct (e.g. Naot and Rodi, 1982); (b) flow in the corner of an open channel (e.g. Naot and Rodi, 1982); (c) and (d) show the results from Naot (1984) for channels with a rough bed and smooth wall, and a smooth bed and rough wall with the large arrow indicating stronger flow along the wall in the former and stronger flow along the bed in the latter; (e) and (f) show the expected flow pattern according to Rodriguez and Garcia (2008) for a channel with a smooth or rough bed and a smooth wall.
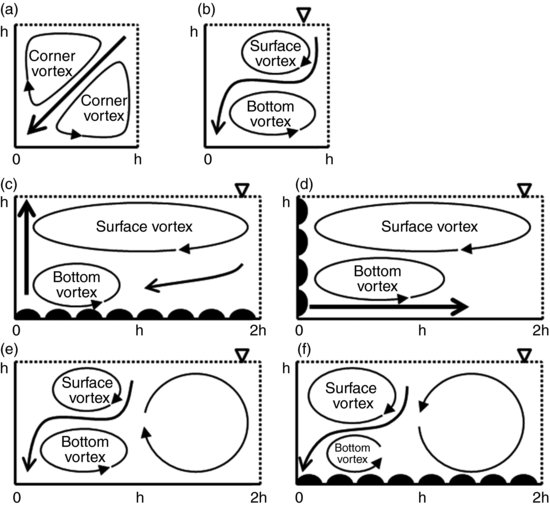
Figure 18.2 Schematic diagram showing layout of flume in plan view.

In narrow channels (b/h < 5), the dominant corner cell induces a counter-rotating vortex that extends towards the channel centreline (cf. Figure 18.1e). However, the influence of the corner cell is thought to diminish with distance from the wall in smooth bed channels. In wide channels where b/h > 5 Nezu and Nakagawa (1993) suggested that a reinforcing mechanism is required for secondary flows to extend beyond z/h ∼ 2.5. This reinforcing mechanism may be alternating bed roughness and/or topography over the cross-section which has been studied using artificial roughness stripes (e.g. Mclean, 1981; Müller and Studerus, 1979; Nezu and Nakagawa, 1993; Choi et al., 2007). Müller and Studerus (1979), for example, investigated flow in a channel with b/h = 7.5, a smooth strip next to the channel wall and a rough strip in the middle of one half of the channel. Flow measurements showed little evidence of the surface vortex and dominance of the bottom vortex in the channel corner. Wang and Cheng (2005) studied a channel with b/h = 8 and a stripe spacing of 1h with a coarse stripe of 0.5h adjacent to a smooth wall. In this case the bottom vortex dominated the weaker surface vortex near the channel corner, with the cross-section pattern of flow producing upwelling over smoother stripes and downwelling over rougher stripes. Choi et al. (2007) used numerical simulations to investigate the same channel configurations as Müller and Studerus (1979) and Wang and Cheng (2005). Their results confirmed the structure of secondary flows over artificial bed roughness stripes.
In the absence of imposed lateral variations in topography and/or roughness, two mechanisms are possible for the lateral propagation of secondary cells. The first is the spanwise growth of roughness-induced coherent secondary flows outwards from the channel corner. In this case, corner-generated secondary flows produce longitudinal stripes or bedforms adjacent to the channel wall and these stripes/bedforms generate additional roughness-induced secondary cells, resulting in further longitudinal sorting such that the stripes/bedforms propagate laterally towards the channel centreline (e.g. Nezu and Rodi, 1985). The second mechanism is that natural variations in bed roughness and/or topography become amplified in conjunction with nonuniform cross-stream distributions of Reynolds shear stress. Variations in roughness and/or topography amplify the nonuniform lateral distribution of Reynolds stresses producing secondary flows that lead to sediment sorting and/or longitudinal bedforms which grow by positive feedback (e.g. Ikeda, 1981, Colombini, 1993; Colombini and Parker, 1995).
Experiments by Tominaga et al. (1989) on rectangular channels with b/h = 8 and different fixed roughness treatments on the bed and walls, showed that, with smooth walls and bed, there was strong secondary circulation near the side walls, with a steady decay toward the centre of the channel and the surface vortex notably weaker than the bottom vortex. For the same width-to-depth ratio a rough bed and smooth wall produced a stronger surface vortex and secondary flow cells over the entire cross-section. Tominaga et al. (1989) suggested that slight irregularities in bed roughness produced an effect similar to alternating stripes of smooth and rough bed material.
Several recent studies have also shown the existence of secondary flow cells across the entire width of rectangular channels without lateral changes in bed roughness for b/h values from ∼6 to 20. For example, Rodriguez and Garcia (2008) performed experiments over an unsorted, coarse gravel bed (d50 = 5.7 mm) with smooth sidewalls and found that the surface vortex dominated in the corner (Figure 18.1f) and that secondary flow cells propagated out from the channel corner towards the centreline for channels with b/h of 6.3 and 8.5. Blanckaert et al. (2010) conducted experiments in a straight channel with a fixed bed (d50 = 2 mm) that was not fully rough and also found that the surface vortex dominated for channel configurations ranging from b/h of 6.2 to 11.9. They also suggested that secondary flow can be maintained across the channel width as long as the bed is sufficiently rough to deform the vertical velocity profiles. Albayrak and Lemmin (2011) used fixed-bed roughness (d50 = 15 mm) in channels with b/h of 12.25, 15 and 20 with smooth sidewalls. Although they did not measure flows closer to the wall than z/h ∼1.5, they inferred that the surface vortex dominated and increased in size relative to the bottom vortex as b/h increased. Rodriguez and Garcia (2008) did not find a weakening of the secondary currents from the wall to the centreline, in contrast to Blanckaert et al. (2010), who found a slight weakening, and Albayrak and Lemmin (2011), who found that secondary flow weakened such that it was ‘weak’ or nonexistent at the centreline.
Rodriguez and Garcia (2008) suggest that the dominance of the surface or bottom vortex is important for bank stability and the design of in-channel structures because the location of downwelling changes with the relative roughness between the bed and banks (Figures 18.1e and f). However, there are conflicting results regarding whether the surface or bottom vortex dominates. Fixed roughness stripes show the dominance of the bottom vortex (Müller and Studerus, 1979; Wang and Cheng, 2005; Choi et al., 2007) whereas uniform fixed roughness across the channel leads to the dominance of the surface vortex (Tominaga et al., 1989; Rodriguez and Garcia, 2008; Blanckaert et al., 2010; Albayrak and Lemmin, 2011). The use of fixed-bed roughness also ignores the effects of variations in bed topography and/or structure on the resulting flow patterns.
Cooper and Tait (2009) show that simple screeded beds (Like those used by Rodriguez and Garcia, 2008; Blanckaert et al., 2010; Albayrak and Lemmin, 2011), tend to have a random surface structure. However, the surface topography and preferential particle orientations found in natural river channels (e.g. Butler et al., 2001; Aberle and Nikora, 2006) are better represented by a bed that has been water-worked for a period of time or until a static armour has formed on the surface. The impact of a more natural bed topography and particle orientations on the development of secondary flow cells over coarse gravel beds has not previously been studied.
The aim of this research is to complement and broaden previous studies of coherent secondary flow cells in straight rectangular channels by investigating flow structure over a water-worked rough bed that is more representative of natural channel beds. This is particularly important for understanding how secondary flows develop in natural channels and has implications for bank stability in river restoration projects (e.g. Rodriguez and Garcia, 2008). Results are presented from measurements over a water-worked, armoured bed to investigate cross-stream flow patterns for b/h values of 5, 10 and 20 (respectively ‘narrow’, ‘intermediate’ and ‘wide’). For each configuration, detailed three-component velocities were measured using Particle image velocimetry (PIV) over a complete channel half-width showing the mean and turbulent flow structure. These data are used to investigate whether the surface or bottom vortex dominates, the pattern of secondary flow cells and their relative strength and the impact on the distribution of turbulence.
18.2 Methods
18.2.1 Experimental arrangement and test conditions
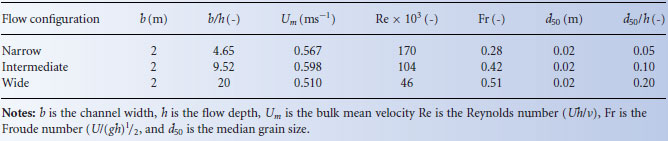
Experiments were conducted in the Total Environment Simulator flume facility at the University of Hull. The flume tank is 16 m long and 6 m wide. Movable walls were used to construct a channel 11 m long and 2 m wide within the flume tank (Figure 18.2). The flume was operated in closed-loop recirculation, therefore the flow depth during an experiment was controlled by the water fill depth, with a vertical weir to control the water surface slope and ensure that equilibrium conditions were maintained. The bed slope of the flume was fixed; therefore the slope was set by grading a layer of coarse bed sediments that filled approximately the bottom 0.2 m of the flume. These sediments were water-worked prior to measurements being taken (see Section 18.2.2). To enable measurement of the flow using particle image velocimetry (PIV), a 2 m long Perspex window was installed in the flume wall between 6 and 8 m downstream of the inlet. All measurements were taken in this region, where the flow is uniform and the boundary layer is fully developed with the water surface slope being parallel to the bed. To enable different width-to-depth ratios to be studied, experiments were conducted using three different flow depths. Table 18.1 summarizes the experimental conditions.
Table 18.1 Flow conditions for the present experiments.
18.2.2 Water-worked gravel bed
To produce a bed surface with a topography and particle orientations that are more representative of a natural bed (cf. Cooper and Tait, 2009), the bed was water-worked at the intermediate flow depth described in Table 18.1. Previous experiments by McLelland et al. (1999) in a narrow channel with a mobile sand bed showed that changes in bed topography and bed roughness reinforced the secondary flow pattern expected for a channel with b/h < 5. Albayrak and Lemmin (2011) found that the number of secondary cells over a fixed rough bed in wider channels did not change with Reynolds number and they suggest that number of cells is controlled by only the width-to-depth ratio. Therefore the number of secondary flow cells during the water-working phase, which requires a higher discharge, was expected to be the same as when PIV measurements were taken at the lower flow rate.
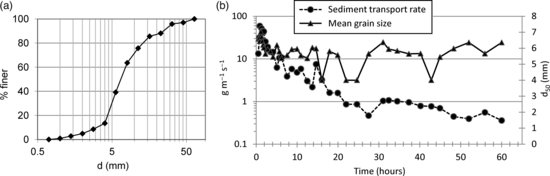
The bed material was screeded to produce a bed slope of 5 × 10⁻³. Then the bed was water-worked using a flow depth of 0.22 m, discharge of 0.34 m3s−1, mean velocity of 0.756 ms−1 and bed shear stress of 9 N m−2. Figure 18.3a shows the grain size distribution of the initial sediment mixture. The d50 is ∼10 mm. The armouring processes took place over a period of 60 hours, during which the sediment transport rate declined exponentially from ∼50 gm−1s−1 to ∼0.5 gm−1s−1. During the armouring process the d50 of the transported material remained more-or-less constant at about 5 mm with d16 and d84 of 4 and 10 mm respectively. At the end of the process, the d50 and d90 of the surface layer increased to approximately 20 and 30 mm respectively (measured from a surface layer just downstream of the measurement section, removed at the end of the experiment). There was no sediment input during the armouring phase and the slope decreased to 1.5 × 10⁻³ with a scour hollow developing at the upstream end. This scour hollow was infilled with coarse gravel to maintain uniform flow conditions throughout the test section when flow measurements were taken.
Figure 18.3 (a) Grain size distribution of bed material before water-working the bed. (b) Changes in sediment transport rate and median grain size (d50) of transported material during bed armouring.
18.2.3 Particle image velocimetry (PIV) flow measurement
Particle image velocimetry measurements were taken using a submersible system designed to measure three components of flow in a plane orthogonal to the primary flow direction in the channel. The configuration of the PIV system is shown in Figure 18.2, with a laser mounted symmetrically between two cameras. The 120 mJ New Wave Nd:Yag pulsed laser is located above the flume. A pair of mirrors inside a light guide carry the focused light beam to a set of optics below the water surface that produce a light sheet with a thickness of approximately 5 mm, which is aligned perpendicular to the flow direction. Two Kodak ES1.0 cameras (8-bit, 1016 × 1008 pixel CCD chip) are located within a submersible housing with remote control for the focus, aperture and Schiempflug angle and two mirrors that enable the cameras to image the same region of flow, which is illuminated by the light sheet. The image dimensions are approximately 0.2 m in the vertical and 0.4 m in the cross-stream direction at a distance of about 0.9 m from the front of the laser optics. This configuration enabled PIV measurements to be obtained from the centre of the channel when the laser is next to the Perspex window. The cameras and light sheet are mounted on a traverse system with 1 m travel in all three directions, which enables the location of the measurement plane to be moved across half the channel, from the centreline to the channel wall.
Measurements were obtained at 10 Hz for 5 minutes at each location (3000 image pairs per camera). The two-component vector maps from each camera were combined to produce a three-component vector map with a uniform cell size using a calibration expression acquired by imaging a double-sided two-level target with a regular pattern of dots which was co-located with the light sheet prior to flow measurements. The results presented were obtained using Dantec PIV processing software (Flow Manager) using only valid vectors derived from adaptive correlation using a 32 × 32 pixel window. The transformed vector map had a cell size of 2 × 1 cm in the cross-stream and vertical planes respectively. This yielded 10, 20 and 40 vectors in the vertical plane for the wide, intermediate and narrow flow conditions respectively and 100 vectors in the horizontal plane once the image maps were combined. Resultant velocity vectors with a standard error greater than 0.5% of vector length were rejected to minimize any errors. To produce a complete flow map across the channel half-width, eight image maps starting at z = 0 were collected with 0.1 m spacing, with a final image map at z = 0.85 m. These flow maps were combined using a general kriging interpolation. A second set of images was collected 0.2 m higher above the bed for the narrow flow condition.
The magnitude of secondary flow velocities within a straight channel is only a small proportion of the streamwise velocity component, therefore any small misalignment of the laser light sheet in the cross-stream plane can result in errors in the secondary flow field. The effect of any misalignment increases with distance away from the origin of the laser. Therefore, for each image map, only the half closest to the laser was used. Since the complete flow field covered at least 90% of the channel half-width, the resultant velocities were corrected so that there was zero discharge in cross-stream and vertical directions to ensure mass conservation. The correction angles in the horizontal and vertical planes were less than 0.64° and 0.19° respectively. In the following analysis x, y and z refer to the streamwise, vertical and spanwise directions; u, v and w refer to time-averaged mean velocities. Turbulent kinetic energy (TKE) was calculated using 0.5(u' 2+v' 2+w' 2), where u′, v′ and w′ are the root mean squares of the velocity fluctuations.
To evaluate uncertainties in the streamwise velocity and show that the flow was fully developed, the mean vertical velocity profile for the central 0.2 m of the channel was compared to the law of the wall for hydraulically rough conditions:
(18.1) 
where  is the shear velocity,
  is the von Kármán constant and ks is the roughness length scale. Rodriguez and Garcia (2008) demonstrated that streamwise velocities in a straight channel could be collapsed using this relation. Following the method of Rodriguez and Garcia (2008) ks was defined as d90 and the position of the bed and local value of
  were found using the solver function in Microsoft Excel. Results show that the average error in streamwise velocity is ∼1.5% compared to the law of the wall. Comparison of TKE measurements within 0.2 m of the centreline with the reference data of Nezu and Nakagawa (1993) using the local shear stress, indicate that for y/h > 0.2 average errors in TKE are ∼20%. This is similar to the uncertainty in TKE reported by Blanckaert et al. (2010). Differences compared to Nezu and Nakagawa (1993) increase towards the bed since the reference data do not account for roughness (Hurther and Lemmin, 2001).
18.3 Results
18.3.1 Streamwise flow velocities
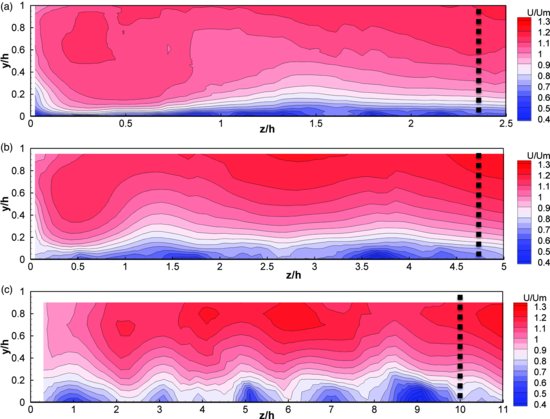
Figure 18.4 shows the cross-stream distribution of dimensionless streamwise velocities (u), normalized by the bulk mean flow velocity (Um), for each flow depth. For the narrow channel configuration (Figure 18.4a), there is a clear bulge in the streamwise velocities towards the channel wall and an upwelling of lower streamwise velocities at about z/h = 1. Towards the channel centreline, higher streamwise velocities gradually extend down towards the bed. There is a similar bulge of higher streamwise velocities into the channel corner at the intermediate flow depth (Figure 18.4b) and then a downwelling of higher streamwise velocities near the middle of the channel half-width and also at the centreline. The distribution of velocities near the centreline indicates that the flow may not be perfectly symmetrical about the channel centre. For the wide channel configuration (Figure 18.4c) there is some evidence of a bulge towards the channel corner and clear evidence of a periodic variation in the streamwise velocity between the channel wall and the centreline.
Figure 18.4 Cross-stream distribution of streamwise velocities, made dimensionless using Um, for the (a) narrow channel (b/h = 4.65); (b) intermediate channel (b/h = 9.52); and (c) wide channel (b/h = 20). The vertical dashed line indicates the centreline location for each flow depth.
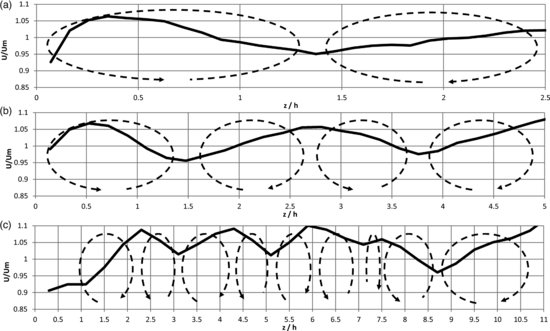
Regions of upwelling and downwelling flow can be identified using the vertically averaged mean flow velocities. Lower than average vertically averaged velocities represent upwelling where lower velocity bottom fluid is transported upwards, whereas higher than average vertically averaged velocities represent downwelling where higher velocity surface fluid converges and is carried down towards the bed. Figure 18.5 shows the cross-stream distribution of dimensionless vertically averaged velocities for each flow depth. It shows an alternating pattern of downwelling and upwelling indicating a series of counter-rotating secondary flow cells. For the narrow, intermediate and wide channels the total number of cells across the channel half-width is 2, 4, and 9 respectively. The average width of the secondary flow cells is ∼1.15h. In all cases the secondary flow cell in the channel corner is slightly wider with a width of ∼1.5h and the cell nearest the middle of the channel is also larger for both the intermediate and wide channel cases.
Figure 18.5 Cross-stream variation in vertically-averaged streamwise velocities made dimensionless using the bulk mean velocity for the (a) narrow channel (b/ h = 4.65); (b) intermediate channel (b/h = 9.52); and (c) wide channel (b/h = 20). The dashed lines with arrows show the inferred pattern of secondary flow circulation (see text for details).
18.3.2 Secondary flow velocities
The pattern of secondary flow at each flow depth is shown using combined vector and vorticity plots in Figures 18.6–18.8. The velocity vectors have been made dimensionless using the bulk mean velocity and the dimensionless vorticity has been calculated as 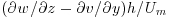 . For the narrow channel (Figure 18.6), the vectors and vorticity distribution clearly show the dominance of a large anticlockwise rotating cell near the channel corner which persists to z/h ∼ 1.5. Towards the middle of the channel, the secondary flow strength is considerably weaker and there is not a clear circulation cell, but there is a general movement of flow towards the channel wall near the surface and towards the centreline near the bed. For the intermediate channel (Figure 18.7), there is a large anticlockwise rotating cell near the channel corner, and also some evidence of a small clockwise rotating cell near the channel wall towards the water surface. Towards the channel centreline there is a pair of counter-rotating secondary flow cells identifiable with downwelling near the centreline; however there is limited evidence for a clockwise rotating cell between the two anticlockwise rotating cells. For the wide channel (Figure 18.8), the secondary flow pattern is not as clear as for the deeper flows, partly due to the reduced number of vertical measurement cells since the spacing of the velocity vector measurements is constant for all three sets of measurements. As with the narrow and intermediate flow depths, an anticlockwise flow rotation can be identified near the channel corner. Towards the channel centreline a pattern of five counter-rotating secondary flow cells can be recognized, although the dominant pattern is of flow upwelling and downwelling in certain regions. The bottom recirculation of flow is unclear due to either this flow being confined to a very narrow layer near the bed or bed roughness elements obscuring the bottom flow region.
Figure 18.6 Secondary flow circulation in narrow channel: (a) secondary flow vectors and contours of vorticity, made dimensionless using Um and h/Um respectively; and (b) interpreted pattern of secondary flow cells based on pattern shown by vectors and distribution of vorticity with the secondary flow strength indicated by the relative thickness of the lines.
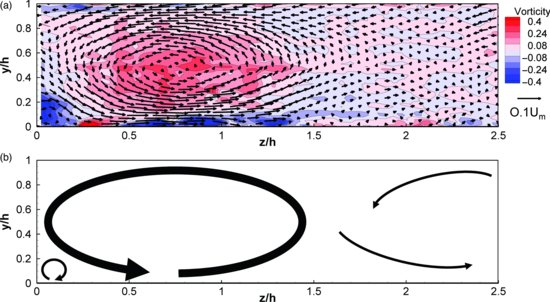
Figure 18.7 Secondary flow circulation in intermediate channel: (a) secondary flow vectors and contours of vorticity, made dimensionless using Um and h/Um respectively; and (b) interpreted pattern of secondary flow cells based on pattern shown by vectors and distribution of vorticity with the secondary flow strength indicated by the relative thickness of the lines.
Figure 18.8 Secondary flow circulation in wide channel: (a) secondary flow vectors and contours of vorticity, made dimensionless using Um and h/Um respectively; and (b) interpreted pattern of secondary flow cells based on pattern shown by vectors and distribution of vorticity with the secondary flow strength indicated by the relative thickness of the lines.
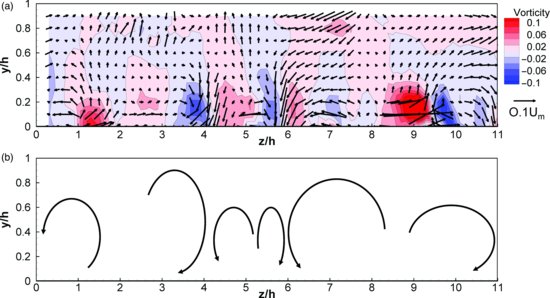
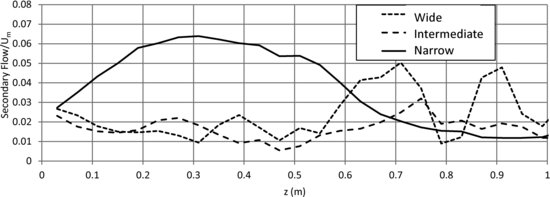
Figure 18.9 shows the vertically averaged lateral variation in secondary flow magnitude from the channel wall to the centreline. The average secondary flow strength for the narrow, intermediate and wide channels is 3.6%, 1.6% and 2.8% respectively of the bulk mean velocity. The strongest secondary flow velocities (6%) are associated with the corner cell in the narrow channel and, for this flow configuration, the secondary flow strength diminishes significantly towards the centreline. In the intermediate channel, there is little cross-stream variation in secondary flow strength whilst for the wide channel the strongest secondary flows are found towards the channel centreline.
Figure 18.9 Lateral variations in secondary flow ( ) normalized by Um.
18.3.3 Turbulence
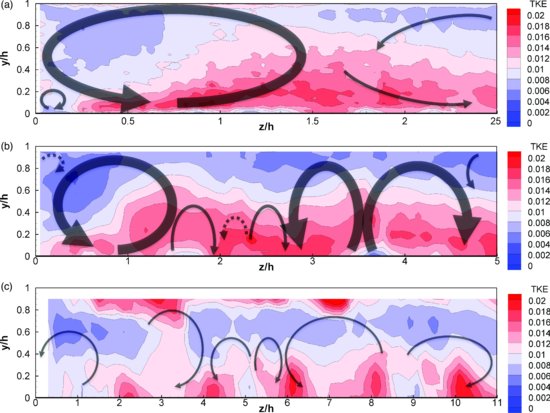
Figure 18.10 shows the distribution of turbulent kinetic energy (TKE) calculated using 0.5(u' 2+v' 2+w' 2) and made dimensionless using Um2. The upward bulges in TKE are generally associated with upwelling flow as shown by the superimposed outline of the secondary flow pattern. Downwelling flow tends to suppress the turbulent kinetic energy in the near surface region.
Figure 18.10 Cross-stream distribution of turbulent kinetic energy made dimensionless using Um2 for the (a) narrow channel (b/h = 4.65); (b) intermediate channel (b/h = 9.52); and (c) wide channel (b/h = 20). The arrows superimposed on the contour plots show the secondary flow pattern interpreted from the vectors shown in Figures 6(b), 7(b) and 8(b) for the narrow, intermediate and wide channels respectively.
18.4 Discussion
18.4.1 Secondary flow circulation cells
The results presented in this paper show the development of coherent secondary flow cells over a water-worked, armoured bed for a wide range of width-to-depth ratios in a straight rectangular channel. The results from Rodriguez and Garcia (2008) demonstrated for the first time that coherent secondary flow cells were present across the channel width over rough beds without any lateral sediment sorting or topography. Blanckaert et al. (2010) found that secondary flow cells could only be sustained over the entire width of a fixed bed if the roughness was sufficient to provide transverse oscillations in bed shear stress and turbulent shear stress. Albayrak and Lemmin (2011) found secondary flow cells over a fixed, rough bed for width-depth ratios of up to 20. The results presented in this chapter show that coherent secondary flow cells are also produced over rough water-worked beds (with bed roughness greater than that used in the three studies mentioned above) in channels with width-to depth ratios up to 20. These coherent secondary flow cells are important for redistributing TKE across the channel cross-section (Figure 18.10) and for all three flow configurations it is clear that the turbulent flow structure is not two-dimensional. Downwelling flow at zones of surface flow convergence produce a reduction in TKE towards the channel bed and this is most significant next to the channel wall due to the strong downwelling of flow produced by the bottom vortex. In contrast, areas of bottom flow convergence and upwelling of flow show higher TKE values near the bed and the transport of turbulent flow momentum towards the water surface.
Previous studies have shown the importance of corner flow cells for propagating secondary flow cells across the channel width. Rodriguez and Garcia (2008) found no evidence for the bottom vortex near the channel wall and proposed that the surface vortex was enhanced by strong upward flow along the smooth channel wall. They suggested that the additional strength of the secondary flow in the surface vortex at the channel wall was sufficient to propagate secondary flow cells away from the wall. A similar strong upward flow at a smooth channel wall was also found in numerical experiments by Naot (1984) for a relatively narrow channel (b/h = 4) with a rough bed and smooth sidewall but, for these conditions, Naot found that a weakened bottom cell did still exist. Blanckaert et al. (2010) also found that the surface vortex dominated in rectangular channels with a transitional bed roughness, but suggested that the bottom vortex was still present. Albayrak and Lemmin (2011) inferred that the surface vortex dominated and increased in size relative to the bottom vortex as b/h increased, but they did not measure flows closer to the wall than z/h ∼ 1.5.
Figures 18.6, 18.7 and 18.8 show the opposite result. The bottom vortex dominates near the channel wall and there is little evidence for a surface vortex. Previous work would suggest that the smooth wall in comparison to the rough bed would produce a dominant surface vortex near the channel wall. However, it appears that the bed configuration has strengthened the near bed flow towards the channel centreline, which has enhanced the bottom cell. The dominance of the bottom cell in these experiments is similar to observations in the experiments with fixed roughness stripes conducted by Wang and Cheng (2005) and corroborated by the numerical experiments of Choi et al. (2007). Therefore it is suggested that water working the bed has had a similar effect – to produce a relatively rougher zone and/or a trough near the channel wall. Although detailed measurements of bed morphology are not available, images taken whilst the flume was being filled show that the relief of the bed was slightly lower near the channel wall. This suggests that the development of the secondary flow circulation near the channel wall may be sensitive to bed topography as well as the difference in roughness between the channel wall and bed. McLelland et al. (1999) demonstrated that the interaction of secondary flows with sediment transport over a mobile bed of bimodal sand-sized sediments produced variations in topography and roughness. Downwelling flow at the channel corner and the presence of a small bottom vortex that transported sediment away from the wall resulted in a rougher surface and lower bed topography (of the order of 1 grain diameter). A similar mechanism over the water-worked gravel bed may be sufficient to enhance the bottom vortex as shown in Figures 18.6–18.8.
The bed was water-worked at the same flow depth as used for the intermediate-bed configuration. If there was a feedback mechanism between any variations in topography/and or roughness, it may be expected that the secondary flow pattern for the intermediate flow depth would be strongest. However the secondary flow strength was lowest at this flow depth (Figure 18.9) with the average magnitude of the secondary flow being greater for both the narrower and wider channel. Notably, the bottom vortex also dominated the channel corner for the wide flow configuration when the size of the corner vortex does not necessarily scale with any imposed bed topography or sorting patterns developed from the intermediate flow depth. This suggests that more work is needed to understand fully the mechanisms that generate the corner vortex, hence to understand why either the bottom or surface vortex may dominate.
Nezu and Nakagawa (1993) suggested that the corner effect was key to the development of secondary flow cells and that strong rotation in the channel corner would induce an adjacent counter-rotating cell. The superposition of counter-rotating cells starting from the channel corner is also supported by Albayrak and Lemmin (2011). Blanckaert et al. (2010) suggest that secondary flows propagate across the channel width when the roughness is sufficient to allow transverse variations in bed shear stress and turbulent shear stresses. The results presented in the current study indicate that the mechanisms for propagating secondary flow cells across the channel width may be more complex. In the narrow channel experiment, the corner cell produces the largest secondary flow velocities (Figures 18.6 and 18.9). However, the counter-rotation produced between this corner cell and the centreline is relatively weak, with the secondary flow component diminishing towards 1% of the streamwise flow magnitude beyond z/h = 1.75. This suggests that the corner cell in itself may not be sufficient to produce an adjacent secondary flow cell of similar vorticity.
If the development of a corner cell is responsible for inducing further secondary flow cells across the channel width, it may be expected that the intensity of secondary flow would diminish with distance from the channel wall. A reduction in secondary flow strength with distance from the channel corner is shown by Blanckaert et al. (2010) and by Albayrak and Lemmin (2011); however, in the intermediate channel width experiment in this study the intensity of secondary flow remains almost constant from the wall to the centreline, whilst in the narrow channel, the secondary flow intensity increases towards the centreline. This suggests that the corner effect may not be the sole cause of the secondary flow development between the channel wall and the centreline in wider channels. Also, the flow does not get closer to being 2D as suggested by Albayrak and Lemmin (2011). For the wide channel, the increased secondary flow strength towards the channel centreline suggests that relative roughness may also be important for the secondary flow strength. The importance of roughness for the stability of longitudinal eddies was shown by Schvidchenko and Pender (2001). Potentially the increase in relative roughness for the wide channel in this study may have stabilized longitudinal eddies and strengthened the pattern of secondary flow that was measured near the centreline.
In all the experiments, the size of the corner cell was approximately 1.5h and the average size of the coherent secondary flow cells across the channel width was predicted to be 1.15h based on the vertically averaged streamwise flow velocities. The vertically averaged streamwise velocities clearly show the presence of secondary flow cells. However, in some regions the secondary flow cells predicted in Figure 18.5 were not easily identified from the secondary flow vectors in Figures 18.6–18.8. This may partly be a result of measurement errors due to the small magnitude of the secondary flow component and errors in alignment of the light sheet that are not compensated for in the mass continuity correction. However, it may also be that the secondary flow cells are locally disturbed by bed roughness elements in the measurement location. Also, longitudinal vortices which produce instantaneous secondary currents (e.g. Tamburrino and Gulliver, 1999; Schvidchenko and Pender, 2001) may disrupt the local pattern in places and produce local differences from the mean streamwise pattern.
The vertically averaged streamwise velocities show an oscillation of ±5% across the channel and clearly indicate a significant redistribution of the mean flow momentum across the channel width resulting from coherent secondary flow cells. This suggests that a simple diagnostic test could be used to detect the presence of secondary flow cells within a channel by measuring the mean velocity at 0.2h and 0.8h at a lateral spacing of 0.5h. This would give a rapid indication of whether secondary flows are present and their spacing.
At flow rates competent to move bed material it would be expected that bed topography would be modified to produce longitudinal ridges of relatively finer material and troughs of relatively coarser material in areas of upwelling and downwelling flow respectively. Data from this paper and several recent studies (e.g. Albayrak and Lemmin, 2011) show that width-to-depth ratio controls the number of secondary flow cells and will therefore also control the spacing of the longitudinal bedforms. Rodriguez and Garcia (2008) suggest that the dominance of the bottom vortex rather than the surface vortex would move the zone of downwelling away from the bank from h to 2h (Figure 18.1.1e and f) which could be important for bank stability. But when the bed vortex dominates, bank stability may be affected by the movement of sediment away from the wall and towards the centreline driven by the near-bed flow of the bottom vortex. Increases in flow stage for natural channels (up to bankfull) will be accompanied by a reduction in the width-to-depth ratio. Results from this study suggest that the bottom vortex at the channel wall increases in strength as the width-to-depth ratio decreases (Figure 18.9), further increasing the risk of erosion of bed sediments adjacent to the channel bank. Blanckaert et al. (2010) found that inclined banks also increased the strength of the bottom vortex, particularly for banks that were rougher than the bed. They found that, whilst the increased strength of the bottom vortex reduced the bed shear stress, bank shear stress increased towards the bank toe. It could be argued that in mobile bed situations the near-bed flow of the bottom vortex could transport sediment away from the base of the bank and amplify the impact of higher shear stresses at the bank toe.
18.5 Conclusions
Particle image velocimetry measurements of three-dimensional flow structure in a spanwise plane across a straight channel confirm that flow over water-worked, armoured gravels with width-to-depth ratios of up to 20 cannot be considered as two-dimensional even near the channel centreline. Coherent secondary cells that have dimensions similar to the flow depth are present across the channel width and they cause significant redistribution of the mean flow velocities and TKE. Vertically averaged streamwise velocities show a cross-stream variation of ±5% and can be used to easily identify the presence of secondary flows.
Secondary flow vectors show that the bottom vortex dominates near the channel wall with strong downwelling towards the channel corner and near-bed flow towards the centreline. This is the opposite of results found in channels with fixed beds of uniform roughness. Hence, results from fixed bed experiments need to be treated with caution if they are to be applied to river restoration projects where the bed is mobile. When the bed is mobile, near-bed flow associated with the bottom vortex could remove bed material from near the channel bank and increase the strength of the bottom vortex.
The corner cell may not be responsible for propagating coherent secondary flow cells out from the channel wall to the centreline. Results show that the flow cell adjacent to the corner cell for the narrow channel is significantly weaker and, for the wide channel, secondary flow cells are stronger nearer the channel centre. Although the water-worked bed was developed for the same flow depth as the intermediate case in this study, the fact that the secondary flow cells for the narrow and wide channels scale with the flow depth suggest that any pattern of differential roughness or topography is not the dominant control of the secondary flow cell size, but it may be responsible for local modification of the secondary flow vectors.
18.6 Acknowledgements
The author would like to thank Mike Church and two anonymous referees for their constructive and helpful comments which have significantly improved this chapter. I would also like to thank Luca Mao for setting-up the water-worked bed used for this experiment and Brendan Murphy for his assistance with the flow measurements.
References
Aberle, J. and Nikora, V. (2006) Statistical properties of armored gravel bed surfaces. Water Resources Research 42, W11414. DOI: 10.1029/2005WR004674.
Albayrak, I. and Lemmin U. (2011) Secondary currents and corresponding surface velocity patterns in a turbulent open-channel flow over rough bed. Journal of Hydraulic Engineering 137, 1318–1334.
Blanckaert, K., Duartea, A. and Schleissa, A.J. (2010) Influence of shallowness, bank inclination and bank roughness on the variability of flow patterns and boundary shear stress due to secondary currents in straight open-channels. Advances in Water Resources 33, 1062–1074.
Brundett, E. and Baines, W.D. (1964) The production and diffusion of vorticity in duct flow. Journal of Fluid Mechanics 19, 375–394.
Butler, J.B., Lane, S.N. and Chandler, J.H. (2001) Characterization of the structure of river-bed gravels using two-dimensional fractal analysis. Mathematical Geology 33, 301–330.
Choi S.-U., Park, M. and Kang, H. (2007) Numerical simulations of cellular secondary currents and suspended sediment transport in open-channel flows over smooth-rough bed strips. Journal of Hydraulic Research 45, 829–840.
Colombini, M. (1993) Turbulence driven secondary flows and the formation of sand ridges. Journal of Fluid Mechanics 254, 701–719.
Colombini, M. and Parker, G. (1995) Longitudinal streaks. Journal of Fluid Mechanics 304, 161–183.
Cooper, J.R. and Tait, S.J. (2009) Water-worked gravel beds in laboratory flumes – a natural analogue? Earth Surface Processes and Landforms 34, 384–397.
Gessner, F.B. and Jones, J.B. (1965) On some aspects of fully developed turbulent flow in rectangular channels. Journal of Fluid Mechanics 23, 689–713.
Hurther, D. and Lemmin, U. (2001) A correction method for turbulence measurements with a 3D Acoustic Doppler Velocity Profiler. Journal of Atmospheric and Oceanic Technology 18, 446–458.
Ikeda, S. (1981) Self forced straight channels in sandy beds. Journal of the Hydraulics Division, ASCE 107, 389–406.
McLean, S.R. (1981) The role of non-uniform roughness in the formation of sand ribbons. Marine Geology 42, 49–74.
McLelland, S.J., Ashworth, P.J., Best, J.L. and Livesey, J.R. (1999) Turbulence and secondary flow over sediment stripes in weakly bimodal bed material. Journal of Hydraulic Engineering 125, 463–473.
Müller, A. and Studerus, X. (1979) Secondary flow in an open channel. Proceedings of the 18th Congress of the International Association for Hydraulic Research 3, Cagliari, 19–24.
Naot, D. (1984) Response of channel flow to roughness heterogeneity. Journal of the Hydraulics Division, ASCE 110, 1568–1587.
Naot, D. and Rodi, W. (1982) Calculation of secondary currents in channel flow. Journal of the Hydraulics Division, ASCE 108, 948–968.
Nezu, I. and Nakagawa, H. (1993) Turbulence in Open Channel Flows, A.A. Balkema, Rotterdam.
Nezu, I., Nakagawa, H. and Rodi, W. (1989) Significant difference between secondary currents in closed channels and narrow open channels. Proceedings of the 23rd Congress of the International Association for Hydraulic Research, Ottawa, A125–A132.
Nezu, I. and Rodi, W. (1985) Experimental study on secondary currents in open channel flow. Proceedings of the 21st Congress of the International Association for Hydraulic Research, 2, Melbourne, pp. 19–23.
Nikora, V. and Roy, A.G. (2012) Secondary flows in rivers: theoretical framework, recent advances, and current challenges. In Gravel Bed Rivers: Processes, Tools, Environments (eds M. Church, P.M. Biron and A.G. Roy). John Wiley & Sons, Ltd, Chichester, pp. 3–22.
Perkins, H.J. (1970) The formation of streamwise vorticity in turbulent flow. Journal of Fluid Mechanics 44, 721–740.
Prandtl, L. (1952) Essentials of Fluid Dynamics, Blackie & Son, London.
Rodríguez J.F. and Gárcia M.H. (2008) Laboratory measurements of 3-D flow patterns and turbulence in straight open channel with rough bed. Journal Hydraulic Research 46, 454–465.
Schvidchenko, A.B. and Pender, G. (2001) Macroturbulent structure of open-channel flow over gravel beds. Water Resources Research 37, 709–719.
Tamburrino, A. and Gulliver, J.S. (1999) Large flow structures in a turbulent open channel flow. Journal Hydraulic Research 37, 363–380.
Tominaga, A., Nezu, I., Ezaki, K. and Nakagawa, H. (1989) Three dimensional turbulent structure in straight open channel flows. Journal Hydraulic Research 27, 149–173.
Wang, Z.Q. and Cheng, N.S. (2005) Secondary flows over artificial bed strips. Advances in Water Resources 28, 441–450.