19
Coherent Flow Structures, Initiation of Motion, Sediment Transport and Morphological Feedbacks in Rivers
ABSTRACT
Erosion, transportation and deposition of sediments and pollutants influence the hydrosphere, pedosphere, biosphere and atmosphere in profound ways. Even though the dynamic interaction between fluctuating turbulent fluid forces and particle dislodgement constitutes a central problem in earth surface dynamics it is currently inadequately understood. As a result, the criterion presently in use for predicting particle entrainment, originally proposed by Shields (1936), emphasizes the time-averaged boundary shear stress and therefore cannot account for the fluctuating forces encountered in turbulent flows. Prior studies have emphasized the significance of the magnitude of the peak instantaneous fluid forces on particle movement. Furthermore, they have advocated that the use of such a criterion is necessary to overcome the limitations of, and improve upon the predictions based on, the temporally and spatially averaged force methodologies. Identifying the flow structures that generate such peak forces has therefore become an active area of research during the last 25 years. It is demonstrated here that this latest understanding regarding the mechanism responsible for the initiation of motion is incapable of explaining the phenomenon, leading to the particle dislodgement paradox concept. A new criterion that was developed recently is suggested in an effort to overcome the limitations of the previous approaches and resolve this paradox. It is demonstrated here that, in addition to the magnitude, the duration of energetic near bed turbulent flow events is equally important in predicting grain removal from the bed surface. It is therefore proposed that the product of force and its duration, or impulse, is a more appropriate and universal criterion for uniquely identifying conditions suitable for particle dislodgement. Analytical formulation of the problem and experimental data are used to examine the validity of the new criterion.
19.1 Introduction
The dynamic interplay between fluid forces and particle dislodgement for flows over an erodible boundary constitutes a central problem in earth surface dynamics, biological flows, and many engineering phenomena and industrial processes. For example, erosion, transportation and deposition of sediments and pollutants influence the hydrosphere, pedosphere, biosphere and atmosphere in profound ways. The global amount of sediment eroded annually over the continental surface of the earth via the action of water and wind is estimated to be around 80 billion metric tons, with 20 billion of them delivered by rivers to the oceans (Syvitski et al., 2005). This redistribution of material over the surface of the earth affects most of its physical, chemical and biological processes in ways that are not understood and which are exceedingly difficult to comprehend. For example, in 1998 it was estimated that the annual costs of water pollution due to sediment in North America alone exceeded $20 billion (Osterkamp et al., 1998).
Determining the minimum, or critical, force necessary to dislodge a particle out of its pocket, arguably constitutes one of the most fundamental and elementary problems in mechanics, regardless of the mode of movement (i.e. sliding, rolling, saltation). Yet, when it comes to flow-induced forces, identifying this critical condition has confounded scientists and engineers for several hundred years. The main culprit for this problem is the fluctuating nature of the applied fluid forces, while the resistance to particle movement remains the same. Except for the limited flow condition of extremely low particle Reynolds numbers, Rp = u* D50/ν (where u* is the shear velocity, D50 the median size of the bed material and ν the kinematic fluid viscosity), when the Stokes regime prevails (Rp < 0.1), this is always the case, even for laminar flows, where flow separation is predominantly responsible for unsteady loadings.
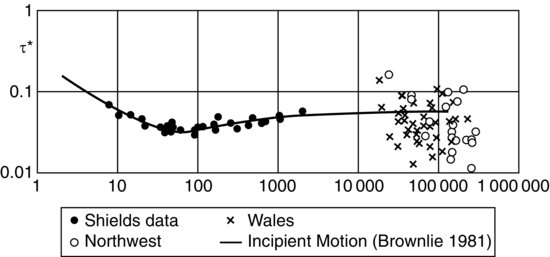
The criterion currently in use for identifying the onset of sediment movement subject to fluid forces was originally proposed by Shields in 1936. In this landmark study, he concluded that the dimensionless boundary shear stress, called the Shields stress, τ*= τo/[(ρs − ρ) g D50] (where τo is the time/space–averaged boundary shear stress, ρs and ρ are the density of sediment and water, respectively and g the acceleration of gravity), is the most suitable parameter for predicting threshold conditions for a given grain size and flow conditions. This parameter emphasizes the time-averaged characteristics of the applied fluid forces and therefore is not capable of accounting for the fluctuating forces typically encountered in natural and engineered flows. Even though results from laboratory and field studies have shown more than an order of magnitude variability in the value of this criterion (Figure 19.1) for a hydraulically rough boundary (Naden, 1987; Buffington and Montgomery, 1997; Parker 2008) it has remained the standard method for more than 75 years. The Shields parameter can be interpreted as the ratio of the applied fluid and resisting forces experienced by a particle located at the bottom of a stream. For material in the gravel range and coarser, Shields suggested that this parameter attains a constant value, 0.06. Prandtl (1952), in discussing Shields' results, commented that the 0.06 value ‘… is remarkably low.’ Nevertheless, Paintal (1971), based on detailed experiments near threshold of motion conditions, determined that a value closer to 0.03 would be more appropriate. It is worth mentioning that the critical Shield stress value obtained from laboratory experiments for particles in the medium to fine silt range (0.013 mm < D50 < 0.025 mm), the smallest noncohesive particle sizes for which such results are available, remains approximately constant equal to 0.28 (Miller et al., 1977). Considering a suitable value for Coulomb's static friction factor (∼0.60) it can be surmised that in this case the applied force is approximately equal to that resisting particle entrainment. The corresponding particle Reynolds numbers for this size range are 0.03 < Rp < 0.08, indicating flow conditions within the Stokes regime. It is conjectured here that for noncohesive grains smaller than ∼0.025 mm, the critical Shields parameter becomes constant and therefore independent of the particle Reynolds number. This behaviour is reminiscent of that advocated for particles in the gravel and larger size ranges (Figure 19.1). The fundamental difference is that this conclusion is based on steady forces for the former case and on fluctuating for the latter. It is not surprising, therefore, that the critical Shields stress value for the Stokes regime is 5–10 times the average value reported for a fully rough boundary condition. Given these observations, we can expect that for the Stokes regime case, the critical shear stress should remain fairly constant, whereas for the fully rough boundary scenario considerable scatter should be present as the fluctuating fluid forces vary in terms of magnitude and duration. These results highlight the inability of the time-averaged representation of the phenomenon outside the Stokes regime to adequately capture the true magnitude of the fluid forces responsible for particle dislodgement. It can be surmised here that the Shields criterion provides a surrogate measure of the more complex flow phenomena associated with particle entrainment.
Figure 19.1 Shields diagram. Reprinted from Parker, 2008. With permission from ASCE.
One of the first attempts to highlight the importance of turbulence on particle movement, albeit in an elementary way, is attributed to Varenius (1664). He concluded from observations that the random motion of sediment is related to the turbulent (not his terminology) motion of the water in the stream. Since then, a large number of researchers have advocated this point of view based on detailed field, laboratory and other studies (Leighly, 1934; White, 1940; Einstein and El-Samni, 1949; Einstein, 1950; Prandtl, 1952; Sutherland, 1967; Grass, 1970 and 1983; Paintal, 1971; Jackson, 1976; Heathershaw and Thorne, 1985). More specifically many researchers (e.g. White, 1940; Prandtl, 1952), in an effort to overcome the limitations of the time-averaged wall shear stress approach and explain the small numerical value of the Shields parameter discussed in the previous paragraph for the case of gravel and larger grains (Prandtl, 1952), have promoted the important role that turbulent fluctuations play. In particular, they have advocated that it is the peak velocity values, and the resulting hydrodynamic forces that are predominantly responsible for particle dislodgement for flow conditions near threshold of movement. This point has been examined for both smooth (e.g. Sutherland, 1967; Grass, 1971; Sumer et al., 2003) and rough boundaries (e.g. Apperley and Raudkivi, 1989; Schmeeckle and Nelson, 2003; Vollmer and Kleinhans, 2007), as well as in the presence of bed forms (e.g. Raudkivi, 1966; Nelson et al., 1993; Paiement-Paradis et al. 2003; Sumer et al., 2003). For example, several researchers have determined that increases in the turbulence level of the boundary shear stress while maintaining the same time-mean value can result in substantially higher bed-load transport rates (Kanellopoulos, 1998; Schmeeckle and Nelson, 2003; Sumer et al. 2003).
Despite the widespread recognition, and the more recent rather startling results, the attempts to link the characteristics of turbulent flow to particle entrainment have not surpassed qualitative descriptions. It is ironic that even in the very few and most sophisticated cases where researchers have resorted to solving the governing flow equations numerically, they have employed predominantly the Reynolds-averaged Navier-Stokes (RANS) equations (e.g. Apsley and Stansby, 2008). The prediction of sediment entrainment within large eddy and direct numerical simulation (LES and DNS) models is becoming more common, however (e.g. Chou and Fringer, 2010), where force magnitude, typically through an excess stress model (using instantaneous stresses), is employed to capture bedload transport. This is a reflection of the difficulties in accounting for the intricate ways that turbulence influences, or even dominates, particle threshold conditions.
A brief review of the recent and most relevant literature is provided first. The focus here is on coherent flow structure characteristics and their impact on particle entrainment. A simplified model of a fluctuating drag force is used next to elaborate on the difficulties that arise in this time-dependent phenomenon. In Section 19.4, the limitations of the force magnitude concept to uniquely determine initiation of motion conditions are discussed and the particle dislodgement paradox is described. Then the paradox is resolved by introducing the impulse concept. In the subsequent sections, the validity of this concept is demonstrated through arguments based on analytical formulation and carefully crafted laboratory experiments. In the final sections, ideas based on coherent structures and associated impulses are generalized.
19.2 Grain-flow interaction: recent developments
The literature on the investigation of coherent turbulent flow structures in both smooth and rough wall flows is now extensive (Robinson, 1991; Smith, 1996) and it continues to grow as our experimental, analytical, and computational capabilities advance. The experimental study of the interaction of turbulent flow with mobile sediment predates the first studies of coherent turbulent structures and has gone through several phases, starting with that of Shields and the time-average characterization of entrainment, followed by investigation of fluctuating stress and the probability distributions of lift and drag. These two phases have been briefly reviewed in Section 19.1. Since the late 1980s, emphasis has been placed on the study of individual grains; specifically the interaction between an individual sediment grain and the instantaneous fluctuations induced by turbulent flow structures responsible for the hydrodynamic forces acting on the grain and the grain's initial movement. The presumption is that coherent flow structures (a region of the flow over which a fundamental flow variable is correlated with itself or with another variable over a range of space and time (e.g. Robinson, 1991) or organized flow features with both spatial and temporal coherence (e.g. Adrian, 2007)), in contrast to purely random flow fluctuations, are principally responsible for grain entrainment at near incipient flow conditions.
A large number of studies, perhaps starting with Sutherland (1967) and Jackson (1976), have demonstrated that specific flow events, if not structures, are associated with the entrainment of sediment and that these flow events dominate entrainment episodes in comparison to random background flow fluctuations. Heathershaw and Thorne (1985) and Nelson et al. (1995) were among the first to establish experimentally the quantitative correlation between specific flow events and bedload transport. Heathershaw and Thorne (1985) examined the initiation of motion of sea-bed gravels in tidal flows. They used electromagnetic current meters to measure velocity fluctuations in the vertical and longitudinal directions, while an underwater video camera together with a wideband hydrophone were employed to monitor sediment movement. By pursuing a quadrant analysis they determined that most of the sediment movement was caused ‘principally by sweep-type motions [(Q4)]… and to a lesser extent by outward interactions [(Q1)]’. A quadrant 1 (Q1) event refers to a motion where the horizontal and vertical instantaneous velocity fluctuations (u' and w', respectively) are greater than the mean. A quadrant 4 event is where u' is greater than the mean and w' is less than the mean. These results lead them to suggest ‘… that horizontal turbulent velocity fluctuations may have greater dynamical significance in terms of sediment movement, than the instantaneous contributions (-u′w′) to the Reynolds stress.' Nelson et al. (1995) obtained similar results from laboratory experiments carried out under fully developed channel-flow conditions and for the case of a flow behind a backward-facing step. In both cases they synchronized fluctuating bedload transport measurements with pointwise, two-component laser Doppler velocimeter (LDV) measurement in close proximity to the bed. Statistical analyses, particularly weighted quadrant analysis, demonstrated the strong correlation between the streamwise velocity (Q1 and Q4 events) and bedload transport, with Q4 events predominating due to their frequency of occurrence. Little correlation, however, was observed with the fluctuating normal component of the velocity or the Reynolds momentum flux (ρu′w′ in their nomenclature). However, Nelson et al. (1995) point out that, despite the strong positive correlation between streamwise velocity fluctuations and sediment transport, the transport is not necessarily well predicted from the streamwise velocity because the durations of the sweeps and outward interactions influence the transport process.
The investigations of flow interactions with individual grains include a variety of experimental strategies, including direct measurement of time-resolved force (lift and drag) on an instrumented immobile grain (e.g. Schmeeckle et al., 2007 and Dwivedi et al., 2011a,b) or time-resolved grain surface pressures (Hofland et al., 2005; Smart and Habersack, 2007; Dwivedi et al., 2010; Detert et al., 2010; and Celik et al., 2013). To capture grain/flow interaction the force or pressure measurements are synchronized with simultaneous time-resolved flow measurements, either point-wise with LDV or planar measurements with particle image velocimetry (PIV). Hofland (2005) and Dwivedi et al. (2010, 2011a) report, in addition to pressure or force measurements, separate experiments with a mobile grain with simultaneously recorded PIV measurements. A number of investigators report purely grain entrainment simultaneously with flow velocity (via either LDV or PIV) without separate force or pressure measurements, notably Balakrishnan (1997), Cameron (2006), and Celik et al. (2010). The consistent conclusion from all of these more recent experimental investigations is the presence of Q4 events near or at the time of grain entrainment and consistently high positive drag force fluctuations during these events (particularly at high exposures). The role of fluctuating lift is less clear, although there is growing evidence of a general lack of correlation between fluctuating lift and the fluctuating vertical (bed-normal) component of velocity (measured upstream or directly above the mobile grain). It has been suggested that sweep events may induce negative lift (Paiement-Paradis et al., 2010), although Dwivedi et al. (2010) identified high pressures beneath the grain during sweeps and positive lift, and so both positive fluctuations in drag and lift during sweeps. These researchers also noted the potential relevance of the temporal duration of these pressure events for grain entrainment. Smart and Habersack (2007) conclude, from their pressure measurements above and below a small flat surface at the level of the sediment bed, that advected pressure fluctuations due to passing turbulent eddies (and unrelated to form drag/lift) are sufficient to entrain grains. The present authors also have evidence of pressure fluctuations leading to positive lift, which may be due to passing vortex cores, just preceding Q4 events, with a subsequent increase in lift during the sweep.
Detert et al. (2010) and Dwivedi et al. (2011a) utilize PIV in their studies of the time-resolved interaction between turbulent flow structures and a fully rough sediment bed. For both studies instantaneous maps of flow velocity, swirl strength, and, in Detert et al. (2010), bed surface pressures are reported, as well as conditional velocity and pressure fields. Detert et al. (2010) use an array of pressure transducers mounted on the surface of a rough immobile bed and, together with simultaneous PIV measurements in both a streamwise bed-normal plane and a horizontal plane above the bed, estimate the ‘instantaneous’ pressure field on the bed and its relation to the fluctuating flow field above it. Instantaneous velocity field measurements in the wall-normal plane reveal wedge-like structures (identified in previous publications) with a higher velocity fluid region above and ‘over-running’ a lower velocity region. The shear layer between these regions is populated with vortices (presumably the heads of hairpins). A two-point correlation between swirl strength and fluctuating streamwise velocity (Christensen et al., 2001) supports the existence of these wedge zones and prograde vortices. These measurements, simultaneous with measurements of bed surface pressure, show a significant decrease in the pressure on the top of the grains as the higher velocity zones travel over the transducers. Higher pressures are observed below the low velocity fluid zones. Smaller scale pressure fluctuations are also observed during these events, perhaps due to eddies within the wedge-like structures and vortex shedding on the bed grains themselves. Similar PIV measurements in a horizontal plane just above the roughness clearly show high and low speed streaks, random but alternating in the spanwise direction.
These observations from instantaneous PIV fields are confirmed with two-point streamwise velocity correlations. The streaks have a spanwise spacing of approximately two grain diameters and a streamwise length estimated to be three to six times the spanwise spacing. The spanwise array of pressure transducers are used with Taylor's hypothesis to construct a spatial field over the rough bed of an ‘instantaneous’ bed surface pressure map. These maps reveal the high pressure zones below the lower velocity flow regions, followed by significantly lower pressure zones beneath the higher velocity fluid flow regions. These pressure zones scale with flow depth and have elongated shapes – extended in the streamwise direction. Detert et al. (2010) also employ conditional averaging of selected pressure events (where the rate of change of fluctuating pressure with time is used to identify the relevant conditioned velocity field events). These conditioned fields confirm the previous observations of the wedge-like zones and shear layer, with the streamwise extent of the conditionally averaged higher velocity region of approximately one to two flow depths, and bed-normal height of one-half the flow depth. The spanwise spacing of the conditioned pressure zones is consistent with the spanwise scale of the low- and high-speed streaky structure.
Dwivedi et al. (2011a) use two separate sets of experiments to examine the role of coherent flow structures in the initiation of grain entrainment: mobile and separate immobile grain tests, both with PIV. For the immobile tests the instantaneous PIV velocity measurements are encoded with simultaneous measurements of the force (drag and lift) on a single spherical grain attached to the force transducer and positioned among identical spheres on a fully rough bed. For the mobile grain tests, instantaneous PIV measurements are obtained together with grain entrainment (video) detection. Whether the mobile grain is shielded (zero exposure) or highly exposed, large sweep (Q4) structures predominate during entrainment of the grain. The instantaneous PIV images reveal wedge-like structures (consistent with Detert et al., 2010) with the shear layer populated with prograde vortices. When the instantaneous velocity vector plots are Reynolds decomposed (and a convection speed removed) both prograde and retrograde vortices are exposed. The prograde vortices are numerous and appear in groups but apparently play little or no role in the entrainment of the grain, while the rare retrograde vortices, not observed in Detert et al.'s PIV images, are present at the time of grain entrainment. Dwivedi et al. (2011) speculate that the strong sweep events are caused by the retrograde vortices. The strong sweeps induce high drag forces as well as high pressure below the grain leading to positive lift. The simultaneous PIV/force experiments with the immobile grain reveal outward interaction (Q1) events preceding a sweep with maximum drag and lift observed during sweeps.
19.3 Fluctuating fluid forces
Figure 19.2 presents an idealized fluctuating hydrodynamic drag force applied to a hypothetical submerged particle on a sediment bed. For simplicity we assume the force is directly aligned with the streamwise flow direction (i.e. drag) and resisting forces are present so that the particle is stationary. For illustrative purposes it is assumed that the drag force varies sinusoidally with time. This is an oversimplification but it captures features characteristic of turbulent fluctuating forces and their role in grain entrainment.
Figure 19.2 Example of simple time varying drag on a sediment grain. Dimensionless drag force versus time. The time integral of the instantaneous force above the critical force is the impulse applied to the grain, represented by the shaded areas.
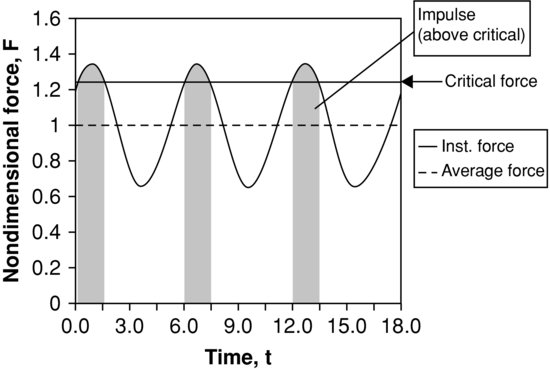
The average force is indicated on the figure with a dashed line and, for the sake of argument, the resisting force, or critical force, which must be overcome to initiate particle motion, is greater than the average force but less than the instantaneous maximum applied force. This force is shown as a solid line in the figure. Even though the average force is below the threshold for movement, because the instantaneous force periodically exceeds the threshold, the grain may be dislodged during these brief periodic episodes.
In turbulent open-channel flow such behaviour is exhibited when the dimensionless bed shear stress is below the critical Shields stress. In such instances no substantial grain motion is detected, but some occasional movement of individual grains is observed. The average force of the flow on the sediment bed is insufficient to cause widespread movement, but random, more extreme turbulent fluctuating forces do exceed the local resisting forces, albeit infrequently.
Such extreme fluctuating forces have been measured by several research groups, most recently by Celik et al. (2013) in turbulent open channel flow. In particular, using measured grain surface pressures, the fluctuating drag force (due to pressure) on a 12.7 mm spherical grain was measured for flow above a fully-rough boundary. A portion of one such time series is shown in Figure 19.3.
Figure 19.3 Dimensionless drag force (F/W; W = submerged weight), measured on a spherical grain in turbulent open channel flow. The dashed line is the average force, while the solid line is the threshold force.
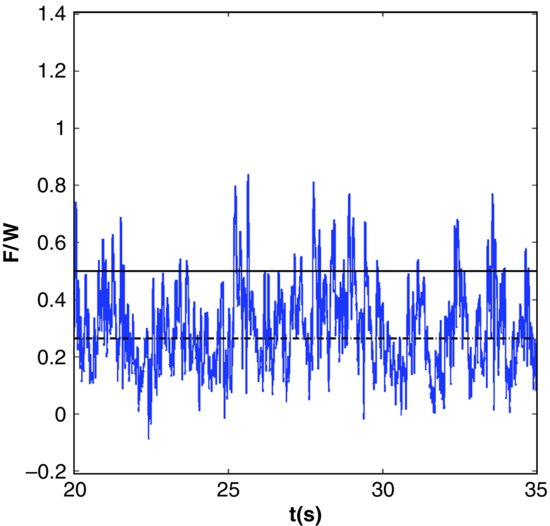
The time average dimensionless drag force is indicated in Figure 19.3 with a dashed line. It is clear that the drag force varies rapidly and the range of variability is wide, from near zero at times to extreme levels several times the mean. The required dimensionless critical force (based upon a static moment balance) to just initiate movement is also shown in this figure as a solid line. The critical force calculation is appropriate to the specific geometric arrangement of the spherical bed particles used in Celik et al's (2010) experiment. It is observed that the critical force exceeds the mean drag and that the instantaneous drag force exceeds the critical level sporadically but frequently. In fact, at this flow condition the drag exceeds the critical level over 1500 separate times during the course of the 15-minute long experiment.
According to the materials reviewed in Section 19.1, the flow condition associated with the experimental results of Figure 19.3 would be classified as below critical (using a mean shear stress criterion such as Shields diagram). However, the grain was entrained (the bedload transport rate was low but not zero). Using probabilistic models based upon instantaneous force, the results of Figure 19.3 would yield relatively frequent grain entrainment, consistent with the probability of the actual force exceeding the critical (e.g. Grass, 1970). However, for this flow condition, of the 1554 events with F > Fcrit only 86 were associated with actual grain entrainment. The authors have demonstrated (Diplas et al., 2008) that the magnitude of the force exceeding the critical is a necessary but insufficient condition for grain entrainment.
19.4 Particle dislodgement paradox
The considerable scatter in the estimated critical Shields stress values exhibited by field and laboratory data (Figure 19.1) has been attributed to the inability of this time-averaged criterion to account for the fluctuating stresses, and especially the more extreme instantaneous forces (e.g. Prandtl, 1952). The implications of this shortcoming were explained in the previous section. In an effort to overcome this limitation, researchers have proposed the use of the peak shear stress value when calculating threshold of motion conditions (e.g. Prandtl, 1952). Furthermore, the use of the turbulence intensity has been proposed (Sumer et al., 2003) for the purpose of distinguishing between two flows with identical τ* values and bed materials that may yield substantially different bedload transport rates due to differences in the unsteady, temporal turbulent characteristics. This is consistent with the use of peak stresses to identify threshold conditions as it considers the contribution of the magnitude of the extreme events in the sediment transport process. In agreement with these findings, several researchers have highlighted the importance of an obstruction located upstream of a site exhibiting erosion in bedrock channels (Whipple, 2004). It is suggested, here, that this obstruction modulates the flow in a way that amplifies the magnitude and frequency of extreme pressure fluctuations that are responsible for triggering channel bed erosion.
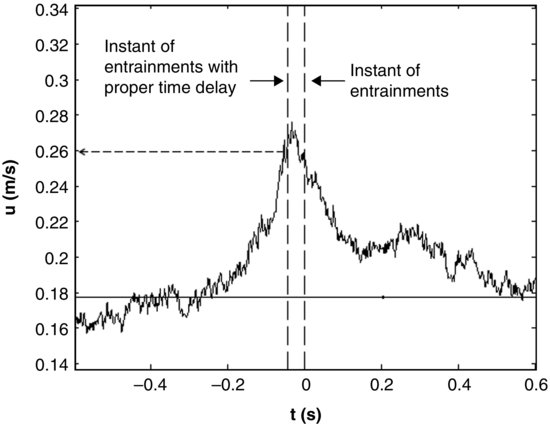
In an effort to examine the significance of the peak instantaneous stresses in sediment transport, Diplas et al. (2008) performed laboratory experiments carefully designed to examine the role of turbulent fluctuations on particle movement. In these experiments, extensively discussed in Celik et al. (2010), 2D LDV was used to obtain velocity measurement one diameter upstream and along the axis of an exposed mobile particle at a sampling rate of 300 Hz. A He-Ne laser system was employed to detect the instances when a fully exposed particle was dislodged out of its pocket. Given the extreme susceptibility of particle movement to changes in the local turbulent flow behaviour due to even a minute interference, the nonintrusive instrumentation setup used in these experiments provides an objective and reliable testing of the hypothesis put forth by many researchers regarding the role of the peak instantaneous stresses on the inception of bed material movement. An example of the ensemble average of the instantaneous streamwise velocity about the instant of grain entrainment is shown in Figure 19.4, demonstrating the statistically consistent higher streamwise velocity at and about the time of grain dislodgement.
Figure 19.4 Ensemble average of streamwise velocity (u) relative to the time of entrainment (t = 0 is the uncorrected instant of entrainment). Time delay is due to the distance between the LDV measurement volume and the grain. A span of ±500 data points for each entrainment instant was used to obtain the ensemble average of u. The horizontal solid line indicates the time-average value of u over 30 minutes. Reprinted from Diplas et al., 2010. With permission from ASCE.
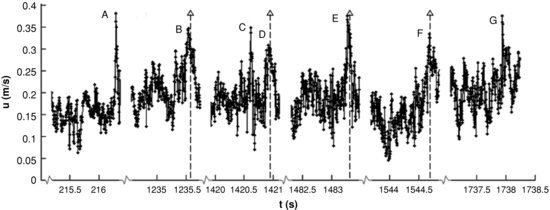
Over the 30 min duration of this experiment, 1465 events were identified as having an instantaneous drag force magnitude higher than the one required for particle movement. Yet, only 65 particle dislodgements were observed over the same period. A sample record, pieced together from peak velocity events and associated responses of the mobile particle, is shown in Figure 19.5. Of the seven events having similar magnitude, only four (the ones identified with an arrow) resulted in grain dislodgement. This type of behaviour was repeated in many more experiments that were carried out at the Baker Environmental Hydraulics Laboratory of Virginia Tech (Celik et al., 2013). Based on these observations, Diplas et al. (2008) concluded that the requirement that the force magnitude should exceed the critical value is a necessary but not sufficient condition for grain entrainment. Therefore, force magnitude alone cannot identify uniquely threshold of motion conditions. This apparently counterintuitive behaviour is termed here as the particle dislodgement paradox.
Figure 19.5 A composite of the measured streamwise velocity upstream of a mobile sphere in fully rough turbulent channel flow. Events A to G denote events which exceed the critical force. Entrainment occurred during events B, D, E and F only. From Diplas et al., 2008. Reprinted with permission from AAAS.
19.5 Resolution of the particle dislodgement paradox
Closer observation of the record shown in Figure 19.5 suggests that, although all the velocity spikes have relatively short duration, of the order of several or tens of milliseconds, the ones that did not cause dislodgement appear to be particularly short lived (e.g. events A, C and G in Figure 19.5). Although these extreme magnitude, but short-lived events might impart adequate force to initiate movement within its resting pocket, they do not last sufficiently long to accomplish full particle dislodgement (Diplas et al., 2008, 2010; Celik et al., 2010; Valyrakis et al., 2010). These motions result in vibration of a particle within its pocket, as has been observed in laboratory experiments and in the field by many researchers (e.g. Papanicolaou et al., 2002; Garcia et al., 2007). Diplas et al. (2008) hypothesized that besides force magnitude, duration should also be considered in identifying uniquely the threshold of motion conditions. The product of these two parameters that fully describe the temporal history of an applied force is conveniently represented by the fundamental concept of impulse. It is advocated here that this concept, which is suitable for accounting for the fluctuating nature of turbulent flows, appropriately applied, has the potential to resolve the particle dislodgement paradox.
To test this hypothesis, Diplas et al. (2008) devised the tabletop experiment shown in Figure 19.6. They used a small electromagnet together with a mobile, steel, magnetic spherical test particle positioned on a base of Teflon® spheres to measure the force-duration combinations which barely lead to full dislodgement of the movable grain. The experiments, representing seven different particle size arrangements (combinations of base and mobile/steel spherical particles having 2, 6 and 8 mm diameter; see inset in Figure 19.7), were performed in still air. The setup included a data acquisition board (DAQ), a signal processor and a circuit used for voltage amplification. Software was used to generate user-defined square electromagnetic pulses of varying duration, T (3–63 ms), and magnitude, V (2.5–15 V), in an effort to simulate turbulent fluctuations typically encountered in fluid flows. The circuit amplified the signal sent by the DAQ system to the magnet, read the voltage drop across the electromagnet as well as the current and then deamplified these signals to an appropriate range to be read back in by the DAQ. The resulting current through the magnet's coil induces a force on the steel sphere (Figure 19.6). A high-speed camera was used to monitor the response of the steel particle. This simplified configuration and well controlled conditions allow for the determination of cause-and-effect relations for the case of initiation of motion of a fully exposed particle subject to a short-lived drag force. The preferred mode of particle movement under these conditions is rolling, consistent with observations made in the field and laboratory experiments for rounded or semi-rounded particles (Bagnold, 1973; Drake et al., 1988; Dancey et al., 2002). Many combinations of V and T were investigated for each of the particle arrangements tested, for a total of 1709 separate experiments. While, in nearly all of these experiments, the amplitude of the electromagnetic pulse was adequately large to commence particle movement, its duration was sufficiently long to barely complete full particle dislodgement in only 328 of these tests. More details about these experiments are available in Diplas et al. (2008) and Valyrakis et al. (2010).
Figure 19.6 Electromagnet experiment setup.
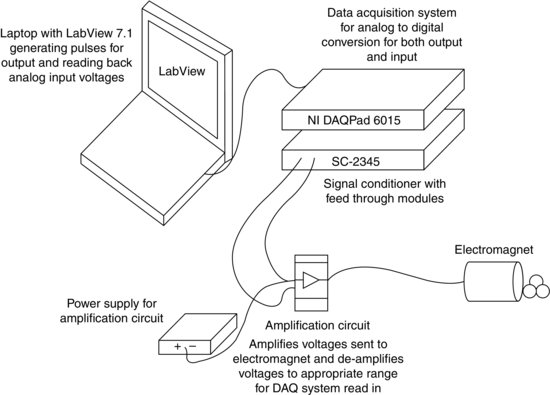
Figure 19.7 Dimensionless force plotted versus dimensionless temporal duration of a tophat magnetic impulse required to dislodge a spherical grain from its pocket. From Diplas et al., 2008. Reprinted with permission from AAAS.
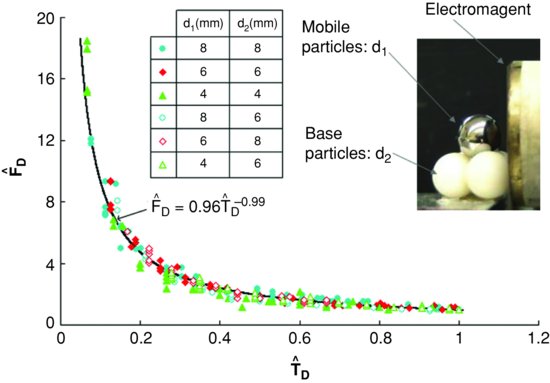
The electromagnetic force FD ∝ V2 and corresponding duration T combinations resulting in threshold of motion conditions for a given particle size arrangement were first normalized by the minimum electromagnetic force (FD)min and corresponding duration Tmax required for particle dislodgement. The resulting 328 pairs of nondimensional force and duration  are shown in Figure 19.7. Here,
  = FD/(FD)min and
  = T / Tmax. The (FD)min and Tmax values were measured experimentally for each arrangement and represent critical conditions close to steady state particle dislodgement. The results clearly demonstrate that the notion of a critical force criterion when the forcing mechanism is rapidly fluctuating is inappropriate. As a matter of fact, a wide range of force magnitudes (varying by a factor of at least 10, as shown in Figure 19.7) can cause identical threshold of motion conditions. Furthermore, the electromagnet tests plainly show that the force magnitude and its duration are equally important for determining threshold of motion conditions. The findings suggest that the use of a time-averaged value is not as meaningful physically under these conditions. Therefore, the scatter of the data shown in the Shields diagram (Figure 19.1) should not be surprising. It is also worth repeating that the time-averaged critical shear stress is typically smaller than the stress necessary for particle dislodgement (Prandtl, 1952; see also Sections 19.1 and 19.4) and consequently its use is counterintuitive.
However, all the data shown in Figure 19.7 are well represented (correlation coefficient of 0.96) by a hyperbolic function (Figure 19.7). This leads to the conclusion that all these significantly varying force magnitudes have the same impulse value. It is therefore evident that the use of critical impulse is the appropriate concept for uniquely identifying the threshold conditions of a grain subject to a fluctuating forcing mechanism. This concept resolves the threshold particle paradox in a satisfactory way.
19.6 Analytical formulation
Impulse,  , although a familiar concept from basic physics, is rarely applied in the study of fluvial and aeolian systems. The analytical formulation of impulse as a criterion for the initiation of motion is developed in Diplas et al. (2008) and Valyrakis et al. (2010) and will not be repeated in detail here. In those works the impulse theory and the concept of critical impulse for grain entrainment are developed for both saltation (assuming pure lift) and rolling, where the latter work accounts for both lift and drag and the role of them in the dynamics of spherical bed grain entrainment. Here we develop the concept using simple arguments from mechanics to better communicate the general idea and its implications. Although this development is presented for the simplest of grain motions, exclusively vertical displacement, the general qualitative behaviour exhibited by the solution is applicable to both saltation and rolling (the mathematical analysis for rolling is significantly more involved; see Valyrakis et al., 2010).
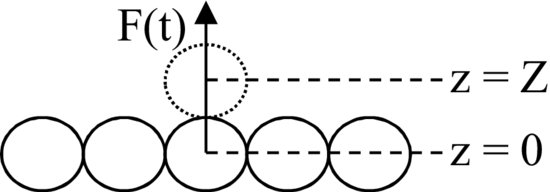
In Figure 19.8 a grain of mass m is located at a position z = 0 among other grains in the bed and a net positive vertical force (accounting for gravity) is applied to the grain over a time interval T which imparts vertical momentum to the grain. The linear momentum of the grain after time T can be written:
where v is the velocity at time T and I is the impulse over the same time interval. v = 0 at t = 0 has been assumed. Also, during the interval 0 ≤ t ≤ T
(19.2) 
where z is the vertical displacement. If Z is specified as the minimum vertical displacement required for grain dislodgment (Figure 19.8, dotted sphere), then for the grain to reach a vertical height of Z (with zero vertical velocity) the kinetic energy of the grain at time T must, at the least, be equal to the potential energy increase from z(T) to Z. That is
(19.3) 
Figure 19.8 Sketch of mobile spherical grain within a layer of identical grains. Vertical net lift force dislodges the grain from its resting position, z = 0. When z = Z, the grain is regarded as dislodged.
Using these three expressions one finally obtains the relation between the critical displacement Z and the impulse I
This equation suggests that for given m, g, and Z (determined by the grain characteristics and bed geometry) no single value of I identifies dislodgement. That is, the history of the applied impulse (the last term on the RHS) is relevant, in general. This dependence can be made explicit for the simple case of a top hat forcing function, where F is constant over the interval  , i.e. I(T) = F·T. Equation (19.4) becomes
where now dependence on both I and T is apparent. So, in general for given m, g, and Z, many different combinations of I(T) and T are possible to achieve the same critical dislodgment Z. However, Celik et al. (2010) demonstrated that in turbulent channel flow under fully rough conditions, the applied unbalanced force and resulting impulse occur over very short durations. Under these conditions, the second term on the RHS in Equation (19.5) or the integral term in Equation (19.4) becomes small compared to the first term; and in the limit where the force is represented by a Dirac delta function at t = 0 (while I remains finite), the second term vanishes resulting in
(19.6) 
Under these conditions a critical impulse is appropriate and for given Z, g, and m, dislodgment may occur for an infinite variety of force-time histories F(t) with the single condition that I > Icrit. As a practical matter, sufficiently high impulse, not force magnitude, is the criterion for grain entrainment. This implies, from the definition of impulse, that both force magnitude and the temporal duration of the force are relevant to grain entrainment via turbulence.
19.7 Experimental results
The authors and our students have studied both flow/force interaction between fully developed turbulent channel flow and an instrumented, immobile, spherical sediment grain as well as flow/entrainment interaction between an isolated, mobile, spherical grain and turbulent channel flow. For the force interaction studies, time-resolved surface pressure measurements are used to estimate the instantaneous lift and drag forces (due to pressure) on the instrumented grain. Low-range, high-frequency response pressure transducers are used for these measurements together with simultaneous measurements of the instantaneous flow velocity directly upstream of the instrumented grain, via LDV. They have also extensively studied individual grain movement and entrainment and the relation between such movement and the upstream velocity in turbulent channel flow. In those investigations simultaneous measurement of target grain movement and flow velocity is achieved over a large set of entrainment events. Post-processing permits conditioned statistical analysis, revealing the characteristics of the flow that correlate with grain entrainment. Our experimental facilities and instrumentation systems are detailed in Diplas et al. (2008) and Celik et al. (2013) and a photograph of the mobile grain resting upon the fully rough bed is shown in Figure 19.9. All experiments (immobile instrumented particle and mobile grain) have been performed in an 0.6 m wide tilting flume under fully developed, fully rough, near incipient conditions in turbulent open channel flow.
Figure 19.9 Teflon® test particle and identical-size, well-packed glass spheres forming the flume bed.

19.7.1 Fluctuating force measurements on an instrumented immobile grain
The target grain is a 12.7 mm diameter brass sphere instrumented with four pressure taps, one pair located at the front and rear stagnation points (located on the centreline of the sphere and aligned with the streamwise flow velocity) and the other pair located on the top and bottom of the sphere. The sphere itself is mounted atop three layers of identical diameter spheres in a close-packed hexagonal arrangement.
The transducers used for the individual pressures at the four tap locations are positioned below the flume. The instrumented grain is of course incapable of motion. The pressure signals from all four transducers are sampled individually and simultaneously at 1000 Hz and time stamped with the separate but simultaneously obtained LDV measurements of the streamwise and normal velocity components, at a position one diameter upstream of the grain and located along the centreline of the sphere. Each pair of pressure taps is used to estimate the instantaneous drag, for example (p1–p2)A and lift (p3–p4)A, where A is the projected area of the sphere, p1 is the pressure on the front (upstream side), p2 on the rear (downstream), p3 on the top, and p4 on the bottom of the sphere.
The uniform turbulent open channel flow conditions are documented in Table 19.1. The flow conditions are generally near critical, but the friction velocity, u*, was systematically changed over the course of the test series by a modest 16%. The integral scale of the flow determined at the position of the LDV measurement volume (using the autocorrelation of the streamwise velocity time series) is approximately two grain diameters and does not vary significantly over the test series.
Table 19.1 Flow condition during mobile grain experiments.
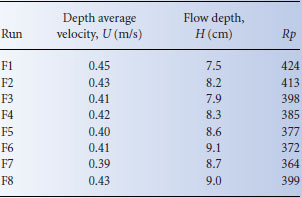
For all tests in the series, strong negative statistical correlations between the front stagnation point pressure fluctuations (p1) and the grain surface pressures on the top and at the rear of the grain are observed. The peak correlation magnitudes occur at separate time lags (relative to p1), and are consistent with the time lag associated with flow advection. Not surprisingly, there are also very strong correlations between the streamwise velocity upstream of the grain u and p1 (positive), p2 (negative), and p3(negative), again with time lags consistent with advection at the local mean velocity. Such strong correlations in this fully turbulent field are very suggestive of flow structures or events that advect by and around the grain and interact with it. Similarly strong negative correlations of the pressure on top of the grain with the normal component of the velocity support the conclusion that sweep type flow events are associated with high drag and high lift forces (both of which enhance the likelihood of grain entrainment). A striking feature of these pressure cross-correlations is the appearance of a second, high correlation magnitude peak with a different time lag. Celik (2011), using conditioned sampling analysis, argues that these secondary correlation peaks are associated with specific, statistically consistent, flow structures that occur near the maximums in the fluctuating drag force. Interestingly, consistent fluctuations in lift are also observed near these extreme drag events, with relatively strong positive (upward) lift occurring just prior to a strong drag fluctuation. Needless to say, the time/phase lag between the surface pressures is relevant for proper interpretation of instantaneous drag and lift, and so for the interaction between the flow and the grain.
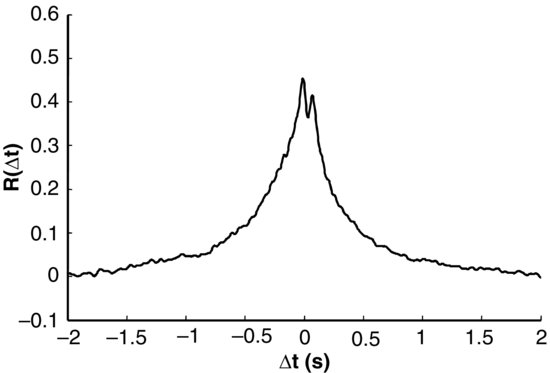
A strong cross-correlation (R = 0.45) is also reported between drag and lift (Figure 19.10) with the peak correlation occurring when lift precedes drag (data from F1). The double-peaked correlation function first observed in the pressure cross-correlation is also present between drag and lift. Celik (2011) also reports fairly strong correlations between drag and u as well as between drag and the normal component of velocity, w. The correlation between lift and w is weak, while the correlation between lift and u approaches 0.4.
Figure 19.10 Cross correlation between drag and lift forces plotted relative to time lag for a spherical sediment grain in turbulent open channel flow. Reproduced from Celik et al., 2010, with permission from Bundesanstalt für Wasserbau.
Using conditioned sampling (conditioned on peak drag force events), a statistically consistent feature is the occurrence of an increase in positive lift, reaching a maximum near 6% of the submerged weight, slightly before the maximum drag, followed later (i.e. 60–70 ms) by another increase in lift. The conditioned velocity (u, w) is consistent with sweep type fluid motions. Celik (2011) proposes the initial lift event is the result of the passage of a low pressure core from an overlying vortex followed by a strong sweep which induces both strong drag on the grain as well as lift, due to a Bernoulli effect on top of the grain.
Diplas et al. (2008) and Celik et al. (2010) emphasize the dominant role that fluctuations in temporal duration play in imparting impulse to the sediment grains, much more so than fluctuations in force magnitude. The measurements demonstrate that in turbulent flow the most frequent events which carry the minimum necessary impulse to cause grain entrainment tend to be shorter duration events (i.e. tens of milliseconds), although impulses with durations 100–200 ms are observed. The longest duration and highest impulse events do not impart the highest force levels on the grain and they are in the extreme tails of the distribution (infrequent).
19.7.2 Measurements of mobile grain entrainment
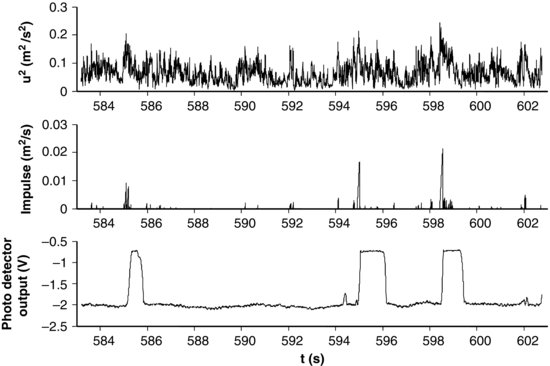
Figure 19.11 shows experimental results obtained by Celik et al. (2010) using the nonintrusive grain motion detection technique and simultaneous local flow velocity measurements upstream of the mobile grain from an LDV. A segment of the measured instantaneous streamwise velocity is plotted in Figure 19.11a (in this instance we plot u2(t) because of its close relationship with the drag force). Figure 19.11b shows the computed impulse associated with the flow and Figure 19.11c shows the voltage output from the laser-based grain motion detector. The impulse is computed only when the instantaneous u2 exceeds the critical level as determined from a static balance for the grain geometry under investigation and an assumed drag coefficient. It is apparent that the flow impulse is sporadic and its magnitude varies significantly. The three strongest impulses in this time segment are all associated with full grain dislodgment.
Figure 19.11 Segment of measured time series of (a) u2 (streamwise velocity), (b) impulse, (c) target grain movement. Reprinted with permission from Celik et al., 2010. Copyright 2010, American Institute of Physics.
The association between individual impulse events and grain entrainment, over the range of flow conditions given in Table 19.1 above, is shown in Figure 19.12. In this figure the drag force associated with an impulse event is parameterized by the value of the instantaneous u2, averaged over the duration of the event Ti (when the force exceeds the critical level) <u2>i. Then, the impulse FiTi is captured by the variable <u2>iTi, shown on the ordinate in Figure 19.12. The events that coincided with grain entrainment are indicated with a solid symbol while events which do not result in entrainment are identified with open symbols. Over 7600 impulse events are represented in Figure 19.12 with only 317 associated with grain dislodgment. The overwhelming majority of impulse events do not impart enough momentum to the grain to dislodge it and most fall below the lower edge of the shaded region illustrated in the figure. It is clear that no entrainment occurred below a particular impulse level and, above a certain impulse level each and every event resulted in grain dislodgment. The range between these two levels is indicated in the figure as a shaded zone. An overlap region is expected due to the variability of the drag coefficient, which had been previously investigated by Schmeeckle et al. (2007) and most recently by Celik et al. (2010).
Figure 19.12 Event impulse (represented as <u2>iTi) plotted versus event force (represented by <u2>i). Solid symbols indicate entrainment, open symbols correspond to events without target grain entrainment. Reprinted with permission from Celik et al., 2010. Copyright 2010, American Institute of Physics.
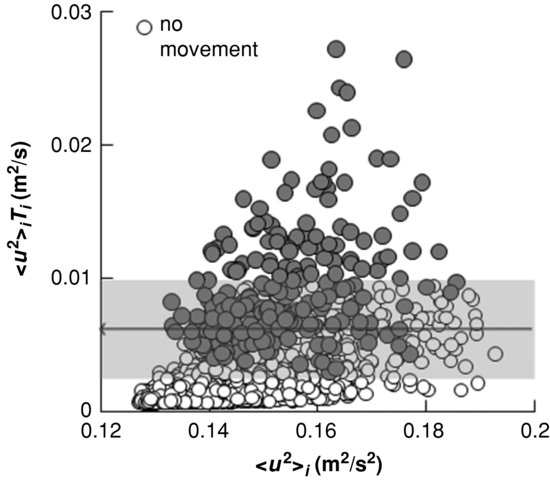
Although the force imparted by individual impulse events does not vary significantly from event to event (note the limited range of <u2>i values on the abscissa of Figure 19.12), the number of impulse events and entrainments is exceptionally sensitive to the flow condition. While u* increases in the experimental series (Table 19.1) by a little over 16% (τ* by 36%), the number of impulses increases by nearly an order of magnitude and the number of entrainments increases by two orders of magnitude. This sensitivity has been documented before in the context of bedload transport (see, for example, Paintal, 1971 and Helland-Hansen et al., 1974); that is, for conditions below the critical stress, the relation between bedload and the mean bed shear stress is well represented by a power law with the exponent between 5 and 7, e.g.  (Paintal data) and
  (Helland-Hansen et al. data), where q*b is the dimensionless bedload transport rate and τ* is the Shields stress.
Although the frequency of single-grain entrainment is not expected to be directly proportional to bedload transport, for a homogeneous bed and turbulence field, it is at least indicative of the general rate of bed material movement. For the data from the series of Table 19.1 we find the relation between the number of impulse events above critical, nI>Icrit, and τ* is given by  . The exponent is strikingly comparable to those reported for bedload transport at low transport rates. The critical impulse theory predicts this hypersensitivity as a consequence of the statistics of extreme magnitude impulse events.
19.8 Thoughts on coherent structures and grain entrainment
It has been firmly established that coherent flow structures are present in both smooth and rough wall turbulent channel flows. Research since the late 1980s clearly demonstrates the predominant role of sweeps in the initiation of motion of sediment and recent laboratory scale research suggests the following pattern of events for fully rough beds and large channel Reynolds numbers. Flow zones in the near wall region exhibit a pattern of low and high velocity streaks with a spanwise scale of several grain diameters and elongated in the streamwise direction. Bed surface pressures are relatively high beneath the low velocity streaks, which tends to reduce the lift on grains, simultaneous with reduced drag (on exposed grains) due to the lower streamwise velocity. A high velocity zone of fluid overlies the slower region in the bed forming a wedge like pattern with the shear layer between the two populated with generally prograde vortices (consistent with hairpin packets). This high velocity region eventually penetrates to the wall, perhaps as a consequence of retrograde vortices, and a high velocity streak (sweep event) occurs concomitant with a rapid decrease of bed surface pressure. Lift and drag increase and the potential for grain entrainment is high. Lift fluctuations are possible as well, as the result of advecting vortex cores above the wall. The requirement of a minimum impulse to initiate motion implies that the size and ‘strength’ of such sweep regions are significant parameters and many different combinations may lead to entrainment. That is, the impulse criterion for entrainment, if applied to sweep events, suggests that specific identification of sweep structures is important in order to determine the size, strength, and frequency of such regions and their potential or not for entraining sediment.
We regard sweeps as coherent structures (in the sense described by Adrian, 2007, and not random field fluctuations that happen to fall in Q4. They may be coherent structures, but they have not been targeted for direct identification and characterization in turbulent flows, as have vortices. It appears that the wall vortices (those prograde vortices that populate the shear layer in the wedge regions) have no direct relation to grain entrainment. Nevertheless, the sweep regions that are related to entrainment are likely to be associated with the vortices. Sweeping motions may occur in several ways in association with these hairpin vortices, including inrushes (u > 0, w < 0) induced by the prograde vortex head itself, with the head located upstream of the sweeping flow, high streamwise momentum (u > 0) induced toward the bed (w < 0) by the quasi-streamwise hairpin vortex on the outboard sides of the legs, and strong sweeping motions occurring after (upstream of) an ejection. To aid in the development of a predictive model, the characteristics of these various occurrences are needed, and so is a scheme by which these can be identified. We suggest a criterion that can be used for identification of sweep regions, similar to the methods used to identify vortices (e.g. swirl strength, λII). A criterion in the manner of Hunt et al. (1988) may be applicable for this purpose. Although Hunt et al. emphasize vortices and convergence regions in turbulent flows, they also refer to ‘streaming’ zones and a criterion is proposed for capturing such regions. These streaming zones represent regions with relatively higher velocity and with streamlines of relatively low curvature, both characteristic of sweeps. The key quantity used by Hunt et al. (in their notation) is
(19.7) 
where Eij is the symmetric deformation rate tensor and ωi is vorticity. The value of this parameter is determined throughout the flow field and with time and is then used to identify regions or zones within the flow with specific characteristics as determined by the value of II. To identify vortices, a negative threshold level of II is specified to emphasize the vorticity contribution compared to the deformation rate. They also include a second qualification on the pressure field to ensure the selection of vortices rather than regions with distributed vorticity. To identify ‘convergence’ zones within the flow field, a positive threshold is selected, de-emphasizing the vorticity contribution to II and placing more emphasis on the deformation rate and regions of flow stagnation. A different pressure constraint is also applied. A third category, streaming zones, is identified with two constraints:
(19.8) 
The value of IIS is chosen to avoid the high rotational regions of vortices as well as the high irrotational straining regions associated with convergence zones. Hunt et al. point out that with proper selection of IIS no two regions will overlap one another. By way of example, they apply these criteria to numerically modelled turbulence fields and demonstrate the general applicability of the criteria. It is also clear from their examples that all such zones, including streaming regions, can be identified in the main body of the flow and are not necessarily associated with wall interaction. That is, sweeps may be streaming zones, but streaming zone are not necessarily sweeps. Additional criteria to select sweeps from within the set of streaming zones may be necessary. Although we have not yet explored this approach, we believe that criteria along these lines have promise and their successful implementation would enhance our understanding of these flow events and their interaction with the bed.
19.9 Some additional thoughts on the impulse concept and particle entrainment
The suitability of the impulse concept has been demonstrated here, and more extensively elsewhere (Diplas et al., 2008; Celik et al., 2010; Valyrakis et al., 2010), for the two limiting cases, completely exposed and fully hidden spherical grains. Though the electromagnet results and analytical formulations deal with different degrees of particle exposure (by examining different combinations of mobile and base particle sizes), they nevertheless treat the problem under idealized particle arrangement conditions. For a particle arrangement more typical of field conditions, the grain size, shape, degree of exposure and packing density will vary significantly (e.g. Kirchner et al., 1990). In this more representative case, particle dislodgement will be due to the combined effect of drag and lift forces. Because impulse is the relevant criterion for determining particle dislodgement for each of the two limiting cases, it is expected to remain valid for the more general case of variable local grain topography (Diplas et al., 2008).
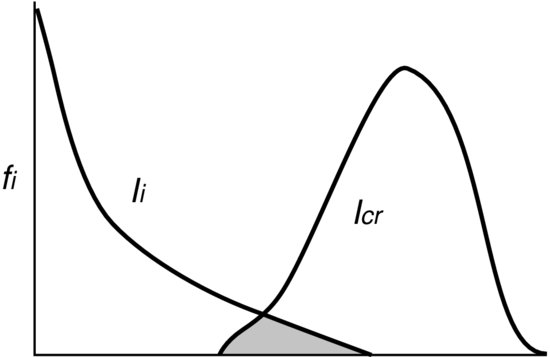
The impulse concept provides an additional degree of freedom, time, in identifying threshold conditions compared to the more traditional approaches that are based entirely on force magnitude, time-averaged or peak values. The corresponding distribution of extreme boundary stress events is reasonably well described by a Gaussian distribution (e.g. Grass, 1970; Celik et al., 2010), while the duration of these events is well represented by a long-tailed distribution. Extreme impulse events, the product of these two parameters, follow a long-tailed distribution as well. Following the conceptual description proposed by Grass (1970) in describing sediment in terms of the overlap region between a Gaussian distribution of the instantaneous fluid stress and a distribution of forces resisting particle movement, an adjustment will be necessary in lieu of the new findings. These distributions should be replaced by a long-tailed distribution (e.g. log-normal or power law) that is associated with the extreme impulse events generated by the turbulent flow fluctuations Ii and one related to the critical impulse necessary for the dislodgement of the various grain sizes and resting pocket geometries Icr available in the bed material (Figure 19.13; Celik et al., 2010; Valyrakis et al., 2011). Besides the qualitative differences, the latter approach implies the more frequent movement of larger particles, compared to those that the Gaussian distribution predicts, due to turbulent flow fluctuations (Mandelbrot and Hudson, 2006). Similar adjustments need to be employed in the various stochastic models that assume a Gaussian distribution of the instantaneous lift and/or drag forces for calculating bed load transport rates (e.g. Einstein, 1950).
Figure 19.13 Conceptual illustration of the impulse concept in defining the grain sizes of the bed material that are susceptible to movement due to the long-tailed distribution of extreme impulse events dictated by the turbulent flow. Reproduced from Valyrakis, et al., 2011. Copyright © 2011 American Geophysical Union, with permission from John Wiley & Sons. fi is the frequency of occurrence, Ii, the flow induced impulse on a grain, and Icrit, the critical impulse required for grain dislodgment.
19.10 Conclusion
The suggestion, made shortly after the recognition of the existence of coherent flow structures, that the initiation of sediment motion and its ultimate entrainment (whether into suspension or purely as bedload) is associated with flow structure/grain interaction has been established in both laboratory and field experiments. Experimental results, accumulated since the late 1980s and particularly since the early 2000s, demonstrate that the causal, predominant turbulent flow event for grain motion is a turbulent sweep. Such events are not random fluctuating occurrences of Q4 events, but sustained sweeping motions (with high streamwise velocity and momentum directed toward the bed) associated with sufficiently large flow regions that recur, and have sufficient duration (or size) to impart the necessary minimum momentum to dislodge sediment. Whether we use the definitions of coherent flow structures from Robinson (1991) or Adrian (2007), these sweeping regions qualify as coherent structures and themselves may be associated with other coherent flow events (the ubiquitous vortical structures spawned near both smooth and rough boundaries). To better understand and ultimately predict the initiation of grain entrainment and the rate of entrainment for near-threshold conditions, the characterization of these events, their capacity to impart momentum (impulse) and the scaling of these phenomena to the global characteristics of turbulent channel flow are needed. It is demonstrated that not only the magnitude, but also the duration of energetic near-bed turbulent events is relevant in predicting grain removal from the bed surface. Therefore the product of force and its duration, or impulse, is a more appropriate and universal criterion for uniquely identifying conditions suitable for particle dislodgement and resolves the particle dislodgement paradox. Although the stochastic nature of the phenomena and those of the bed geometry and sediment increase the complexity of the problem without supplanting the practical Shields criterion, the continuing advances in our experimental, analytical and computational capabilities assure the development of improved predictive models for the rates of entrainment for near threshold flow conditions.
19.11 Acknowledgement
The support of the National Science Foundation (grants EAR-0439663, EAR-0738759, and CBET-1033196) and the Army Research Office has been instrumental in the development of the ideas presented here and is therefore gratefully acknowledged. Furthermore, we would like to recognize the contributions of our graduate students: Dr. Ozan Celik, Krista Greer, WuRong Shih and Dr. Manousos Valyrakis.
Notation
| ν | kinematic viscosity |
| ρ | fluid density |
| ρs | sediment density |
| τo | space/time average boundary shear stress |
| τ* | dimensionless shear stress (Shields stress) |
| ωi | vorticity, i = 1,2,3 (components, x,y,z) |
| A | projected area of a grain |
| D50 | median sediment size |
| Eij | strain rate tensor |
| F | force |
| FD | electromagnetic force |
 |
dimensionless electromagnetic force |
| Fcrit | critical force |
| g | acceleration of gravity |
| H | flow depth |
| I | impulse |
| m | spherical grain mass |
| n | number of impulse events |
| pi | grain surface pressure (i = 1,2,3,4) |
| qb* | dimensionless bedload transport rate |
| Rp | particle Reynolds number |
| t | time |
| T | temporal duration |
 |
dimensionless duration |
| u | instantaneous streamwise velocity |
| U | average channel cross sectional streamwise velocity |
| v | vertical grain velocity (e.g. Equation 19.1) |
| V | Voltage |
| z | vertical displacement |
| Z | vertical displacement to achieve dislodgement |
| II | Eij2 − ωi2/2 |
References
Adrian, R.J. (2007) Hairpin vortex organization in wall turbulence. Physics of Fluids 19, 041301, 1–16.
Apperley, L.W. and Raudkivi, A.J. (1989) The entrainment of sediments by the turbulent flow of water. Hydrobiologia 176/771; 39–49.
Apsley, D.D, and Stansby, P.K. (2008) Bed-load sediment transport on large slopes: model formulation and implementation within a RANS solver. Journal of Hydraulic Engineering 134, 1440–1451.
Bagnold, R.A. (1973) The nature of saltation and of bed-load transport in water. Proceeding of the Royal Society of London A332, 473–504.
Balakrishnan, M. (1997) The Role of Turbulence on the Entrainment of a Single Sphere and the Effects of Roughness on Fluid-Solid Interaction. Ph.D. dissertation, Virginia Polytechnic Institute and State University, Blacksburg, Virginia, USA.
Brownlie, W.R. (1981) Prediction of flow depth and sediment discharge in open channels. Report KH-R-43A, W.M. Keck Laboratory of Hydraulics and Water Resources, California Institute of Technology, Pasadena, California.
Buffington, J.M. and Montgomery, D.R. (1997) A systematic analysis of eight decades of incipient motion studies, with special reference to gravel-bedded rivers. Water Resource Research 33, 1993–2029.
Cameron, S.M. (2006) Near-Boundary Flow Structure and Particle Entrainment. Ph.D. thesis, University of Auckland, New Zealand.
Celik, A.O., Diplas, P., Dancey, C.L. (2013) Instantaneous turbulent forces and impulse on a rough bed: Implications for initiation of bed material movement. Water Resources Research, DOI: 10.1002/wrcr.20210.
Celik, A.O., Diplas, P., Dancey, C.L. and Valyrakis, M. (2010) Impulse and particle dislodgement under turbulent flow conditions. Physics of Fluids 22, 1–13.
Celik, A.O. (2011) Experimental Investigation of the Role of Turbulence Fluctuations on Incipient Motion of Sediment. Ph.D. Dissertation, Virginia Tech, Blackssburg, VA, 180p.
Chou, Y.-J. and Fringer, O.B. (2010) A model for the simulation of coupled flow-bed form evolution in turbulent flows. Journal of Geophysical Research 115, C11041. DOI: 10.1029/2009JC006103.
Christensen, K.T. and Adrian, R.J. (2001) Statistical evidence of hairpin vortex packets in wall turbulence. Journal of Fluid Mechanics 431, 433–443.
Dancey, C.L., Diplas, P., Papanicolaou, A. and Bala, M. (2002) Probability of Individual Grain Movement and Threshold Condition. Journal of Hydraulic Engineering 128, 1069–1075.
Detert, M., Nikora, V. and Jirka, G.H. (2010) Synoptic velocity and pressure fields at the water-sediment interface of streambeds. Journal of Fluid Mechanics 660, 55–86.
Diplas P., Dancey, C.L., Celik, A.O. et al. (2008) The role of impulse on the initiation of particle movement under turbulent flow conditions. Science 322, 717–720.
Diplas, P., Celik, A.O., Dancey, C.L. and Valyrakis, M. (2010) Non-intrusive method for detecting particle movement characteristics near threshold flow conditions. Journal of Irrigation and Drainage Engineering, ASCE 136, 774–780.
Drake, T.G., Shreve, R.L., Dietrich, W.E. et al. (1988) Event detection and conditional averaging in unsteady Aeolian systems. Journal of Fluid Mechanics 192, 193–217.
Dwivedi, A., Melville, B. and Shamseldin, A.Y. (2010) Hydrodynamic forces generated on a spherical sediment particle during entrainment. Journal of Hydraulic. Engineering 136, 756–769.
Dwivedi, A., Melville, B., Shamseldin, A.Y. and Guha, T.K. (2011a) Flow structures and hydrodynamic force during sediment entrainment. Water Resources Research 47, W01509, DOI: 10.1029/2010WR009089.
Dwivedi, A., Melville, B., Shamseldin, A.Y. and Guha, T.K. (2011b) Analysis of hydrodynamic lift on a bed sediment particle. Journal of Geophysical Research 116, F02015, DOI: 10.1029/2009JF001584.
Einstein, H.A. and El-Samni, E.A. (1949) Hydrodynamic forces on a rough wall. Review of Modern Physics 21, 520–524.
Einstein, H.A. (1950) The Bed-Load Function for Sediment Transportation in Open Channel Flows. United States Department of Agriculture, Soil Conservation Service, Technical Report 1026.
Garcia, C., Cohen, H., Reid, I. et al. (2007) Processes of initiation of motion leading to bedload transport in gravel-bed rivers. Geophysical Research Letters 34, L06403. DOI: 10.1029/2006GL028865.
Grass, A.J. (1970) Initial instability of fine bed sand. Journal of the Hydraulics Division, ASCE 96, 619–632.
Grass, A.J. (1971) Structural features of turbulent flow over smooth and rough surfaces. Journal of Fluid Mechanics 50, 233–255.
Grass, A.J. (1983) The influence of boundary layer turbulence on the mechanics of sediment transport. In Mechanics of Sediment Transport: Proceedings of Euromech (eds B.M. Sumer and A. Muller) 156, A.A. Balkema, Rotterdam, pp. 3–17.
Heathershaw, A.D. and Thorne, P.D. (1985) Sea-bed noises reveal role of turbulent bursting phenomenon in sediment transport by tidal currents. Nature 316, 339–342. DOI: 10.1038/316339a0.
Helland-Hansen, E., Klingeman, P.C. and Milhous, R.T. (1974) Sediment transport at low Shields parameter values. Journal of the Hydraulics Division, ASCE 100, 261–265.
Hofland, B. (2005) Rock and Roll: Turbulence Induced Damage to Granular Bed Projections. Ph.D. dissertation, Technische Universiteit Delft, Delft, Netherlands.
Hofland, B., Booij, R. and Battjes, J. (2005) Measurement of fluctuating pressures on coarse bed material. Journal of Hydraulic Engineering 131, 770–781.
Hunt, J.C.R., Wray, A.A. and Moin, P. (1988) Eddies, Streams, and Convergence Zones in Turbulent Flows. Stanford University Center for Turbulence Research Report CTR S88, pp. 193–208.
Jackson, R.G. (1976) Sedimentological and fluid-dynamic implications of the turbulent bursting phenomenon in geophysical flows. Journal of Fluid Mechanics 77, 531–560.
Kanellopoulous, P.M. (1998) Incipient Motion Under Shallow Flow Conditions. MS thesis, Virginia Polytechnic Institute and State University, Blacksburg, VA.
Kirchner, J. W., Dietrich, W.E., Iseya, F. and Ikeda, H. (1990) The variability of critical shear stress, friction angle, and grain protrusion in water-worked sediments. Sedimentology 37, 647–672. DOI: 10.1111/j.1365-3091.1990. tb00627.x.
Leighly, J.B. (1934) Turbulence and the transportation of rock debris by streams. The Geographical Review 24, 453–464.
Mandelbrot, B.B. and Hudson, R.L. (2006) The Misbehavior of Markets: A Fractal View of Financial Turbulence, Basic Books, New York.
Miller, M.C., McCave, I.N. and Komar, P.D. (1977) Threshold of sediment motion under unidirectional currents. Sedimentology 24, 507–527.
Naden, P. (1987) An erosion criterion for gravel-bed rivers. Earth Surface Processes and Landforms 12, 83–93.
Nelson, J.M., McLean, S.R. and Wolfe, S.R. (1993) Mean flow and turbulence fields over two-dimensional bed forms. Water Resources Research 29, 3935–3953.
Nelson, J., Shreve, R.L., McLean, S.R. and Drake, T.G. (1995) Role of near-bed turbulence structure in bed-load transport and bed-form mechanics. Water Resources Research 31, 2071–2086.
Osterkamp, W., Heilman, P. and Lane, L.J. (1998) Economic considerations of a continental sediment-monitoring program. International Journal of Sediment Research 13, 12–24.
Paiement-Paradis, G., Buffin-Belanger, T. and Roy, A.G. (2003) Scaling for large turbulent flow structures in gravel-bed rivers. Geophysical Research Letters 30, 1723. DOI: 10.1029/2003GL017553.
Paiement-Paradis, G., Marquis, G. and Roy, A. (2010) Effects of turbulence on the transport of individual particles as bedload in a gravel-bed river. Earth Surface.Processes and Landforms 36, 107–116.
Paintal, A.S. (1971) A stochastic model of bed load transport. Journal of Hydraulic Research 9, 527–554.
Papanicolaou, A., Diplas, P., Dancey, C.L. and Balakrishnan, M. (2001) Surface roughness effects in near-bed turbulence: implications to sediment entrainment. Journal of Engineering Mechanics 127, 211–218.
Papanicolaou, A. N., Diplas, P., Evaggelopoulos, N. and Fotopoulos, S. (2002) Stochastic incipient motion criterion for spheres under various bed packing conditions. Journal of Hydraulic Engineering 128, 369–380.
Parker, G. (2008) Transport of gravel and sediment mixtures. In Sedimentation Engineering, edited by M.H. Garcia, ASCE Manual 110, 1132 p., Reston, Virginia, USA.
Prandtl, L. (1952) Essentials of Fluid Dynamics, Hafner, New York.
Raudkivi, A.J. (1966) Bed forms in alluvial channels. Journal of Fluid Mechanics 26, 507–514.
Robinson, S.K. (1991) Coherent motions in the turbulent boun-dary layer. Annual Review of Fluid Mechanics 23, 601–639.
Schmeeckle, M.W. and Nelson, J.M. (2003) Direct numerical simulation of bedload transport using a local dynamic boundary condition. Sedimentology 50, 279–301.
Schmeeckle, M.W., Nelson, J.M. and Shreve, R.L. (2007) Forces on stationary particles in near-bed turbulent flows. Journal of Geophysical Research 112, F02003. DOI: 10.1029/2006JF000536.
Shields, A. (1936) Anwendung der Aehnlichkeitsmechanik und der Turbulenzforschung auf die Geschiebebewegung, Mitt. 26, Preuss. Versuchsanst. fuer Wasserbau und Schiffbau, Berlin.
Smart, G.M. and Habersack, H.M. (2007) Pressure fluctuations and gravel entrainment in rivers. Journal of Hydraulic Research 45, 661–673.
Smith, C.R. (1996) Coherent flow structures in smooth-wall turbulent boundary layers: facts, mechanisms and speculation. In Coherent Flow Structures in Open Channels (eds P.J. Ashworth, J.L. Best, S.J. Bennett and S.J. McLelland). John Wiley & Sons, Ltd, Chichester, pp. 1–39.
Sumer, B.M., Chua, L.H., C., Cheng, N.-S. and Fredsoe, J. (2003) Influence of turbulence on bed load sediment transport. Journal of Hydraulic Engineering 129, 585–596.
Sutherland, A.J. (1967) Proposed mechanism for sediment entrainment by turbulent flows. Journal of Geophysical Research 72, 6183–6194.
Syvitski, J.P.M., Vorosmarty, C.J., Kettner, A.J. and Green, P. (2005) Impact of humans on the flux of terrestrial sediment to the global coastal ocean. Science 308, 376–380.
Valyrakis, M., Diplas, P., Dancey, C. L., Greer, K. and Celik, A.O. (2010) The role of instantaneous force magnitude and duration on particle entrainment. Journal of Geophysical Research 115, 1–18. F02006. DOI: 10.1029/2008JF001247.
Valyrakis, M., Diplas, P. and Dancey, C.L. (2011) Entrainment of coarse grains in turbulent flows: an extreme value theory approach. Water Resources Research 47, 1–17. W09512. DOI: 10.1029/2010WR010236.
Varenius, B. (1664) Geographia Generalis in qua Affectiones Generales Telluris Explicantur, Elsevier, Amsterdam.
Vollmer, S. and Kleinhans, M.G. (2007) Predicting incipient motion, including the effect of turbulent pressure fluctuations in the bed. Water Resources Research 43, W05410. DOI: 10.1029/2006WR004919.
Whipple, K.X. (2004) Bedrock rivers and the geomorphology of active orogens. Annual Review of Earth and Planetary Sciences 32, 151–185.
White, C.M. (1940) The equilibrium of grains on the bed of a stream. Proceedings of the Royal Society of London A174, 322–338.


