CHAPTER 5
Electric Power Generation as Cloud Infrastructure Analog
5.1 Power Generation as a Cloud Infrastructure Analog
As shown in the hype cycle (Figure 5.1), production of electric power via thermal power plants is very mature while production of virtual compute, memory, storage, and networking resources to serve applications via cloud infrastructure is still rapidly evolving. Fortunately, there are fundamental similarities between these two apparently different businesses that afford useful insights into how the infrastructure service provider operational practices are likely to mature.
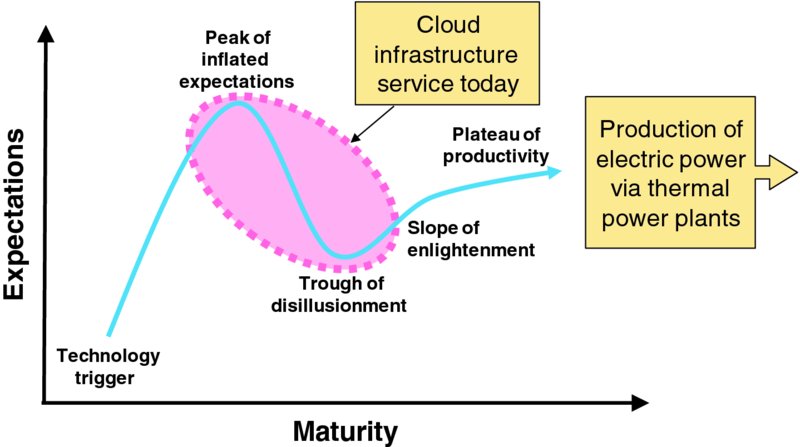
Figure 5.1 Relative Technology Maturities
Table 5.1 frames (and Figure 5.2 visualizes) the highest level similarities between production of electricity via thermal power plants for utilities and production of virtual compute, memory, storage, and network resources by cloud infrastructure service providers for application service providers. Power generating organizations use coal or other fuel as input to boiler/turbine/generator systems while infrastructure service providers use electricity as input to cloud data centers packed with servers, storage devices, and network gear. Others in the ICT have offered a similar pre-cloud analogy as “utility computing” so this analogy is not novel.
Table 5.1 Analogy between Electricity Generation and Cloud Infrastructure Businesses
| Attribute | Electric Power | Cloud Infrastructure |
| Target organization | Power generating organization | Infrastructure service provider of public or private cloud |
| Target organization's customer | Load-serving entity (e.g., utility) | Application service provider (ASP), which will be in the same larger organization as infrastructure service provider for private clouds |
| Target's customers' customer | Residential, commercial, and industrial power users | End users of applications |
| Target organization's product | Bulk/wholesale electrical power for target customer to retail | Virtualized compute, memory, storage, and networking resources to host applications |
| Location of production | Power station | Data center |
| Means of production | Thermal generating equipment | Commodity servers, storage and networking gear, and enabling software |
| Input to production | Fuel (coal, natural gas, petroleum, etc.) | Electricity |
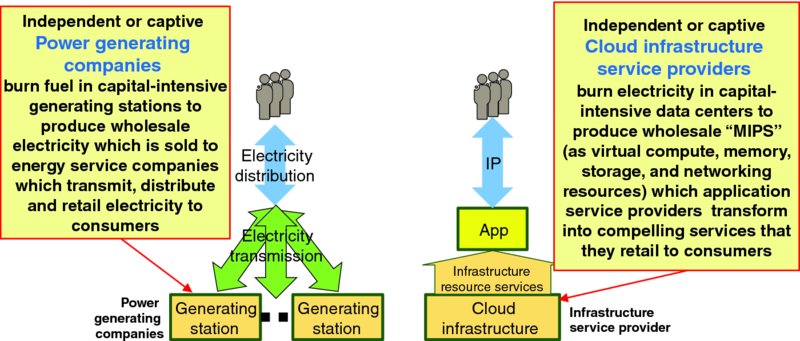
Figure 5.2 Electricity Generation and Cloud Infrastructure Businesses
The following sections consider parallels and useful insights between electric power generation via thermal generating systems and cloud computing infrastructure:
- Business context (Section 5.2)
- Business structure (Section 5.3)
- Technical similarities (Section 5.4)
- Impedance and fungibility (Section 5.5)
- Capacity ratings (Section 5.6)
- Bottled capacity (Section 5.7)
The following sections consider several insightful similarities between electricity market and grid operations and cloud infrastructure:
- Location of production considerations (Section 5.8)
- Demand management (Section 5.9)
- Demand and reserves (Section 5.10)
- Service curtailment (Section 5.11)
- Balance and grid operations (Section 5.12)
For consistency, this chapter primarily uses the North American Electric Reliability Corporation's continent wide terminology and definitions from “Glossary of Terms Used in NERC Reliability Standards” (NERC, 2015).
5.2 Business Context
Figure 5.3 highlights the essential points of commercial electric power systems:
- Power consumers like residential, commercial, and industrial customers are considered load which is formally defined as “an end-use device or customer that receives power from the electric system” (NERC, 2015). Today, some power consumers also generate power via photovoltaic panels or other small-scale power production facilities; however, that distinction is not important in this treatment.
- Load-serving entities (LSEs), such as the power companies that serve each customers' home with electricity, arrange to generate, transmit, and distribute electric power to meet the energy requirements of power consumers.
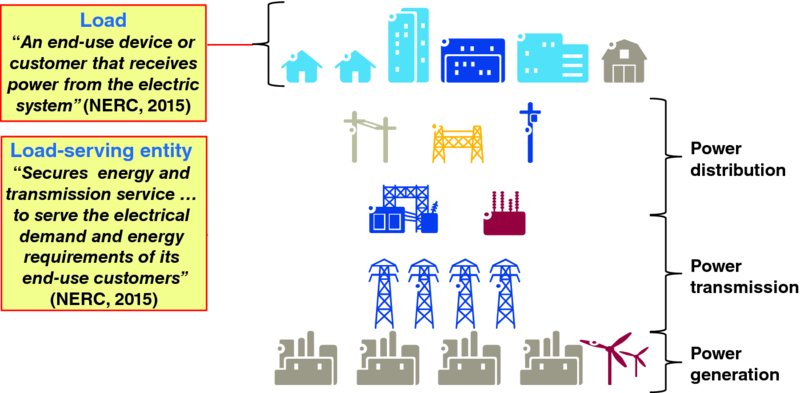
Figure 5.3 Simplified View of the Electric Power Industry
A primary concern of load-serving entities is economic dispatch, which is broadly defined as “operation of generation facilities to produce energy at the lowest cost to reliably serve consumers, recognizing any operational limits of generation and transmission facilities.”1 Note the similarity between the power industry's goal of economic dispatch and the lean cloud computing goal from Chapter 3: Lean Thinking on Cloud Capacity Management; sustainably achieve the shortest lead time, best quality and value, highest customer delight at the lowest cost.
As shown in Figure 5.4, aggregate demand for electric power varies with time of day as well as with day of week and exhibits seasonal patterns of demand. Note that demand for a particular application service – and thus the demand for infrastructure resources hosting that application – can vary far more dramatically from off-peak to peak periods than aggregate electric power demand varies. Larger demand swings for individual applications, coupled with materially less fungible resources, makes cloud capacity management more complicated than management of generating capacity for a modern power grid.
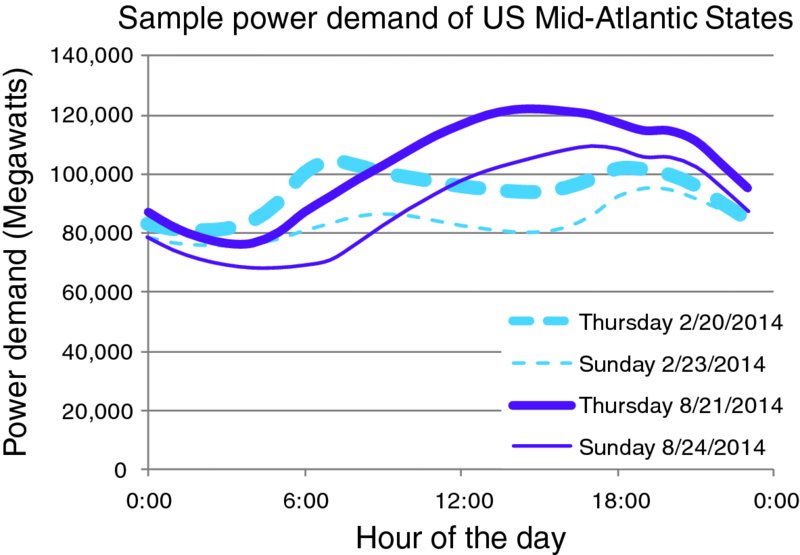
Figure 5.4 Sample Daily Electric Power Demand Curve2
Technical, business, regulatory, and market factors, as well as demand variations result materially different marginal power costs, as shown in Figure 5.5. Careful planning and economic dispatch are important to controlling a utility's total cost for electric power. As has been seen in California's electricity market, free market pricing for electricity creates opportunities for2Source: both3Source: significant profits during peak usage and capacity emergency periods, and opportunities for mischief manipulating those capacity emergencies. It is unclear if cloud pricing will ever evolve capacity dispatch (a.k.a., variable operating cost) curves as dramatic as shown in Figure 5.5.
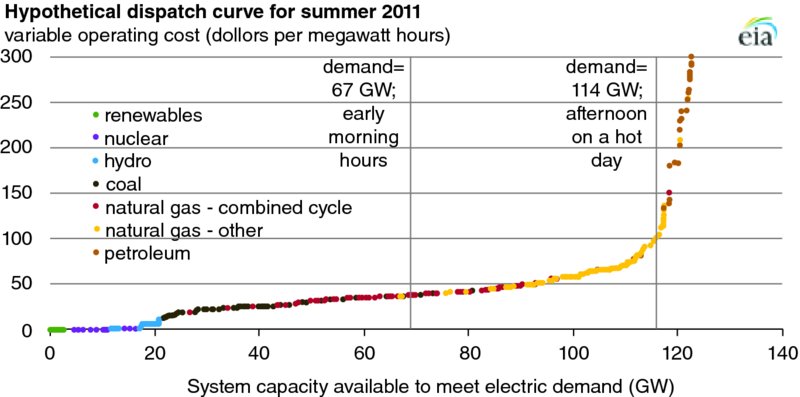
Figure 5.5 Hypothetical Electricity Dispatch Curve3
It is straightforward to objectively and quantitatively measure quality of electric power service by considering the following:
- Availability – the absence of service outages4
- Voltage – consistent delivery of rated voltage (e.g., 120 volts of alternating current in North America)
- Frequency – consistent delivery at rated frequency (e.g., 60 hertz in North America)
- No transients – absence of voltage transient events
Conveniently, electricity service quality can be probed at many points throughout the service delivery path enabling rigorous and continuous service quality monitoring. In contrast, infrastructure service quality delivered to application software instances is more challenging to measure.
5.3 Business Structure
Value chains are considered vertical integrated when all key activities are performed by a single organization (e.g., a large corporation) and horizontally structured when key value is purchased via commercial transactions from other companies. An electrical utility that offers retail electricity to end users may source wholesale power from either the utility's captive power generating organizations or on the open market from independent power generators. In the ICT industry, an application service provider can typically source cloud infrastructure capacity from either public cloud or private cloud service providers.
Public cloud services will be offered to application service providers at market prices. Pricing of private cloud resources for application service providers is determined by the organization's business models, but those costs are likely to be related to the infrastructure service provider organization's costs, summarized in Table 5.2.
Table 5.2 Cost Factor Summary
| Cost Factors | Electric Power Producer | Cloud Infrastructure Service Provider |
| Real estate | Power plant structures and infrastructure | Data center facility |
| Production equipment | Thermal generating plant | Compute, storage and networking gear, and necessary software licenses |
| Fuel costs | Coal, natural gas, petroleum | Electricity to power cloud infrastructure, including fixed electricity service charges |
| Non-fuel variable costs | Plant startup costs
Plant shutdown costs |
Water for cooling |
| Operations | Plant operations center and staff | Data center operations systems, software license fees, staff, etc. |
| Maintenance | Routine and preventative maintenance of thermal plantRepairs | Hardware and software maintenance feesHardware, software, and firmware upgradesRepairs |
| Environmental compliance costs | Yes | Yes |
Notable differences between electric power production and cloud infrastructure costs are given in Table 5.2:
- Price volatility of critical inputs – the primary fuels for thermal electricity generating equipment – coal, oil, and natural gas – are commodities with prices that rapidly and dramatically rise and fall across time. This price volatility prompts utilities to carefully select fuel supplies across time, use future contracts to hedge price volatility risks as well as manage inventories of coal and oil. Fortunately, prices of all cloud computing inputs are far less volatile.
- Investment in automation of service management – while operational policies and procedures for efficient production of electric power are now well understood, automation of service, application and virtual resource lifecycle management to enable on-demand self-service, rapid elasticity and greater service agility with lower operating expenses require significant upfront costs to organizations to engineer, develop, and deploy automated lifecycle management mechanisms.
- Depreciation schedule – physical compute, memory, storage, and networking equipment has a vastly shorter useful life than most thermal power generating equipment and thus will be depreciated over a few years rather than over a few decades.
- Granularity of equipment purchases – thermal generating elements tend to be sold by equipment suppliers as very large individual units generating tens or hundreds of megawatts as opposed to physical compute, memory, storage, and networking equipment which is generally offered in units no larger than a shipping container of equipment and may be purchased and installed by the rack or even smaller unit of capacity (e.g., blade).
- Rapid pace of innovation – Moore's Law and other factors are driving rapid innovation in physical compute, memory, storage, and networking technologies – as well as virtualization, power management, and other software technologies – that underpin cloud infrastructure service. Thus, infrastructure hardware and software products rapidly become obsolete. Boiling water to spin turbines to drive generators is now a mature and stable technology.
- Much shorter lead time on infrastructure equipment – commercial off-the-shelf (COTS) server, storage, and Ethernet equipment can often be delivered in days or weeks; multi-megawatt power generating equipment is not generally available for just-in-time delivery.
- Frequency of maintenance events – rather than a small number of massive boilers, turbines, and generators in a thermal power plant, cloud data centers contain myriad servers, switches, and storage systems, each of which requires regular software/firmware patches, updates, upgrades, retrofits, and perhaps other maintenance actions
- More efficient long haul transmission – while electric power experiences significant losses when transmitted over great distances, digital information can be reliably transmitted across great distances with negligible data loss, albeit at a cost of 5 milliseconds of incremental one-way latency for every 1000 kilometers (600 miles) of distance. Thus, it is often economically advantageous to place cloud data centers physically close to cheaper electric power to reduce waste in long haul power transmission.
In addition, the immaturity of the cloud infrastructure ecosystems means that pricing models, cost structures, and prices themselves may change significantly over the next few years as the market matures.
5.4 Technical Similarities
Electric power across the globe is generated by burning fuel in a boiler to produce steam which spins a turbine which drives a generator. Nominally 2% to 6% of the generator's gross power output is consumed by the pumps, fans, and auxiliary systems supporting the system itself (Wood et al., 2014). As shown in Figure 5.6, cloud infrastructure equipment is roughly analogous to thermal generating plants. Instead of capital intensive boiler/turbine/generator units, cloud infrastructure service providers have myriad servers, storage, and networking equipment installed in racks or shipping containers at a data center. Instead of coal, natural gas, or some other combustible fuel as input, cloud infrastructure equipment uses electricity as fuel. Instead of electric power as an output, infrastructure equipment serves virtualized compute, memory, storage, and networking resources to host application software. Of course, some of the gross processing throughput is consumed to serve hypervisors and other infrastructure management software, so the net available compute power is lower than the gross compute power.
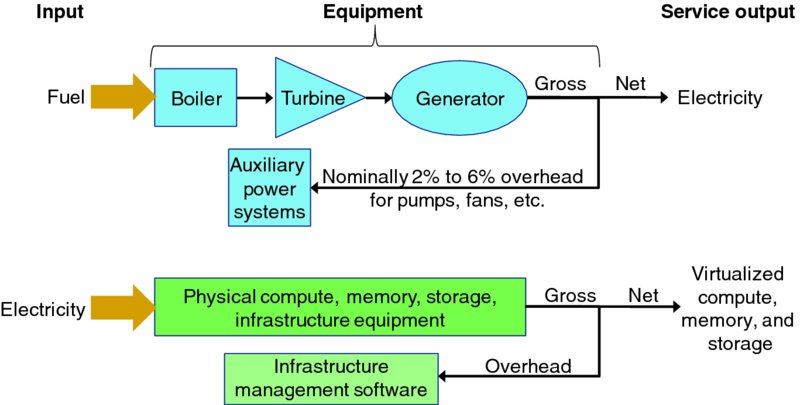
Figure 5.6 Thermal Plants and Cloud Infrastructure
The fundamental5Source: variable cost of a thermal plant is fuel consumption which is visualized with heat rate charts, such as Figure 5.7. The X-axis is generator output (e.g., megawatts) and the Y-axis is heat rate (e.g., British Thermal Units of heat applied per hour). Even at “idle” a thermal plant has a minimum fuel consumption rate (fmin) which produces some minimum power output (Pmin). As fuel consumption rate increases to some maximum rate (fmax), the power output increases to some maximum rate (Pmax).
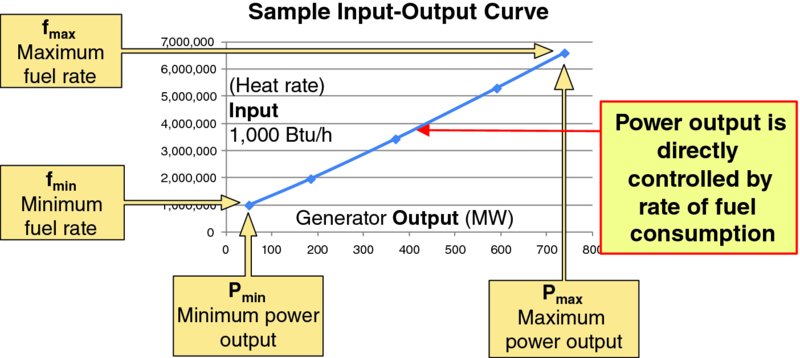
Figure 5.7 Sample Heat Rate Chart
The power industry is fortunate in that generator output can be objectively measured and quantified in Watts, the SI international standard unit of power. In contrast, the ICT industry has no single standard objective and quantitative measurement of data processing output, so the term MIPS for “million instructions per second” or the CPU's clock frequency is casually used to crudely characterize the rate of computations. The variable nature of individual “instructions” executed by different processing elements coupled with ongoing advances in ICT technology means that a single standard objective and quantitative measurement of processing power is unlikely, so objective side-by-side performance comparisons of cloud computing infrastructure elements is uncommon. Recognizing the awkwardness of direct side-by-side comparisons of processing power, ICT equipment suppliers often focus on utilization of the target element's full rated capacity, so “100% utilization” means the equipment is running at full rated capacity and 0% utilization means the equipment is nominally fully idle. Knowing this, one recognizes Figure 5.8 as a crude proxy “heat rate” chart for a sample commercial server. The X-axis gives processor utilization (a.k.a., CPU occupancy) as a proxy for useful work output and the Y-axis gives electrical power consumed as “fuel” input. Note that work output increases linearly as power/fuel input rises from fmin of 1321 watts to fmax of 4069 watts. Note that advanced power management techniques like dynamic voltage and clock frequency scaling can automatically modulate power consumption but are not generally directly controlled by human operators. Activation and deactivation of these advanced power management mechanisms might not produce the smooth, linear behavior of Figure 5.8, but they do enable power consumption to vary with processing performed.
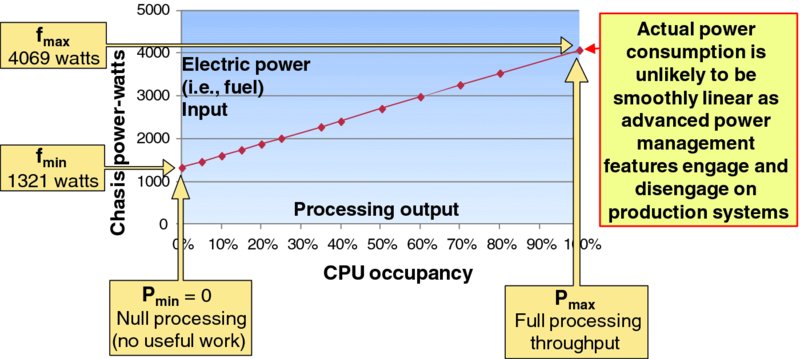
Figure 5.8 Sample Server Power Consumption Chart
Table 5.3 compares the unit startup process for a thermal power unit and a cloud infrastructure server node. The actual time from notification to ramp start is nominally minutes for cloud infrastructure nodes and fast starting thermal plants, with specific times varying based on the particulars of the target element. After a unit is online it begins ramping up useful work: thermal power units often take minutes to ramp up their power output and infrastructure server nodes take a short time to allocate, configure and activate virtual resources to serve applications.
Table 5.3 Unit Startup Process
| Thermal Power Unit | Cloud Infrastructure Server Node |
| Notification – order received to startup a unit and bring it into service | |
| Fire up the boiler to make steam – the time to build a head of steam varies based on whether the unit is (thermally) cold or if the unit was held (thermally) warm at a minimum operating temperature | Apply electric power to target node and pass power on self-test |
| Spin up turbines – spinning large, heavy turbines up to speed takes time | Boot operating system, hypervisor, and other infrastructure platform software |
| Sync generator to grid and connect – the thermal unit's generator must be synchronized to the power grid before it can be electrically connected | Synchronize node to cloud management and orchestration systems |
| Ramp Start – useful output begins ramping up | |
| Ramp up power – once connected to the grid the thermal unit can ramp up power generation. Ramp rates of power production units are generally expressed in megawatts per minute | Begin allocating virtual resource capacity on target node to applications |
Both thermal units and infrastructure nodes have noninstantaneous shutdown processes. Transaction costs associated with startup and shutdown actions are well understood in the power industry, as well as minimum generator run times and minimum amount of time that a generator must stay off once turned off. As the ICT industry matures, the transaction costs associated with powering on or powering off an infrastructure node in a cloud data center will also become well understood.
5.5 Impedance and Fungibility
Electric power is essentially a flow of electrons (called current) “pushed” with a certain electrical pressure (called voltage). Power is the product of the electrical pressure (voltage) and the volume of flow (current). Electrical loads and transmission lines have preferred ratios of voltage/pressure to current/flow, and this ratio of electrical voltage/pressure to current/flow is called impedance. To maximize power transfer, one matches the impedance of the energy source with the impedance of the load; impedance mismatches result in waste and suboptimal power transfer. Different electrical impedances can be matched via a transformer. As a practical matter electrical services are standardized across regions (e.g., 120 or 240 volts of current that alternates at 60 cycles per second in North America) so most electrical loads (e.g., appliances) are engineered to directly accept standard electric power and perform whatever impedance transformations and power factor corrections are necessary internally.
Application software consumes compute, networking, and storage resources, having the right ratio of compute, networking, and storage throughputs available to the software component results in optimal performance with minimal time wasted by the application user waiting for resources and minimal infrastructure resource capacity allocated but not used (a.k.a., wasted). Unfortunately, while an electrical transformer can efficiently convert the voltage:current ratio to whatever a particular load requires, the ratios of compute, memory, storage and networking delivered by a cloud service provider are less malleable.
Electric power is a fungible commodity; typically consumers neither know nor care which power generation plants produced the power that is consumed by their lights, appliances, air conditioners, and so on. Cloud compute, memory, storage, and networking infrastructure differs from the near perfect fungibility of generated electric power in the following ways:
- Lack of standardization – key aspects of commercial electric power are standardized across the globe so that a consumer can purchase any electrical appliance from a local retailer with very high confidence that the appliance's electrical plug will fit the electrical outlets in their home and that the appliance will function properly on their residential electric power service. Computer software in general, and cloud software in particular, has not yet reached this level of standardization.
- “Solid” versus “liquid” resource – electricity is a fluid resource in that it easily flows in whatever quantity is desired; in contrast, infrastructure resources are allocated in quantized units, such as an Amazon Web Services m3.large virtual machine with 2 vCPUs, 7.5 GB of memory and 32 GB of storage.
- Impedance matching is inflexible – electrical loads which need different ratios between voltage and current can easily transform the commercially delivered power to match the need. Processing, memory, networking, and storage are fundamentally different types of resources, so it is generally infeasible for infrastructure consumers to tweak the resource ratios from the preconfigured resource packages offered by the infrastructure service provider.
- Sticky resource allocation – once an application's virtual resource allocation is assigned to physical infrastructure equipment that application load often cannot seamlessly be moved to another infrastructure element. Many infrastructure platforms support live migration mechanisms to physically move an application workload from one host to another and many applications are engineered to tolerate live migration actions with minimal user service impact; however, those live migration actions themselves require deliberate action to select a target virtual resource, a new physical infrastructure destination element, execute the migration action, and mitigate any service impairments, anomalies or failures that action produces. In contrast, power generators can ramp up and down with little concern for placement of customer workloads.
- Powerful client devices – smartphones, laptops, and other modern client devices have significant processing capabilities, so application designers have some architectural flexibility regarding how much processing is performed in the cloud versus how much is performed by the client devices themselves. These device-specific capabilities permit service architectures to evolve differently over time for different devices.
- Smooth versus bursty service consumption – aggregate electricity generation and consumption is fundamentally continuous over a timeframe of milliseconds or seconds because the inertia of electric motors, capacitance, inductance, and general operating characteristics of load devices are engineered to smoothly and continuously draw current. While air conditioners, lights, refrigerators, commercial and industrial electric motors, and so on, can be turned on and off, electricity consumption during the on period is fairly consistent, and the on/off events are not generally synchronized. Many software applications are notoriously bursty in their use of resources, often exhibiting short periods of processing followed by periods when the processor waits for storage or networking components to provide data. Statistical sharing of computer resources via time-shared operating systems explicitly leverages this notion of choppy service consumption.
- Isolated resource curtailment – because electricity is a fluid fungible resource, all loads in a particular area generally experience the same service quality. For example, when the power grid is stressed, all of the subscribers in a particular neighborhood, town, or region might experience a service brownout. In contrast, cloud infrastructure loads are assigned to individual physical elements, so the resource quality delivered by one particular application instance might be adversely impacted by resource demands of other application components that shares physical compute, memory, storage, or network resources. Infrastructure service quality delivered to other application components in the same physical data center that rely on infrastructure equipment that is not impacted will presumably be unaffected.
An important practical difference between electric power and computing is that technologies exist like batteries, pumped storage, thermal storage, and ultracapacitors which enable surplus power to be saved as a capacity reserve for later use, thereby smoothing the demand on generating capacity, but excess computing power cannot practically be stored and used later. Another important difference is that physical compute, memory, storage, and networking equipment benefits from Moore's Law, so equipment purchased in the future will deliver significantly higher performance per dollar of investment than equipment purchased today. In contrast, boilers, turbines, and generators are based on mature technologies that no longer enjoy rapid and exponential performance improvements.
5.6 Capacity Ratings
The power industry uses the term rating for a concept analogous to how the ICT industry uses capacity. Figure 5.9 visualizes three NERC (2015) standard rating types:
- Normal rating (a.k.a., nameplate capacity, claimed capacity, rated capacity) – “defined by the equipment owner that specifies the level of electrical loading, usually expressed in megawatts (MW) or other appropriate units that a system, facility, or element can support or withstand through the daily demand cycles without loss of equipment life” (NERC, 2015). ICT suppliers routinely quote the “normal” operating temperatures, voltages, and environmental extremes that the equipment can withstand with no reduction in useful service life or equipment reliability.
- Emergency rating – “defined by the equipment owner that specifies the level of electrical loading or output, usually expressed in megawatts (MW) or Mvar or other appropriate units, that a system, facility, or element can support, produce, or withstand for a finite period. The rating assumes acceptable loss of equipment life or other physical or safety limitations for the equipment involved” (NERC, 2015). As an intuitive example, consider the H variant of the World War II era P-51 Mustang fighter airplane which had a normal takeoff rating 1380 horsepower and a water injection system that delivered a war emergency power rating of 2218 horsepower at 10,200 feet; the engine could only operate at the war emergency power rating for a brief time and it compromised the engine's service life, but one can imagine situations where that tradeoff is extremely desirable to the pilot. ICT equipment can operate outside of normal ratings for short periods, such as overclocking a processor or while a cooling element failure is being repaired; prolonged operation at emergency ratings will shorten the useful service life and degrade the equipment's hardware reliability.
- Stability limit – “the maximum power flow possible through some particular point in the system while maintaining stability in the entire system or the part of the system….” (NERC, 2015). Stability is defined by NERC (2015) as “the ability of an electric system to maintain a state of equilibrium during normal and abnormal conditions or disturbances.” ICT equipment fails to operate above certain limits, such as when extreme temperatures cause protective mechanisms to automatically shut circuits down.
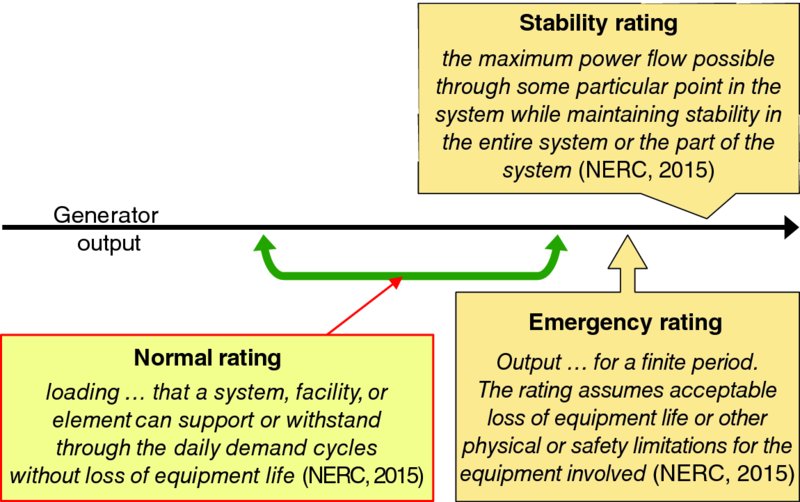
Figure 5.9 Standard Power Ratings
While the throttle on a power generator and propulsion system can sometimes be pushed beyond “100%” of rated power under emergency conditions, computer equipment does not include an intuitive throttle that be pushed beyond 100%. However, mechanisms like coercing CPU overclocking, raising operating temperature of processing components, and increasing supply voltage delivered to some or all electronic components may temporarily offer a surge of processing capacity which might be useful in disaster recovery and other extraordinary circumstances.
5.7 Bottled Capacity
The power industry uses the term bottled capacity to mean “capacity that is available at the source but that cannot be delivered to the point of use because of restrictions in the transmission system” (PJM Manual 35). Insufficient transmission bandwidth, such as due to inadequately provisioned or overutilized access, backhaul, or backbone IP transport bandwidth can trap cloud computing capacity behind a bottleneck as well; thus, one can refer to such inaccessible capacity as being bottled or stranded. This paper considers capacity within a cloud data center, not bottlenecks that might exist in transport and software defined networking that interconnects those data centers and end users.
5.8 Location of Production Considerations
Wholesale electric power markets in many regions are very mature and load-serving entities routinely purchase power from other utilities and independent generators. In addition to the cost of generating electricity at the site of production, that power must often flow across third-party transmission facilities to reach the consuming utility's power transmission network. Flowing across those third-party facilities both wastes power via electricity transmission losses and consumes finite power transmission grid capacity as congestion. Power markets rollup these factors into the locational marginal price (LMP) which is the price charged to a consuming utility. This price includes:
- Cost of producer's energy production
- Congestion and transmission charges for transmitting power from the producer to the consuming utility
- Power losses in transmission
Figure 5.10 gives an example of day-ahead LMP data.
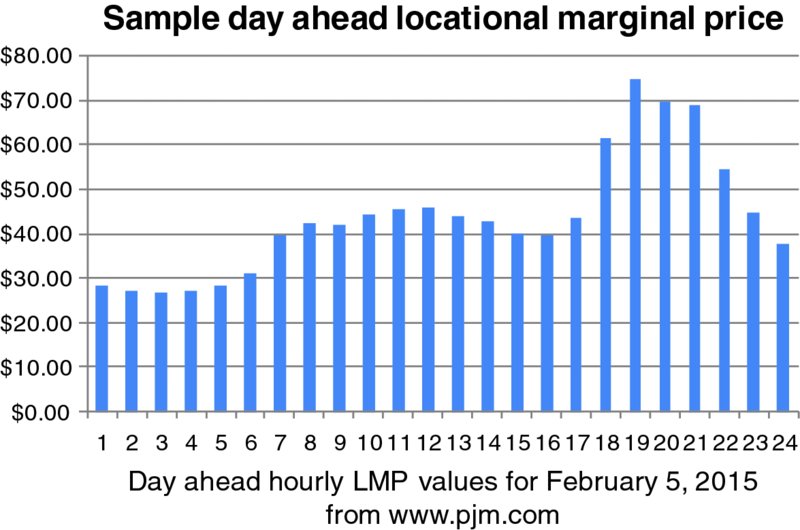
Figure 5.10 Sample Day-Ahead Locational Marginal Pricing
Application services do not have the same physical losses and transmission constraints as electric power when service is hauled over great distances, so there may not be direct costs for transmission losses to consider; for example, configuration of networking equipment and facilities – and even software limitations – can impose practical limits. However, the farther the cloud infrastructure is from the users of the application hosted on that infrastructure (and software component instances supporting the target application), the greater the communications latency experienced by the end user. The finite speed of light means that each 600 miles or 1000 kilometers of distance adds nominally 5 millisecond of one-way transmission latency, and this incremental latency accrues for any transactions or interactions that require a request and response between two distant entities. In addition, greater distance can increase the risk of packet jitter and packet loss, which adds further service latency to timeout and retransmit the lost packet. Congestion (e.g., bufferbloat) through networking equipment and facilities can also increase packet latency, loss, and jitter.
Figure 5.11 visualizes the practical implications of locational sensitivity on cloud-based applications. As explained in Section 1.3.1: Application Service Quality, application quality of service is often quantified on a 1 (poor) to 5 (excellent) scale of mean opinion score (MOS). Transaction latency is a key factor in a user's quality of service for many applications, and the incremental latency associated with hauling request and response packets between the end user and the data center hosting the application's software components adds to the user-visible transaction latency. The farther the user is from the data center hosting the applications software components, the greater the one-way transport latency. The structure of application communications (e.g., number of one-way packets sent per user-visible transaction), application architecture, and other factors impact the particular application's service latency sensitivity to one-way transport latency. The sensitivity of the application's service quality can thus be visualized as in Figure 5.11 by considering what range of one-way packet latencies are consistent with excellent (MOS = 5), good (MOS = 4), and fair (MOS = 3) application service quality, and the distances associated with those application service qualities can then be read from the X-axis. Mature application service providers will engineer the service quality of their application by carefully balancing factors like software optimizations and processing throughput of cloud resources against the physical distance between end users and the cloud data center hosting components serving those users. Different applications have different sensitivities, different users have different latency expectations, and different business models support different economics, so the locational marginal value will naturally vary by application type, application service provider, end user expectations, competitors' service quality, and other factors. Service performance of traditional equipment will naturally shape expectations of cloud infrastructure and applications hosted on cloud infrastructure. Application service providers must weigh these factors – as well as availability of infrastructure capacity – when deciding which cloud data center(s) to deploy application capacity and which application instance should serve each user.
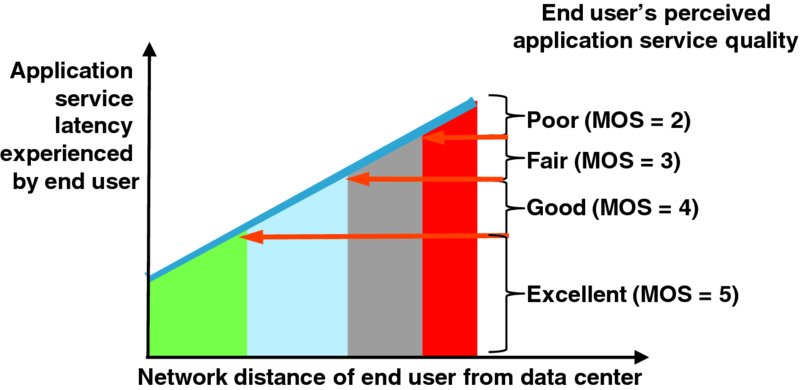
Figure 5.11 Locational Marginal Value for a Hypothetical Application
5.9 Demand Management
Generating plants and transmission facilities have finite capacity to deliver electricity to subscribers with acceptable power quality. Potentially nonlinear dispatch curves (e.g., Figure 5.5) mean that it is sometimes either commercially undesirable or technically infeasible to serve all demand. The power industry addresses this challenge, in part, with demand-side management, defined by NERC (2015) as “all activities or programs undertaken by Load-Serving Entity or its customers to influence the amount or timing of electricity they use.” Customers can designate some of their power use as interruptible load or interruptible demand which is defined by NERC (2015) as “Demand that the end-use customer makes available to its Load-Serving Entity via contract or agreement for curtailment,” where curtailment means “a reduction in the scheduled capacity or energy delivery.” A powerful technique is direct control load management, defined by NERC (2015) as “Demand-Side Management that is under the direct control of the system operator. [Direct control load management] may control the electric supply to individual appliances or equipment on customer premises. [Direct control load management] as defined here does not include Interruptible Demand.”
The parallels to infrastructure service: demand management of infrastructure service can include (1) curtailing resource delivery to some or all virtual resource users and/or (2) pausing or suspending interruptible workloads. Ideally the infrastructure service provider has direct control of load management of at least some workload, meaning that they can pause or suspend workloads on-the-fly to proactively manage aggregate service rather than enduring the inevitable delays and uncertain if workload owners (i.e., application service provider organizations) are expected to execute workload adjustment actions themselves. This topic is considered further in Chapter 7: Lean Demand Management.
5.10 Demand and Reserves
Online power generating capacity is factored into:
- Demand – “the rate at which energy is delivered to or by a system or part of a system” (NERC, 2015); this is power that is serving current demand.
- Operating reserve – “that capability above the firm system demand required to provide for regulation, load forecasting error, equipment forced and scheduled outages and local area protection” (NERC, 2015); the ICT industry might call this spare, redundant, or standby capacity. Operating reserves are subdivided by two criteria:
- Supply versus demand – is reserve capacity made available by ramping up power generation and thereby increasing supply, or by interrupting or removing load and thereby reducing demand?
- Fulfillment time – is the reserve capacity available within the industry's standard disturbance recovery period6 or does fulfillment take longer than the standard disturbance recovery period? Reserve capacity available within the standard disturbance recovery period is said to be “spinning” and reserve capacity with fulfillment times greater than the standard disturbance recovery period is said to be “non-spinning.”
Figure 5.12 illustrates how these principles naturally map onto cloud infrastructure capacity:
- Infrastructure demand is the instantaneous workload on infrastructure resources from applications and infrastructure overheads (e.g., host operating system, hypervisor, management agents).
- Online infrastructure capacity is the maximum infrastructure throughput for all resources that are committed (powered on) and available to serve load.
- Online reserve (analogous to spinning reserve) is the online and idle infrastructure capacity that is available to instantaneously serve workload.
- Offline reserve (analogous to non-spinning reserve) is the increment of additional throughput that is available to serve load when infrastructure equipment not yet powered on is committed and brought online.
- Maximum infrastructure capacity is the maximum throughput available when all deployed infrastructure equipment is fully committed (powered on).
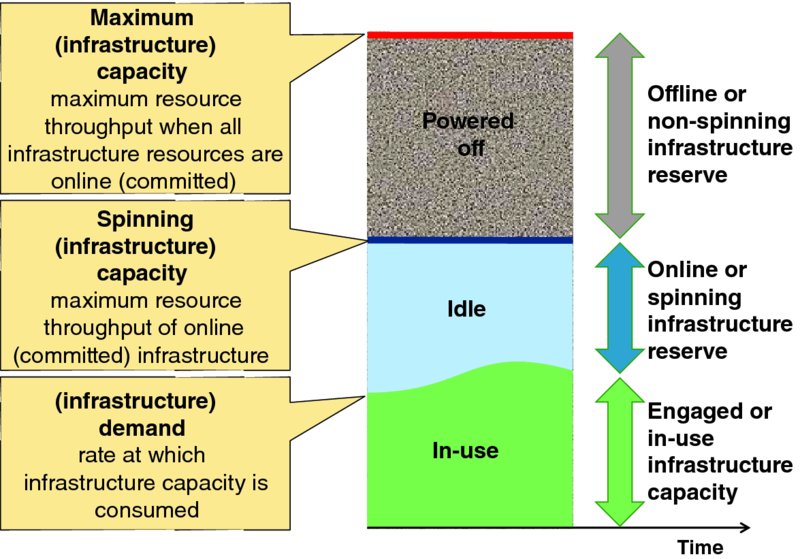
Figure 5.12 Infrastructure Demand, Reserves, and Capacity
5.11 Service Curtailment
The power industry defines curtailment as “a reduction in the scheduled capacity or energy delivery” (NERC, 2015). When customer demand temporarily outstrips the shared infrastructure's ability to deliver the promised throughput to all customers, then one or more customers must have their service curtailed, such as rate limiting their resource throughput. Technical implementation of curtailment can generally span a spectrum from total service curtailment of some active users to partial service curtailment for all active users. The service provider's operational policy determines exactly how that curtailment is implemented. For some industries and certain service infrastructures uniform partial service curtailment for all users might be appropriate, and for others more nuanced curtailment policies based on the grade of service purchased by the customer or other factors might drive actual curtailment actions.
Overselling, overbooking, or oversubscription is the sale of a volatile good or service in excess of actual supply. This is common practice in the travel and lodging business (e.g., overbooking seats on commercial flights or hotel rooms). The ICT industry routinely relies on statistical demand patterns to overbook resource capacity. For example, all N residents in a neighborhood may be offered 50 megabit broadband internet access that is multiplexed onto the internet service provider's access network with maximum engineered throughput of far less than N times 50 megabits. During periods of low neighborhood internet usage the best effort internet access service is able to deliver 50 megabit uploads and downloads. However if aggregate neighborhood demand exceeds the engineered throughput of the shared access infrastructure, then the service provider must curtail some or all subscribers internet throughput; that curtailment appears to subscribers as slower downloads and lower throughput.
A well-known service curtailment model in public cloud computing are spot VM instances offered by Amazon Web Services (AWS) that issues customers “termination notices” 2 minutes before a customer's VM instance is unilaterally terminated by AWS. Curtailment policies for cloud infrastructure resources are considered further in Chapter 7: Lean Demand Management.
5.12 Balance and Grid Operations
Figure 5.13 visualizes the power balance objective that utilities must maintain: at any moment the sum of all power generation must meet all loads, losses, and scheduled net interchange. Committed (a.k.a., online) generating equipment routinely operates between some economic minimum and economic maximum power output; the actual power setting is controlled by:
- Automatic generation control (AGC) mechanisms
- Economic dispatch which explicitly determines optimal power settings
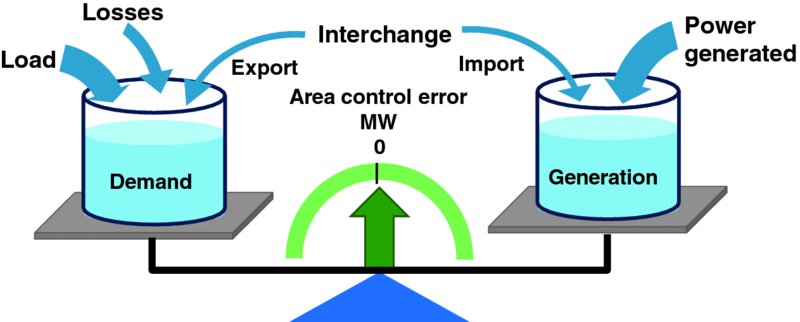
Figure 5.13 Energy Balance
Load-serving entities consider power generation over three time horizons:
- Long term planning of capital intensive power generating stations. Since it often takes years to permit and deploy new power generating capacity, utilities and load-serving entities must forecast peak aggregate demand far into the future and strategically plan how to serve that load.
- Day-ahead unit commitment – according to Sheble and Fahd (1994), “Unit Commitment is the problem of determining the schedule of generating units within a power system subject to device and operating constraints. The decision process selects units to be on or off, the type of fuel, the power generation for each unit, the fuel mixture when applicable, and the reserve margins.” Different power generating technologies and facilities can have very different startup latencies and startup, variable and shutdown costs, so power companies will schedule when each plant should be turned on and off a day-ahead based on forecast demand, cost structures, and other factors. Scheduled maintenance plans are explicitly considered in unit commitment planning. Unit commitment is considered in Section 9.2: Framing the Unit Commitment Problem.
- Five minute load following economic dispatch – most power generating facilities have a fuel input control that can be adjusted to ramp power generation up or down to follow the load. Economic dispatch considers adjusting the fuel controls of the online generating facilities to deliver high quality and reliable electricity at the lowest cost. Real-time evaluation, refinement, and execution of the operations plan to bring generators online and offline is also performed every 5 minutes.
Figure 5.14 visualizes the cloud infrastructure service provider's real-time balance problem analogous to the energy balance of Figure 5.13. Infrastructure service providers must schedule the commitment of their equipment hosting compute, memory, networking, and storage resources and place the virtual resources hosting application loads across those physical resources to balance between wasting resources (e.g., electricity by powering excess capacity) and curtailing virtual resources because insufficient capacity is configured online to serve applications' demand with acceptable service quality. Note that when one provider's resource demand outstrips supply, it may be possible to “burst” or overflow demand to another cloud data center or infrastructure service provider.
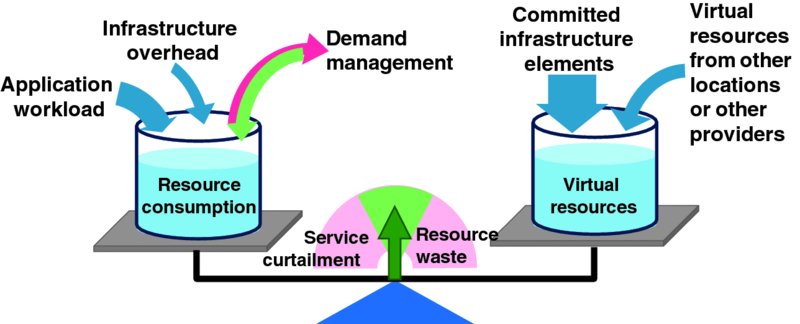
Figure 5.14 Virtual Resource Balance
Infrastructure service providers have three fundamental controls to maintain virtual resource balance:
- Infrastructure commitment – scheduling startup and shutdown of individual pieces of infrastructure equipment brings more or less physical resource capacity into service.
- Virtual resource assignment – intelligently mapping application virtual resource requests onto physical infrastructure hardware elements balances resource supply and demand at the physical level. Hypervisors and infrastructure platform software components typically provide mechanisms to implement resource balancing at the finest timescales.
- Demand management – infrastructure service providers can engage demand management mechanisms to shape demand. Demand management is considered in Chapter 7: Lean Demand Management.
Several planning horizons also apply to infrastructure service provider operations:
- Facility planning – facility plans fundamentally determine the nature and limits of infrastructure equipment that can be housed at the location; for example, is the facility to be a warehouse scale data center housing shipping containers crammed with servers, storage, and Ethernet equipment, or a facility with raised floors and racks of equipment, or something else. Building cloud data centers is a capital intensive activity that inherently takes time. Infrastructure service provider organizations must forecast peak aggregate demand for at least as long as it takes to permit, construct, and commission new or modified data center facilities.
- Infrastructure planning – commercial off-the-shelf (COTS) compute, memory, storage, and networking equipment can often be delivered and installed in existing data centers in days or weeks.
- Infrastructure commitment – as shown in Figure 5.8, each physical infrastructure powered on in the cloud data center has some minimum power consumption (fmin), so infrastructure service providers can save that minimum power consumption – as well as associated cooling costs – for each server they can turn off (decommit). This topic is considered in Chapter 9: Lean Infrastructure Commitment.
- Load following economic dispatch – infrastructure element platform and operating system software automatically assigns physical resource capacity (e.g., CPU cycles) to workloads that have been assigned, so there is no analogy to explicitly adjusting committed physical capacity to follow load. This automatic load following capability of infrastructure elements makes it critical to intelligently place sticky application workloads onto specific infrastructure elements to assure acceptable resource service quality is continuously available to the workload. Since application workloads are sticky, clever placement of workloads onto physical resources facilitates graceful workload migration and timely server decommitment to reduce power consumption and infrastructure service provider OpEx.
The power industry explicitly recognizes the notion of a capacity emergency which can be defined as “a state when a system's or pool's operating capacity plus firm purchases from other systems, to the extent available or limited by transfer capability, is inadequate to meet the total of its demand, firm sales and regulating requirements” (PJM Manual 35). Capacity emergencies apply to cloud infrastructure just as they apply to electric power grids. Capacity emergency events will likely trigger emergency service recovery actions, such as activation of emergency (geographically distributed) reserve capacity (Section 8.6.2).
5.13 Chapter Review
- ✓ The business of electric power generation via thermal plants (i.e., burning fuel to make steam to spin turbines to drive generators) is similar to the cloud infrastructure-as-a-service business (i.e., burning electricity to drive physical compute, storage, and networking equipment to serve virtual resources to cloud service customers). For instance, the electric power industry's goal of economic dispatch – operation of generation facilities to produce energy at the lowest cost to reliably serve consumers, recognizing any operational limits of generation and transmission facilities – is similar to a cloud service provider's goal of lean computing: sustainably achieve the shortest lead time, best quality and value, highest customer delight at the lowest cost.
- ✓ Carefully managing variable input costs are a key to achieving favorable business results for both electric power producers (who burn coal, natural gas, or other fuel to make steam) and cloud infrastructure service providers (who power on sufficient physical equipment to host virtual resources for cloud service customers). Minimizing excess online capacity reduces consumption of inputs which reduces costs.
- ✓ The power industry has sophisticated notions of capacity ratings, locational considerations, service curtailment, and demand management which have applicability to cloud computing.
- ✓ The power industry actively balances electricity generation with demand across time and space via sophisticated unit commitment and economic dispatch systems, processes and policies, including day-ahead commitment plans, and 5 minute load following economic dispatch. Sophisticated cloud service providers might ultimately adopt similar systems, processes, and policies to support lean cloud computing.