A fishbone diagrams, also known as Ishikawa diagrams or cause and effect diagrams, is a tool that helps us to identify and understand possible problems. The following diagram shows the relationship between causes and consequences:
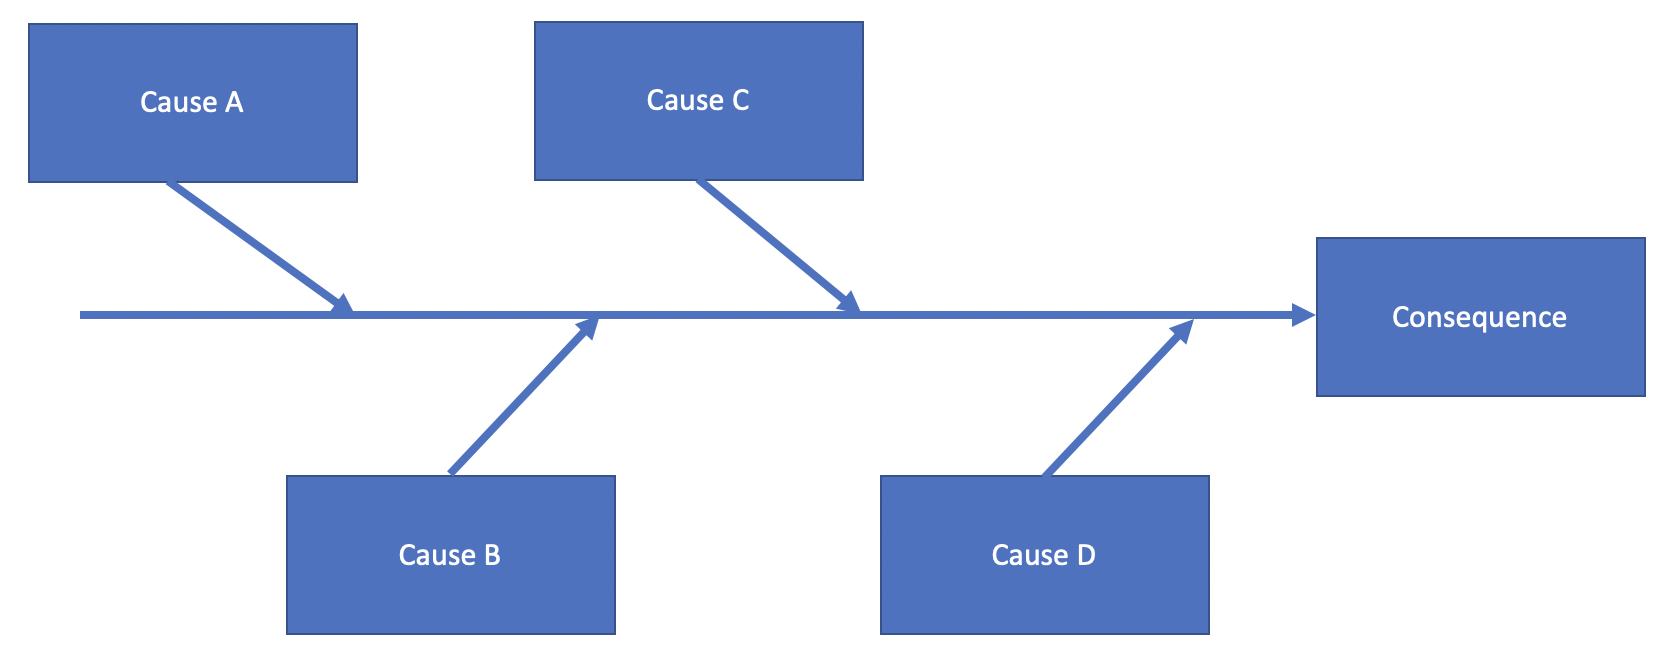
When drawing a cause and effect diagram, the participants construct a graphic representation of the causes, organized to show their relationship with a specific consequence. The image in The purpose of business analysis section of this chapter shows the basic structure of the diagnosing cause and effect. It should be noted that the diagram has the cause and side effects included.
The process of steps for constructing and analyzing a cause and effect diagram are as follows:
- Consequence identification: First, select areas or issues that need to be analyzed. From these, extrapolate consequences, and describe and group them. Use definitions – define the consequences within the team to ensure that they are clear and unambiguous. Results can be positive or negative. Negative results are usually described as problems, and positive results as targets. It is paramount that you establish a positive atmosphere, since it encourages participation and honesty. Whenever possible, it is recommended to express the consequences in a positive way. Do not focus only on negative aspects, since it can steer the team to focus only on justification, and it creates a blame game environment. Another possible approach is to encourage the team to focus on problems; this approach can also lead to a positive outcome. The best approach is to let the team decide on the approach.
- Draw the consequence: Using a tab or larger sheet of paper that is displayed so that each team member can see it well, write a brief description of the consequences or outputs that are the result of the process.
- Identify the cause: Identify the main causes that contribute to the consequences we are analyzing. These are the causes that will become a category in your diagram, on which you can list other causes connected to category. This will enable you to find other causes and highlight the connections between them. You should make an inscription on the diagram for the category makes more sense.
- Identify other important factors: Identify as many of the possible factors and links between them. After identification you can link them to the main branches. Describe them in a detailed manner. If one of the lower-order causes is connected to higher-order causes, specify it as a branch of the higher-order cause.