The Hand You’re Dealt
Thirteen days after he was inaugurated, Barack Obama sat down for an interview with NBC’s Matt Lauer. Lauer asked about the Troubled Assets Relief Program (TARP) that had been passed under President George W. Bush and whether its use of federal money to shore up ailing banks and financial institutions would “fix the economy.” The following exchange ensued:
President Obama: Look, I’m at the start of my administration. One nice thing about—the situation I find myself in is that I will be held accountable. You know, I’ve got four years. And—
Matt Lauer: You’re gonna know quickly how people feel—
. …
President Obama: That’s exactly right. And—and, you know, a year from now I think people—are gonna see that—we’re starting to make some progress. But there’s still gonna be some pain out there. If I don’t have this done in three years, then there’s gonna be a one-term proposition.1
Obama was right: economic conditions in the country would influence how voters viewed his performance and ultimately whether they supported his reelection. This is why we consider the economy fundamental, or foundational, to presidential election outcomes, along with other structural conditions like political partisanship. Why are these things so important? Because, taken together, they correctly predict the winner of most presidential elections in the post–World War II era—even though they are typically measured before the candidate debates, the bulk of television advertising, and much other electioneering. Moreover, many aspects of these fundamentals—such as the state of the economy—will not be affected by the campaign itself. They are beyond the control of the presidential candidates. They are the hand the candidates are dealt.
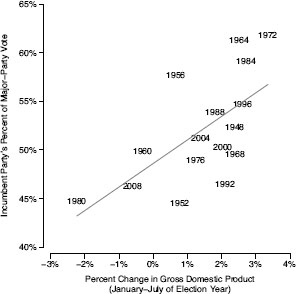
To illustrate the strong relationship between the fundamentals and presidential election outcomes, we compare economic growth in the year of the presidential election—measured as the change in gross domestic product (GDP) from January to July—and the share of the major-party vote for incumbent parties. Figure 2.1 includes the sixteen presidential elections between 1948 and 2008. The pattern is clear: as GDP increases, incumbent parties do better. In fact, it is hard to beat an incumbent party in a growing economy and even harder to beat the actual incumbent himself, which happened only in 1976 and 1992. Over the last sixty years, objective economic conditions have played a significant role in structuring election outcomes.2
A central theme in this book is how much these fundamental factors mattered relative to other factors specific to the presidential campaign, such as the candidates, their messages, television advertisements, debates, gaffes, and so on. Campaign events and strategies certainly can affect who wins or loses a presidential election. But the campaign has to operate in a context that is structured by the fundamentals. This context and the campaign itself deserve attention, and we will give both their due. We begin by highlighting the fundamentals because they help to answer a central question of the election: was Barack Obama the front-runner or the underdog going into 2012?
Figure 2.1.
The relationship between economic growth and presidential election outcomes.
Our answer centers on the structural conditions surrounding his presidency, especially the 2007–9 recession and financial crisis, the slow economic recovery thereafter, and increasing partisan polarization. We demonstrate that, as 2012 got under way, Obama was arguably more popular than expected based on the economic conditions he faced—especially the deep recession and slow recovery. His unexpected popularity buoyed his chances for reelection because presidential elections are, partly if not primarily, referenda on the incumbent.
But why was Obama more popular than the economy seemed to warrant? Part of the reason is partisan polarization: Democrats held him in especially high regard, something that had not always been true for previous Democratic presidents facing economic headwinds. Another factor was Obama the person. Despite being repeatedly characterized as cerebral and chilly, the majority of Americans saw him as warm, likable, and empathetic—attributes that, as we will see, fewer Americans saw embodied in Mitt Romney. A final factor was the willingness of many Americans, and especially political independents, to blame George W. Bush more than Obama for the state of the economy.
As Obama’s first term played out, the question on everyone’s mind was whether the halting economic recovery would ultimately doom the president’s reelection chances. The fundamentals actually made Obama the favorite. Obama would probably not win as easily as he did in 2008, but 2012 was his election to lose.
The Economy Obama Inherited
The economy that Obama inherited in January 2009 was a wreck. The country was already more than a year into a recession. The unemployment rate had climbed from 5% in December 2007, the start of the recession, to 6.1% in September 2008. At that point, the country was rocked by another calamity: a financial crisis that left banks and investment houses reeling. Banks and brokers had invested heavily in securities backed by home mortgages that many homeowners were ultimately unable to pay. This bet on the housing market seemed smart because housing prices had been rising rapidly, leading to a boom in home construction and ownership. But the housing market proved to contain a “bubble” of overinflated assets that, when popped, threatened the livelihoods of Americans and banks alike. Several financial institutions failed, including Lehman Brothers and Washington Mutual. Others teetered as corporate and political leaders tried to arrange buyouts and mergers that would keep them afloat. At the urging of the Bush administration, Congress passed the Emergency Economic Stabilization Act on October 3, 2008. This legislation allocated $700 billion to TARP, which was to purchase assets such as mortgage-backed securities that banks themselves could no longer convince anyone else to buy.
Despite these measures, the economy continued its slide. In October, November, and December, unemployment increased further, while the Dow Jones Industrial Average lost a fifth of its value.3 Just after Obama took office, the Bureau of Economic Analysis (BEA) estimated that the country’s economic output had plummeted at an annual rate of 3.8% in the fourth quarter of 2008. This initial estimate was woefully incorrect: it had actually fallen by 8.9%, the largest drop in over fifty years.4 All told, nearly 1.9 million jobs were lost in the last four months of 2008.5 The recession and financial crisis buoyed Obama’s chances as a presidential candidate, but they would cast a long shadow over his first term as president.
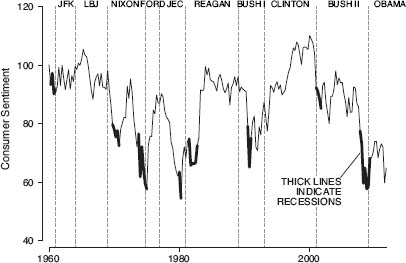
Since the 1950s, the University of Michigan has been measuring Americans’ evaluations of the economy via its Index of Consumer Sentiment. The index is based on five questions about people’s financial circumstances and the country’s business conditions and economy. When Obama took office, the index was near its historical low, as Figure 2.2 demonstrates. In the fourth quarter of 2008, 59% of Americans said that they were worse off financially than they were a year before—the most dissatisfaction ever recorded in response to this question.
Upon his inauguration, Obama was in a position somewhat similar to Ronald Reagan’s in 1980. Both took office when Americans were pessimistic about the economy and dissatisfied with the incumbent president. In a late November 1980 Gallup poll, only 31% of Americans approved of the job Jimmy Carter was doing. At the same point in time in 2008, only 29% approved of George W. Bush. But Obama’s and Reagan’s paths quickly diverged. Early in Reagan’s first term, there was a sharp, painful recession during which unemployment peaked even higher than it did during the 2007–9 recession. But the 1981–82 recession, in part because it had no accompanying financial crisis to compound its effects, was less severe and was followed by a rapid recovery. By November 1984, unemployment had fallen sharply and consumer sentiment had become more optimistic than at any point since the mid-1960s. These trends were what made the autumn months of 1984 “Morning in America,” as Reagan’s now famous campaign advertisement claimed.6 The narrator in that ad went on to say that “more men and women will go to work than ever before in our country’s history.” Obama could not say the same thing going into 2012.
Figure 2.2.
The trend in consumer sentiment, 1960–2011.
Digging out of the Recession
During his first term, Obama’s primary challenge was to combat the recession and financial crisis he inherited. Once in office, Obama and congressional Democrats moved quickly to pass an economic stimulus package. Some of Obama’s economic advisors believed the recession demanded an extraordinary intervention. In a December 2008 memo, Christina Romer, the economist who would become chair of the Council of Economic Advisors, recommended a stimulus of $1.7–1.8 trillion. (By comparison, the stimulus package championed unsuccessfully by Bill Clinton in 1993 was only $19.5 billion, which would have been equal to $29 billion in 2009.)7 But Larry Summers, the director of the White House National Economic Council, believed that Romer’s figure was not politically feasible, even within the administration. Budget Director Peter Orszag believed that a stimulus that large would increase the deficit so much that business confidence would ebb.8 The plan Obama ultimately put forward totaled $775 billion, divided among tax cuts, direct payments to state governments, and funding for infrastructure projects. It was crafted to appeal to both Democrats, who would support the outlays for state governments and for infrastructure, and Republicans and conservative Democrats, who would be attracted by tax cuts.
Instead, the stimulus met resistance. This was the first sign of many that Obama’s campaign goal of bipartisan cooperation would rarely be realized. After the Senate passed an $827 billion package, House Minority Leader John Boehner said, “Right now, given the concerns that we have over the size of this package and all of the spending in this package, we don’t think it’s going to work.” The initial version that the House passed (an $819 billion package) earned no Republican support. On Twitter, Representative Jeff Flake (R-AZ) called the bill a “Ford Pinto.”9 The stimulus that was ultimately signed into law totaled $787 billion and attracted only three Republican votes, from Senators Susan Collins, Olympia Snowe, and Arlen Specter. The Obama team counted even this as a victory. When he signed the bill, Obama declared, “We have begun the essential work of keeping the American dream alive in our time.” And the stimulus apparently helped, increasing economic output and lowering unemployment in each quarter of 2009, 2010, and 2011, according to the Congressional Budget Office (CBO).10
But a dramatic economic recovery—like the one that occurred in Reagan’s first term—did not occur. Instead, during the first three years of Obama’s term, the economy only limped along. Although the financial system was stabilized and the recession was technically over, economic growth was slow. This was in keeping with the general pattern after financial crises. The economists Carmen Reinhart and Kenneth Rogoff have found that after post–World War II financial crises, it has taken four to five years for economic output to return to its previous level.11 Protracted high unemployment has also been common after financial crises. After Obama’s inauguration the unemployment rate was above 8% until well into 2012. Moreover, the unemployed tended to be out of work for long periods—an average of forty weeks by the end of 2011. Before the 2007–9 recession, the highest average had been twenty weeks.
And so Americans remained pessimistic about the economy. In fact, they had never been as pessimistic. Consumer sentiment was lower in the first three years of Obama’s term than during every other presidency beginning with Kennedy’s, including Carter’s. This pessimism was also remarkably stable. Most presidents experience big ups and downs in consumer sentiment, corresponding to economic booms and contractions (see Figure 2.2). Under Obama, consumer sentiment exhibited few notable trends. It became more positive in the first few quarters of 2009 but more negative in the summer of 2011 when the disagreement between Obama and congressional Republicans over whether to lift the debt ceiling sent financial markets into paroxysms and made Americans newly anxious. The range in consumer sentiment was smaller under Obama than it was under nearly every other president. Ordinarily, this lack of volatility might have been comforting, except that optimism was so scarce.
The pessimistic public was also skeptical of, if not downright opposed to, the Obama administration’s efforts to revitalize the economy. In a February 2009 Pew Research Center poll, only half thought that the stimulus was a good idea. A little over a year later, in an April 2010 Pew poll, 62% said the stimulus had not “helped prevent a more serious crisis.” The public tended to oppose other efforts to stimulate the economy, many of which were deemed “bailouts” for presumably undeserving recipients. The Obama administration’s efforts to help General Motors and Chrysler were not popular: only 37% said these efforts were “mostly good” for the economy in an October 2009 poll. The TARP program—a bailout for Wall Street banks, in the minds of many—was also unpopular. In the April 2010 Pew poll, only 42% agreed that “government loans to banks and financial institutions helped prevent a more severe crisis.” The unpopularity of TARP should not have been a major political problem for Obama. After all, it was signed into law by President George W. Bush. But only about one-third of the public knew this. Almost half believed it was passed under Obama and the rest did not know. By 2012, opinions about the loans to auto companies had improved, but attitudes toward TARP and the stimulus had not.12
The Obama administration did not receive much more support for its other domestic policy accomplishments, even though the first two years of Obama’s term were remarkably productive. Not only were the stimulus and the support for ailing auto companies enacted but so were reform to student loans, new rules on financial institutions, and, most important, a landmark health care reform bill, the Patient Protection and Affordable Care Act (ACA). Health care reform had been a longstanding priority of the Democratic Party, and in June 2012 the major parts of the ACA were upheld by a 5–4 vote in the Supreme Court. Although it did not go far enough for some, the ACA nevertheless made fundamental changes to the health care system. Among other things, it prevented insurance companies from denying coverage to people with preexisting medical conditions. It also would eventually establish a financial penalty if people did not purchase health insurance. This “individual mandate” was intended to serve two purposes. First, it would help ensure the viability of insurance markets by preventing healthy people from waiting until they were sick to purchase insurance. Second, it would help achieve the goal of universal, or nearly universal, health coverage. To help ensure that lower-income Americans would be able to afford coverage, the ACA expanded Medicaid, the federal health insurance program for the poor.
But opinion about health care reform was similar to opinion about the stimulus. The public was again roughly evenly divided and polarized along partisan lines. About a year after the ACA’s passage, a March 2011 Kaiser Family Foundation poll found that 42% of Americans supported the law but 46% opposed it.13 The majority of Democrats supported it, but very few Republicans did. At the same time, the public also did not know a great deal about the legislation. For example, an August 2011 Kaiser Family Foundation poll found that only 58% knew that the ACA provided subsidies to help low-income Americans purchase health insurance—down from 75% in April 2010, just after the bill passed.14
Opposition to the Obama administration’s legislative priorities—particularly the stimulus, “bailouts,” and the ACA—was crystallized most visibly in the Tea Party. The Tea Party was not a formal political party but a loosely associated set of groups and voters. People who affiliated with the Tea Party were not a monolith in terms of their political attitudes, but they did share a hostility to what they perceived as an unprecedented expansion of government power under Obama. This was why they aligned themselves with the colonists who resisted the rule of King George III at the famous Boston Tea Party.
The 2010 Elections: The Republicans Resurgent
Opposition to the stimulus, ACA, and other administration efforts made these accomplishments political liabilities for the Obama administration. Nowhere was this more evident than in the 2010 midterm elections. Democratic congressional candidates were already facing an uphill battle. Thanks to their gains in the 2006 and 2008 midterms, they had to defend House seats in many swing districts and in some districts that leaned Republican. The weak economy and a relatively unpopular president—Obama was polling in the mid-40s in the fall of 2010—made Republican gains even more likely. But their 63-seat gain, the largest shift since 1948, exceeded the predictions of most analysts.
Why did the Democrats lose so badly? Tea Party activism appeared influential: Republican House candidates did better in districts where there were more Tea Party activists.15 Support for health care reform seemed to be another reason. In competitive districts, Democratic incumbents who supported the ACA lost about 6 points of vote share relative to Democratic incumbents who opposed the ACA. According to a team of political scientists, this may have cost the Democrats as many as 25 seats.16 Overall, the 2010 election was not only a referendum on the economy, it was to some extent a repudiation of Obama’s legislative accomplishments.17
With the House of Representatives in Republican hands and the Democratic majority in the Senate well below the 60 votes needed to overcome Republican filibusters, the Obama administration was in a difficult position. It had initially assumed that Congress might pass another stimulus bill if a robust economic recovery did not happen. This was impossible after the 2010 elections. Even measures that had been routine in earlier times, such as a vote to increase the debt ceiling so that the government could continue to borrow and spend, provoked considerable debate, in part because newly elected Republican members, many of them affiliated with the Tea Party, favored cuts to government spending. Smaller measures that could have stimulated the economy, such as an extension of the payroll tax cut, necessitated protracted and sometimes acrimonious negotiations. The GOP’s resistance was, from an electoral perspective, quite logical. Obama was not the only one who knew that his reelection hinged on economic growth and, as Senate Minority Leader Mitch McConnell said in October 2010, “The single most important thing we want to achieve is for President Obama to be a one-term president.”18 Republicans had little reason to vote for new and ambitious initiatives to stimulate the economy. Obama was thus left with relatively few policy levers that would allow him to fulfill the goal he described to Matt Lauer and “have this done in three years.” The GOP wanted him out in four.
At the end of 2011, this is where Obama stood. He was presiding over an economy that was growing, but not fast enough to create very many jobs. He was a disappointment to many Democratic leaders, activists, and other groups on the left. Democratic members of Congress felt ignored or even snubbed. Some Democrats lamented the compromises that were part of the administration’s achievements, such as the failure of the ACA to include a government insurance program, the “public option.” Others lamented slow progress on gay marriage, mortgage relief, and immigration reform. Still others thought Obama had thrown in his lot too much with banks and financial institutions rather than ordinary Americans. This latter sentiment was articulated most visibly by the Occupy Wall Street (OWS) movement in the fall of 2011. Its goal was to draw attention to economic inequality and argue that large corporations had too much influence in American politics. OWS activists and sympathizers held sit-ins and rallies first in New York and then in many cities in the United States and abroad. Finally, as ever, Obama continued to face staunch opposition from Republicans on Capitol Hill.
This potted history implies that Obama’s reelection effort was in trouble—at least based on “the fundamentals” alone. Writing in late December 2011, Salon’s Steve Kornacki noted that economic forecasts provided a “sobering reality check” for the White House.19 But Obama’s precarious position belied this striking fact: he was relatively popular—and ironically he owed this, at least in part, to something he campaigned against in 2008: partisan polarization.
The Unexpectedly Popular President
Presidential popularity hinges on several factors. One is the state of the economy. Another is salient events like scandals and wars. There is also, for many presidents, an inexorable decline in popularity. The longer a president is in office, the less popular he is.
Obama’s first three years saw no big shifts in the economy, as we have noted, and relatively few dramatic events, such as big scandals. Accordingly, Obama’s approval rating—the percentage of people who approved of the job he was doing—had few sharp dips or jumps, as Figure 2.3 demonstrates. The killing of Osama bin Laden produced a modest 5-point bump in May 2011. At two other points there were somewhat steeper decreases in approval: from early May through August 2009, and in June and July 2011. Both appeared connected to economic uncertainty, including increases in unemployment in 2009 and the difficult debt ceiling negotiations in mid-2011. However, it is not easy to isolate the causes of these trends, and they are arguably subordinate to the larger pattern: Obama’s approval rating was remarkably stable during this period. Most other presidents have experienced greater peaks and valleys in their approval ratings in their first terms.20 Obama’s approval rating looked much like one might expect given the chronic economic challenges he faced: initial popularity in the “honeymoon” after he was inaugurated, which was then gradually eroded by Americans’ persistent pessimism about the economy and the overall direction of the country.

Figure 2.3.
The trend in approval of Obama, 2009–11.
The points represent individual polls, which are located based on the midpoint of the dates the poll was in the field. The line is a smoothed average.
But this pessimism never eroded Obama’s approval as much as it arguably might have or perhaps should have. How can we know? One way is to predict what Obama’s approval would have been based on how the economy and other factors have historically affected approval ratings and then determine whether Obama’s actual approval matched, exceeded, or fell short of the prediction. To do so, we used sixty years of quarterly data on presidential approval, which contain polls from 1948 to 2008, and constructed a statistical model of approval that included these factors: three economic indicators (the unemployment rate, the change in GDP since the previous quarter, and the change in inflation since the previous quarter); the presence of events such as war that might push approval up or down; the presence of divided government; and the length of time in office. (The appendix to this chapter describes the model in greater detail.) We used this model to predict Obama’s approval in 2009–11. The question we can then answer is this: Was Obama more or less popular during his first three years in office than we would expect given how the economy and other circumstances have previously affected presidential approval?
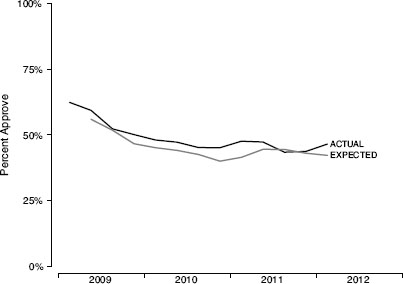
Figure 2.4 depicts the difference between expected and actual approval of Obama. On average, Obama was about 3 points more popular than expected from 2009 through the first quarter of 2012. The drop in Obama’s approval rating in the third quarter of 2011 brought it more in line with expectations, but in the first quarter of 2012 it was once again 4 points above expectations.21 This feat is something that few presidents have accomplished. Only one president, Kennedy, consistently “beat” the prediction in his first term to an extent greater than Obama did.22
Obama’s higher-than-expected approval rating might have been especially surprising for two reasons. Indeed, even if his approval had been equivalent to expectations, it might still have been surprising. For one, the economy was not in a garden-variety recession but a deep and prolonged slump. The economic measures we drew on captured some of its characteristics—such as high unemployment—but not all, such as the rise in long-term employment. One could easily expect that our model would have overestimated Obama’s support because it did not take into account what made this recession and recovery unique—or, to use Reinhart and Rogoff’s title, why “this time is different.”
Figure 2.4.
Actual vs. expected presidential approval for Obama.
The figure presents actual quarterly approval alongside the expected approval that was predicted from a statistical model.
Second, Obama’s race may also depress his approval rating. Studies of the 2008 election have demonstrated that Americans’ views of blacks were associated with their views of Obama, and racial prejudice may have cost Obama about 3 points of the vote.23 Our model did not account for race—indeed the predictions were based on results from white presidents only. We might then expect that the model would have overestimated Obama’s popularity by failing to account for the “penalty” of his race. Some evidence confirms this expectation. Using an April 2012 YouGov poll, we predicted Obama’s approval rating using a standard measure of attitudes toward blacks, called “racial resentment” by scholars, along with several other factors, including respondents’ identification with a political party or as independent and their self-reported ideology on the liberal-conservative scale. Unsurprisingly, those who expressed more resentment of blacks were more likely to disapprove of Obama. To gauge the overall effect of attitudes toward blacks, we assumed a world in which every person had a neutral opinion of blacks—that is, we shifted those with favorable or unfavorable views of blacks to neutrality—and then predicted a “new” approval rating for Obama based on the same set of factors. In this hypothetical scenario, Obama’s approval would have increased by almost 4 points overall. (Further details are in the appendix to this chapter.)
We do not want to overstate the results of this simulation, which isolated arguably implausible shifts in attitudes toward blacks and assumed nothing else would have changed. As such, the 4-point estimate is not a sacrosanct number. However, this evidence and the evidence from the 2008 election suggest that negative attitudes toward blacks depress Obama’s approval rating more than positive attitudes toward blacks increase it. This makes it even more surprising that Obama outperformed expectations.
The Paradox of Obama’s Popularity
Why, then, might Obama’s approval have been higher than expected? One culprit was partisan polarization. During the past forty years, the coalitions of the two parties have changed, rendering them more internally homogeneous in terms of ideology and more ideologically distinct from each other.24 This is certainly true among politicians. In place of conservative Southern Democrats, there are now many more Republicans. And moderate and liberal Republicans—in the Northeast, for example—have become similarly endangered. As a consequence, Republicans and Democrats in the public, although not as polarized as politicians in Washington, are nevertheless more ideologically homogeneous and more polarized on some issues.25
In particular, over the past thirty years, and especially during the Clinton and George W. Bush administrations, Democrats and Republicans became far more polarized in their views of the president.26 This has been true for Obama as well. In the first year of his presidency, an average of 88% of Democrats approved of him but only 23% of Republicans did.27 This 65-point gap was the largest of any president during his first year in office—perhaps no surprise given the divisions between Democratic and Republican politicians. Evaluations of Obama became only more polarized thereafter. There was a stark disjuncture between how Obama campaigned in 2008—to lead “America” rather than “red America” or “blue America”—and how powerfully the larger forces of partisan polarization shaped the public’s views of him. Obama was no more a “uniter” than George W. Bush had been.
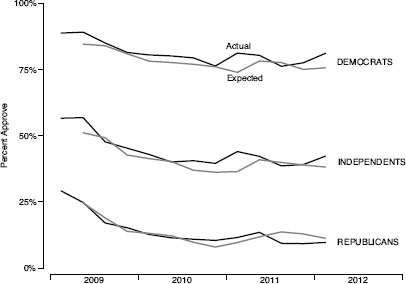
But here was the irony: the very forces of partisan polarization that Obama deplored may have buoyed his approval rating. This is most clear if we compare Obama’s actual approval rating among Democrats, independents, and Republicans to predictions of what his approval rating would have been in each group based on the same data and factors we examined in the previous section. As Figure 2.5 illustrates, Obama’s approval rating tended to exceed expectations among Democrats and independents but not among Republicans. In the first quarter of 2012, Obama’s approval was 5.5 points higher than expected among Democrats, 4 points higher than expected among independents, but 1.5 points lower than expected among Republicans. This illustrates just how much more polarized are opinions of the president now than they were in the past.
Figure 2.5.
Actual vs. expected presidential approval for Obama among Democrats, independents, and Republicans.
Although commentators have often been quick to compare Obama to Carter, one key difference between them is how much more Democrats have supported Obama than they did Carter.28 When Carter’s approval was at its nadir in the fall of 1979, barely one-third of Democrats approved of the job he was doing, compared to about 20% of Republicans. Even Bill Clinton, now seemingly beloved by Democrats, was less popular among Democrats—63% of whom approved of him in June 1993—than was Obama in his first term. In fact, averaging over each Democratic president’s first three years in office, Obama was more popular with Democratic voters than every one of them except John F. Kennedy—and even Kennedy’s average approval among Democrats was only 4 points higher than Obama’s. Obama was actually as popular among Democrats during these years as was Reagan among Republicans in 1981–83. These facts fly in the face of frequent fears (or hopes) during Obama’s first term that he was “losing the base” or otherwise alienating key Democratic constituencies. For example, a front-page New York Times story on September 17, 2011, was titled “In Poll, Support for Obama Slips among Base.” Although Obama may have lost support among some Democratic or liberal activists who disagreed with him on various issues, he remained popular among Democrats in the public. And equally important, given the approaching election, the same pattern existed among independents.
The Blame Game
But party polarization and Democratic loyalty could not explain why independents supported Obama more than expected. This leads us to a second factor: the willingness of many Americans to blame the country’s economic problems on Obama’s predecessor, George W. Bush, during whose tenure the recession and financial crisis began.
There is historical precedent for incumbent presidents’ dodging some of the blame.29 In fact, at least two other presidents, Reagan and George W. Bush, benefited from this. In Reagan’s case, he inherited a weak economy, one that was in a recession for the first half of 1980. Soon after he took office, in July 1981, the country entered another, more painful seventeen-month recession that was unmatched until 2007. Thus there was perhaps reason for Americans to blame either Carter or Reagan or both. In an October 1982 Washington Post/ABC News poll, roughly equal numbers did: 47% blamed Carter “a great deal” or “a fair amount” for the country’s economic conditions, and 44% blamed Reagan. But because Democrats and Republicans tend to view questions of blame through a partisan lens, it is more instructive to examine the views of independents with no leaning toward either party. Among them, Reagan had the advantage: 45% blamed Carter, but only 38% blamed Reagan.
The same was true for Bush. From March through November 2001, the country also experienced a recession. Because the recession came so early in Bush’s first term, and because the economic slowdown had begun late in Clinton’s second term, there was again debate about whom to blame. Two different polls—by the Washington Post in February 2002 and by Princeton Survey Research Associates (PSRA) in May 2003—showed that, in fact, Clinton was blamed more than Bush. In the Post poll, 78% of independents thought that the economy was “not so good” or “poor.” Among this subset of independents with a negative view of the economy, 69% believed Clinton deserved “a great deal” or “a fair amount” of blame, but only 48% believed this of Bush. Similarly, among the minority who thought the economy was doing well, more credited Bush than Clinton. In the PSRA poll, 30% of independents thought Clinton deserved “most” or “a lot” of blame while 22% thought Bush did.
But for Reagan and Bush, their ability to escape some of the blame for weak economies was not really necessary for them to win reelection. The economy was growing healthily in the first two quarters of 1984 and 2004, as Figure 2.1 demonstrates. For Obama, such a growth rate was not at all assured, and so escaping some of the blame could provide him a crucial edge amid a slowly growing economy.
Obama’s ability to escape some of the blame was first evident in a series of Gallup polls between July 2009 and September 2011 and a January 2012 Washington Post poll.30 We confirmed this finding in an April 2012 YouGov poll. When asked how much blame Obama and Bush each deserved for “the poor economic conditions of the past few years,” 56% of respondents gave Bush a great deal or a lot of the blame, while only 41% gave Obama that much blame. A similar gap existed among independents with no leaning toward a political party: 58% blamed Bush, but only 42% blamed Obama. Altogether, 47% of respondents blamed Bush more than Obama, 21% blamed them equally, and 32% blamed Obama more than Bush.
At that point, Obama was winning the blame game. Did this explain why his approval rating was higher than expected? Here is one way to address this question. We calculated the difference between how much blame voters assigned to Obama and Bush, which served as a measure of Obama’s blame advantage or disadvantage relative to Bush. Using that measure—as well as other relevant factors, including ideology, sex, race, and income—we predicted how much political independents approved of Obama. We then “erased” any blame advantage for either Bush or Obama, which assumed a world in which every independent blamed Bush and Obama equally. What would have happened in this world, holding everything else the same? Obama’s job approval would have declined by about 9 points.
To be sure, this exercise is purely hypothetical. We cannot conclude from it that voters’ opinions about blame were the definitive reason why Obama seemed to be more popular than he should have been. Life is not a laboratory, and we cannot replay Obama’s first three years and have voters blame him less or more than they did in reality. Nevertheless, Obama’s lead in the blame game may have helped him retain popularity—especially among independents—even as the country failed to spring back strongly from the recession he inherited.
A final reason why Obama may have been relatively popular at this point in his term was his personal likability. That so many voters liked Obama might have seemed surprising, given how often political observers disagreed. New York Times columnist Maureen Dowd described Obama thusly: “No Drama Obama is reticent about displays of emotion. The Spock in him needs to exert mental and emotional control. That is why he stubbornly insists on staying aloof and setting his own deliberate pace for responding—whether it’s in a debate or after a debacle.”31 Similar ideas had been circulating for a while, such as when commentators homed in on Obama’s alleged inability to “connect” with voters.32 Atlantic Monthly writer James Fallows followed up on this in a long article on Obama’s first term. He quoted Walter Mondale calling Obama “aloof” and “someone with long experience in the executive branch” saying that “President Obama’s extra-high intellectual capacity is simply not matched by his emotional capacity.”33
Perhaps such impressions are accurate, at least if one has firsthand contact with the president. But during Obama’s first term the vast majority of Americans appeared to disagree. Polls showed that Obama was perceived as warm and empathetic—impressions that changed very little even as his approval rating declined. In a January 2012 Pew poll, 71% said Obama was “warm and friendly” rather than “cold and aloof.” He was viewed favorably on related dimensions as well, such as “good communicator” and “cares about people like me.” That such large percentages of Americans felt this way suggested that Obama’s likability stemmed not only from Democrats’ party loyalty but from positive impressions among independents and even some Republicans. For example, over half of Republicans and two-thirds of independents said that Obama was warm and friendly. Although pundits often blamed Obama’s struggles on his personality, most Americans did not see him as cold or aloof—and this feeling may have buoyed their evaluation of his job performance as well.
Obama at the Beginning of the Election Year
Where did the twists and turns of Obama’s first three years leave him as he geared up for a second presidential campaign? Was he the presumptive front-runner or an underdog? An initial answer to these questions can be derived from the fundamental factors that help structure presidential election outcomes. The historical relationship between these fundamentals and presidential elections, combined with plausible estimates of these fundamentals in 2012, provided a sense of Obama’s chances of winning. Many of those indicators suggested he was indeed the front-runner.
Forecasting Models
Forecasting presidential elections has become something of a cottage industry among a handful of academics, mostly political scientists and a few economists. A typical forecasting model relies on a few factors, maybe three or four, that predate most of the general election campaign—factors such as presidential approval ratings or the rate of economic growth early in the election year. Ideally, a forecasting model does three things: it draws from plausible theories about how voters make decisions in elections; it is parsimonious (that is, it attempts to predict elections with a few big factors rather than lots of factors that each explain only the idiosyncrasies of one election); and it is accurate.
Because forecasting models do not always live up to these ideals, they have attracted their fair share of criticism. Some critics are incredulous that a model would rely on so few factors, none of which may measure campaign activities such as advertising. Is the implication, critics ask, that the campaign does not matter? Others question whether any forecasting model can generate a reliable prediction because these models are typically based on elections since 1948 or 1952—at most fifteen or sixteen including the 2008 election. Still others point out instances where the models were inaccurate—or even predicted the wrong winner in Dewey-defeats-Truman fashion. If these models are sometimes wrong, critics say, how valuable can they really be?
We think that forecasting models can tell us something useful, provided that they are constructed and interpreted in the right way, because they are based on a defensible theory about how a crucial subset of voters makes up its mind: by evaluating the “performance” of the incumbent president and his party. This is why forecasting models typically include factors like presidential approval, which directly measures views of the incumbent, and economic growth, for which the incumbent is often credited in good times or blamed in bad times (fairly or unfairly). These models also provide a baseline against which to measure how well the incumbent is doing—a baseline that is more than just an impressionistic rendering. For example, in August 2008, New York Times columnist David Brooks wondered why Obama was not already winning in a landslide and then opined that voters were “slow to trust” Obama because he was a “sojourner” whose “journey” made it hard to understand “the roots and values in which he is ineluctably embedded.”* But at that point in time, most models did not predict a landslide. On average, they predicted that Obama would win with about 52% of the major-party vote—hardly a landslide and, incidentally, about what he did win.†
Finally, the forecasting models, taken together, typically correctly predict the winner, even if they do not always predict the exact margin of victory very well. Of the predictions made by various forecasters for the 1992–2008 elections, 85% of them correctly identified the winner—even though most forecasts were made two months or more before the election and even though few of these forecasts incorporated polls from the campaign itself or even took account of who the actual candidates were.‡ Thinking about the models this way reflects a “forest, not the trees” approach. Any one model will always make errors. And although some forecasters are historically more accurate than others, no one has a special forecasting sauce that makes his or her model the best. So even if the forecasting models predict a range of possible outcomes—from a narrow victory to a landslide—the direction that these forecasts point almost always identifies the winner. Looked at this way, the models will rarely lead us wildly astray.
* David Brooks, “Where’s the Landslide?” New York Times, August 5, 2008, http://www.nytimes.com/2008/08/05/opinion/05brooks.html?_r=1.
† Nate Silver tabulated sixteen different predictions from forecasting models in 2008. On average, McCain was predicted to win 48.3% of the major-party vote in these models. Silver, “Models Based on ‘Fundamentals’ Have Failed at Predicting Presidential Elections,” FiveThirtyEight/New York Times, March 26, 2012, http://fivethirtyeight.blogs.nytimes.com/2012/03/26/models-based-on-fundamentals-have-failed-at-predicting-presidential-elections/#more-29633.
‡ John Sides, “In Defense of Presidential Forecasting Models,” FiveThirtyEight/New York Times, March 29, 2012, http://fivethirtyeight.blogs.nytimes.com/2012/03/29/in-defense-of-presidential-forecasting-models/.
Our forecasting model examined sixteen different presidential elections (1948–2008) and took account of three factors: the president’s approval rating, whether his party had been in power for only one term or more than one term, and the health of the economy.34 The approval rating was from June of the election year. Of course, the trend in approval after June can be a good indicator of what will happen in November. Relying on the incumbent’s approval rating on the eve of the election would undoubtedly be a very good predictor, but it would be hard to call that a forecast. Similarly, the length of time the incumbent party has occupied the White House reflects an important historical pattern: the incumbent party’s candidate has been more likely to lose when the party has held the White House for longer. After a while it seems as if voters simply think it is “time for a change.”35
To capture the effect of economic growth on presidential election outcomes, the key is to measure change in roughly the year before the election. Change in the economy has mattered more than the absolute level of any economic indicator. This is why, for example, Reagan could declare that it was “Morning in America” during the 1984 campaign even though the unemployment rate that fall was above 7%. More important was how much unemployment had declined in the period leading up to that election. The reason to focus on the year before the election is that voters have historically been somewhat myopic.36 Voters have tended to “see” recent economic trends more clearly than those of even a year or two earlier. Thus the economic trend over a president’s entire term has been less consequential than what has happened in the year before the election. This was why Reagan could be reelected so easily after a painful recession earlier in his first term.
We incorporated three different economic indicators, measuring changes in each between the start of the first quarter of the election year and the end of the second quarter (January to July). This period captured the recent economic changes that would be at least somewhat visible to voters via news coverage and the like. The first indicator was changes in GDP, an omnibus measure of the country’s economic output. The second was changes in the unemployment rate, which typically features in news coverage and certainly did in 2012. The third was changes in incomes, as measured by real disposable income per capita (RDI). These economic indicators have tended to trend together, but when they have not, it has been important. For example, in 2000 economic growth as measured by GDP exceeded growth as measured by RDI. This may have helped explain why the incumbent party’s candidate, Al Gore, only barely won the popular vote—and, of course, lost the Electoral College.37 In Obama’s case, the same was true: modest economic growth as measured by GDP was accompanied by a slower decline in the unemployment rate and little change in disposable income. This is why our model included all three factors.38
At the end of 2011, Obama’s approval rating and the rate of economic growth suggested a narrow reelection assuming that his approval rating as of December 2011 would not change and that economic growth in the first half of 2012 would be equal to growth in the first half of 2011. His expected vote share was just under 52%.39 This number was lower than a similar prediction for seven of the other incumbent presidents at this point in their first term—including Eisenhower (1955), Johnson (1963), Nixon (1971), Carter (1979), Reagan (1983), Clinton (1995), and George W. Bush (2003). According to the model, only George H. W. Bush was expected to have a lower vote share, based on conditions in 1991 (when the country was still recovering from a recession). Historically speaking, Obama’s chances were on the low side, although he was still favored.
But more important for Obama was whether and how economic conditions and approval would change in 2012—and what a forecast using 2012 data revealed about his chances. The accuracy of the forecasting models for elections from 1948 to 2008 improves greatly when election-year conditions are used rather than conditions from the previous year.40
To produce a forecast using election-year data, we needed to make some assumptions about how the economy would change in the first half of 2012. Assume for the moment that these were to be the election-year economic conditions: growth in GDP of 1.2% between January and July, a decline in the unemployment rate of 0.1 points in that period, and an increase in disposable income of 0.3%.41 These numbers were roughly in line with economic conditions in 2012: modest GDP growth, a small decrease in unemployment, and a small increase in disposable income. (In chapter 7, we will revisit this forecast in light of actual economic conditions.) Given these numbers and an approval rating of 46%, Obama was expected to do better than we predicted using the actual 2011 numbers, garnering 52.9% of the major-party vote. Part of the reason this forecast favored Obama was his better-than-expected approval rating. We showed in the previous section that, as of the first quarter of 2012, he was about 4 points more popular than expected based on the economy and other factors. Given our forecasting model, this increased popularity translated into about an additional point of vote share.
To many observers writing in late 2011, the idea that Obama would win 52.9% of the major-party vote seemed unlikely. Regardless of what the models predicted, people thought 2012 would be different. Perhaps the extraordinary pain brought by the 2007–9 recession meant that modest improvement in the economy would not be enough. Or perhaps Obama’s better-than-expected popularity would not last. At some point, wouldn’t the economy finally “catch up” to him, especially when he had an opponent pointing to the unemployment rate every day and, perhaps eventually, convincing voters to blame Obama for how bad things were? Or perhaps conditions in 2012 would take a turn for the worse—a prospect that seemed entirely possible at the time given ongoing economic turbulence in Europe. All of these possibilities were real. Our forecast simply showed what history could tell us: presidents in their first term who were presiding over even modest improvement in the economy have been likely to win.
Sometimes even modest faith in forecasting models is deemed “economic determinism” by commentators who presume that these models, and even the whole of political science research on elections, imply that elections are only about the economy and campaigns themselves are irrelevant. That is not our view, nor in fact is it most political scientists’ view. What made the 2012 election more dramatic was uncertainty about whether and how the economy would change, which in turn made Obama’s reelection uncertain. Thus, far from suggesting that the campaign would not matter, the fundamentals in 2012 predicted a close enough election that the campaign could certainly matter and possibly consign Obama to that one-term proposition.