Since knowing the inputs and outputs cannot, with any surety, provide you with a true picture of the internal construction of the application you want to reverse engineer, let's look at some helpful utilities from Kali Linux that might make it easier. We will look at three debuggers, one disassembly tool, and one miscellaneous reverse-engineering tool.
We will show usage and output from two Linux-based debuggers, Valgrind and EDB-Debugger, and then the similar output from a Windows-only debugger, OllyDbg.
The disassembler is JAD, a Java decompiler.
What is debugging? The honor of coining the term is often erroneously attributed to Admiral Grace Hopper, on the occasion of her team members finding a physical (but dead) moth stuck in a relay inside a Mark II computer at Harvard University. The term may actually come from Thomas Edison as he mentioned and defined the term as "...little faults and difficulties..." In software development, a bug is usually a logic error, and not a typographical error in the code. Typos usually stop the code from compiling at all, so they do not get out of the developer's' lab. Logic errors do not stop the program from compiling, but they may cause a failure in the output or unexpected behavior when the program is initiated. Another word often used synonymously to bug is defect. Technical debt in a project is the number of defects unfixed in a project. Different project managers have different levels of tolerance for unfixed bugs. Many malware packages have several show-stopping bugs in their released versions, but some of the more sophisticated recent malware packages appear to be very low in technical debt.
Debuggers allow you to watch the behavior of an application in a step-wise manner. You can see what gets put into memory, what system calls are made and how the application pulls and releases memory. The main reason we use debuggers is to check the behavior of programs to which we have access to the source code. The reason for this is the programs we are most likely to debug are code made in our own workshops. This does not quite constitute a code security audit, but it can help a lot to find where a program is leaking memory, and how well it cleans up its used memory. Many programs display status reports on the command line, if you start them that way, which are internal debugging information. This could be cleaned up after release of the application, but in most use cases, the end user never sees any of it.
Programs generally reserve memory from the total RAM available. One program we have found useful for debugging on the command line is Valgrind, which is not in the default Kali install. We add it when we find we need to do preliminary debugging. For instance, at one time a version of OpenOffice.org, the free open-source office suite. had a bug in Linux that was allowing the install, but failed to run the program. It just seized up at the display of the initial splash screen. Running the following command showed that it was looking for a file that did not exist. Rather than just sending a bug report, and hoping for a solution to be added as a patch to the source code, we just added the missing file as a blank text file. This allowed OpenOffice.org to start. The OpenOffice.org developers added a patch later that removed the bug, but we didn't have to wait for it.
As an example of Valgrind, here is the command-line code to run a test on gedit, a text editor:
valgrind -v --log-file="gedit-test.txt" gedit
It takes much longer to start a program when it is encased in a debugger, and the entire output will go to the log-file designated. Once the program is open, you can close the program by typing [CTRL][C] on the command line, or if the application under test has a GUI interface, you can close the window, and Valgrind will shut down after watching the application you are testing go down. In this example there are over 600 lines of output from the debugger, and you are going to need to use a more user-friendly debugger to find more useful information. Keeping in mind that gedit is a very mature program and it works flawlessly every time we use it to edit text files, it still has 24 memory errors noted by Valgrind in the undemanding use case of opening gedit, typing a few characters and closing without saving the new document.

The EDB-Debugger is a version of a Windows application called the Olly debugger. EDB-Debugger has the following features:
- A GUI interface which the developers call intuitive
- Standard debugging operations (step-into/step-over/run/break)
- More unusual conditional breakpoints
- A debugging core that is implemented as a plugin (you can drop in replacement core plugins)
- Some platforms may have several debugging APIs available, in which case you may have a plugin that implements any of them
- Basic instruction analysis
- View/dump memory regions
- Effective address inspection
- The data dump view is tabbed, allowing you to have several views of memory open at the same time and quickly switch between them
- It allows import and generation of symbol maps
- Plugins to extend the usability
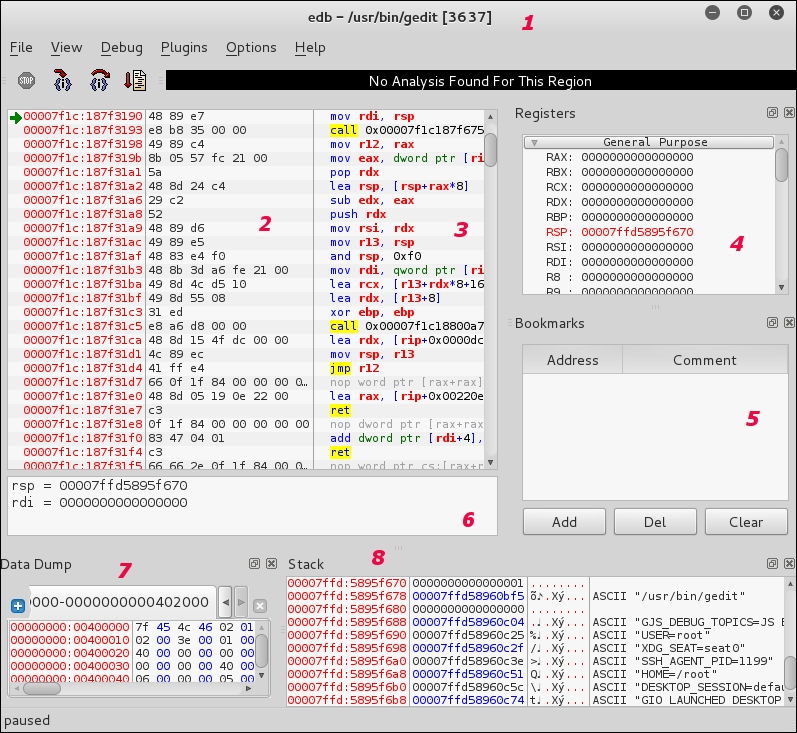
EDB-Debugger is designed to debug Linux applications, and we will look at the same application, gedit, with EDB-Debugger. The GUI interface looks like this:
EDB-Debugger can give you a symbol map by the command-line entry:
edb --symbols /usr/bin/gedit > gedit.map
The symbol table maps functions, lines, or variables in a program. In the case of gedit, the symbol table looks as follows:

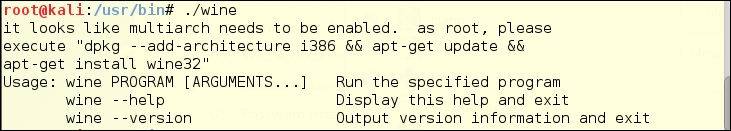
If you are running the 64-bit version of Kali Linux 2.0, you will first need to update Kali. It is missing the 32-bit wine infrastructure and wine doesn't even want to start without that. Luckily, Kali Linux gives you a useful error message. You just have to copy the quoted part of the error message and run it.
The OllyDbg GUI window does look a lot like EDB-Debugger, though it is graphically a little uglier. We are looking at notepad.exe, which is a Windows-only editor, similar to a cut-down version of gedit. The window is broken up into the following:
- The application being tested in the title bar
- Memory location
- Symbol mapping
- Commands
- Registers
- Data dump – memory locations and content
- Memory Stack data
When you open an executable file (EXE, PIF, or COM) it shows you the entire running program.

You could choose to run OllyDbg on your target Windows machine to look at an ongoing infection, by copying its folder to a flash drive and carrying the flash drive over to the infected machine. You could also install Kali Linux to a bootable flash drive as we mentioned in Chapter 1, Sharpening the Saw, and run Kali directly on the infected machine.
A disassembler takes compiled binary code and displays the assembly code. This is similar to what the debuggers can show you.
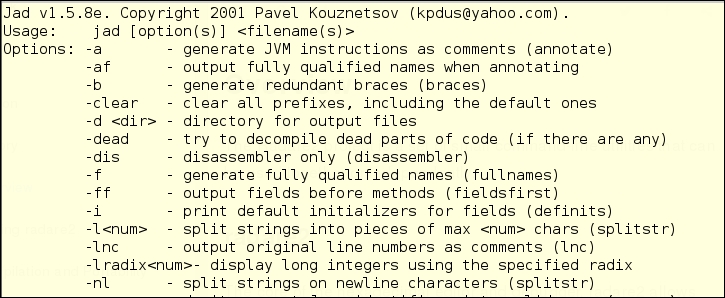
JAD is a Java decompiler included with Kali Linux, and it seems like a useful tool for analyzing potentially dangerous Java applets that come in from web pages. The biggest problem with it is that it has not had a maintainer since 2011, and so is difficult to find, except in the Kali repository, and at Tomas Varaneckas's blog page Jad Decompiler Download Mirror at http://varaneckas.com/jad/.
The following is a page from the JAD help file, that you access from the main menu or by typing jad in the command line.
For a short example of what it looks like to use JAD, we created a Java class for you. The next three illustrations are:
- Original source code (not always available)
- Running JAD
- Decompiled source
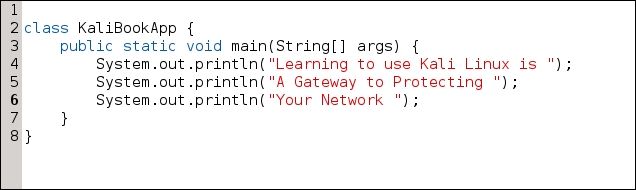
So here is the source-code for a little Java class that will print some static content to the command-line standard output:
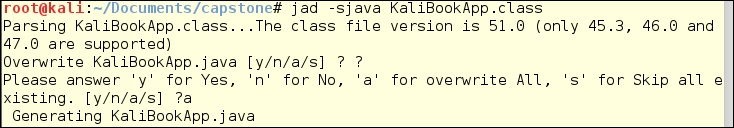
With the application running, we showed the result of using the inline help (type a question mark instead of one of the letter choices) just to show the level of detail available. We then chose a, and JAD overwrote the source. This will not be a problem when you have only the compiled class.
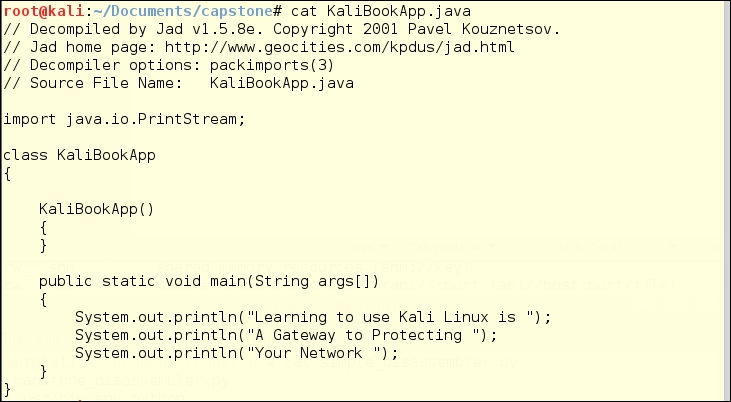
Finally, here is the decompiled source code.
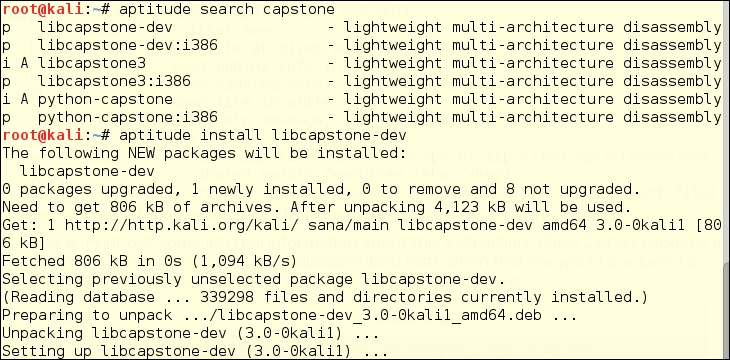
The Capstone decompiling engine is well-maintained, and has a simple API. Basic Capstone libraries come default on Kali Linux, and you can build your own frontend using any language with which you are familiar. We are using Python, as it is our go-to scripting language. Using the aptitude search <keyword> command structure, you can make sure you have available packages, and can see the status of the packages. In this case you can see that "p" in the first column means that there is a package available, and "i" means it is installed. The "A" in the second column shows the package was installed automatically, and is probably a dependency for some other package. We have chosen to install libcapstone-dev for the 64-bit architecture we have on the Kali instance, in case we want to attempt to customize the behavior of Capstone. You don't need to do that to use Capstone.
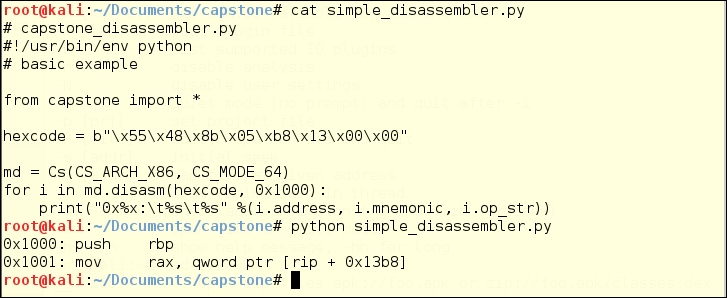
Here is a simple disassembler script based on examples at http://www.capstone-engine.org/lang_python.html. This could be far more automated, but for the example, the hexcode is hardcoded into the script.
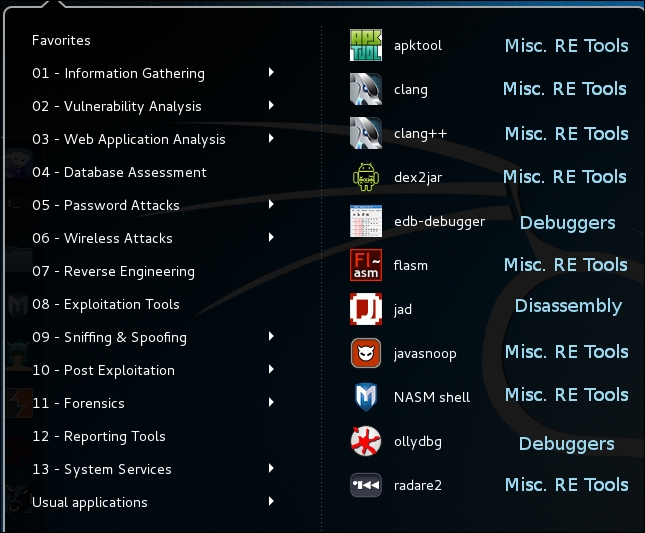
There is a large category of miscellaneous reverse-engineering tools, listed as such in the Kali Linux 1.x menu, but not categorized in the Kali Linux 2.0 menu. Rather than randomly picking a couple of these, we are showing you an integrated suite of tools led by Radare2.
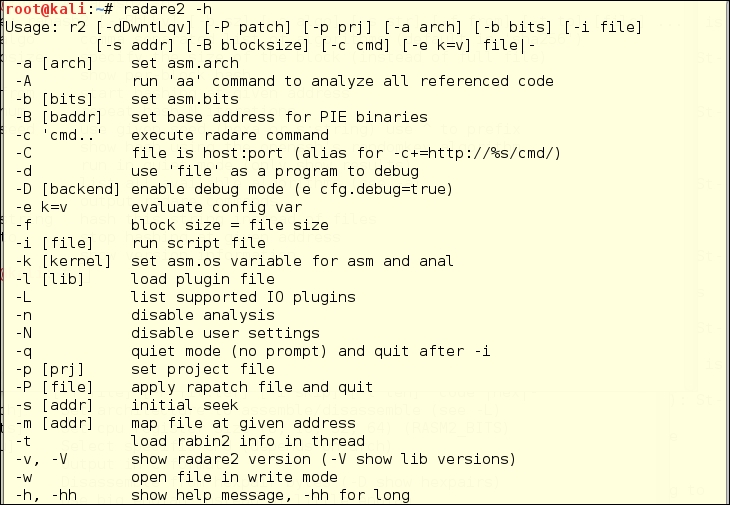
You can start Radare2 by clicking the menu link under Reverse Engineering. You are probably more comfortable with the command line now, so you will probably want to open it directly in the command line. Open the command-line launcher by typing the keyboard shortcut ALT + F2. Then the following command opens the program's help file in a new terminal window:
bash -c "radare2 -h" #  this makes sure that you are opening the bash shell
#  rather than some other possible default shell
#  like the dash shell
To break this command down for you:
bashopens a bash shell- -c directs dash to read from a command string, which follows in double quotes, instead of waiting for standard input from the keyboard
- radare2 is the application we are opening
-his the option that opens a help file in the terminal window, if one exists--helpis the long form of that option, (these options are available on almost every Linux command-line tool)
Radare2 is an advanced command-line hexadecimal editor, disassembler, and debugger. Radare2 (http://radare.org) states that Radare2 is a portable reversing framework.
Radare2 is the tip of a framework that is integrated with 10 plugins and several other applications. To keep the PG rating, we fuzzed out the last plugin name.

The Radare2 Suite really deserves its own chapter, if not a whole book. We have to mention some of the other useful tools available in this suite:
- rasm2
- rahash2
- radiff2
- rafind2
- rax2
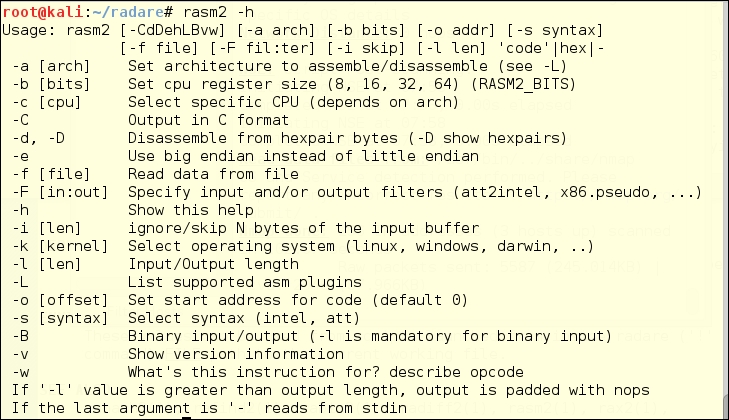
Rasm2 /usr/bin/rasm2 is a command-line assembler/disassembler for several architectures; for example, Intel x86 and x86-64, MIPS, ARM, PowerPC, Java, and MSIL. This may be your go-to for disassembly when JAD is no longer available.
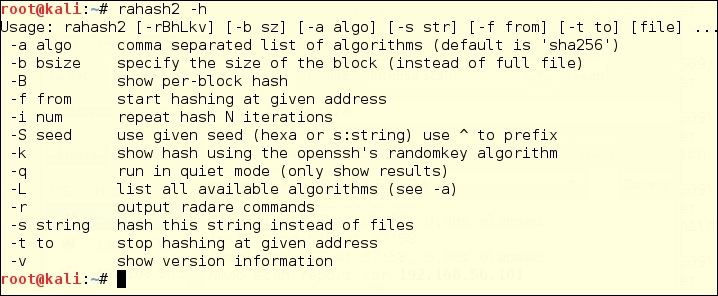
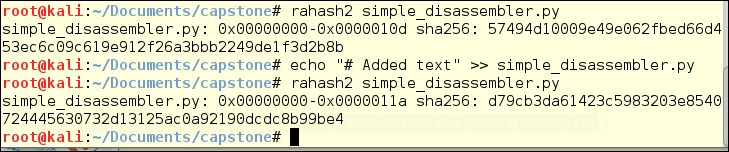
Rahash2 (/usr/bin/rahash) is a block-based hash tool, which supports many algorithms; for example MD4, MD5, CRC16, CRC32, SHA1, SHA256, SHA384, SHA512, par, xor, xorpair, mod255, hamdist, or entropy. You can use rahash2 to check the integrity of, and track changes to, files, memory dumps, and disks.
The following is an example of testing the sha256 hash for a small file.
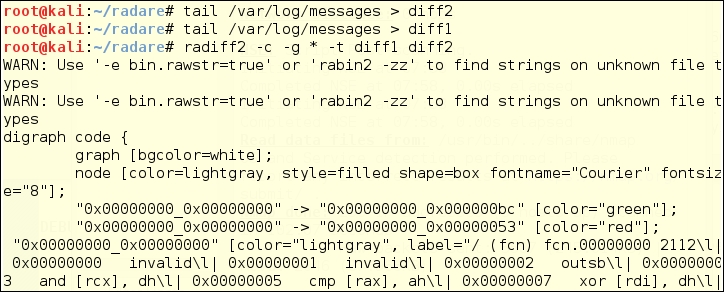
Radiff2 is a binary utility that uses various algorithms to compare files. It supports byte-level or delta comparisons for binary files, and code-analysis comparisons to find changes in code blocks produced by a radare code analysis. The following is a test of comparing two states of the /var/log/messages log over the course of a couple of seconds. This is a comparison at the bit level, for random changes.
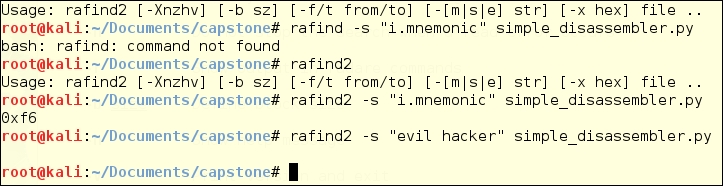
Rafind2 is designed to search for patterns in files. In the following example, rafind2 -s "<string searched>" <file> shows you what we see when we search for a string that we know to exist, and one we know to be absent.
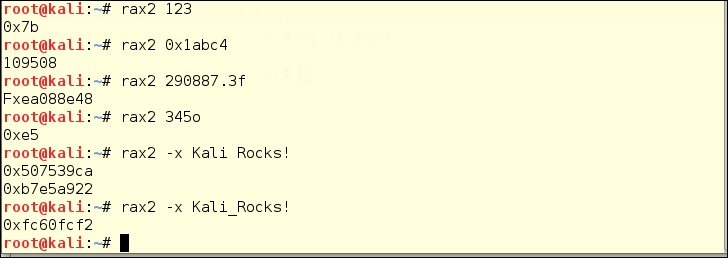
Rax2 is a mathematical expression evaluator for the command line. You can do many conversion operations that are useful for making base conversions between floating point values, hexadecimal representations, hexpair strings to ASCII, octal to integer, and so on. It also supports endianness settings and can be used as an interactive shell if no arguments are given.
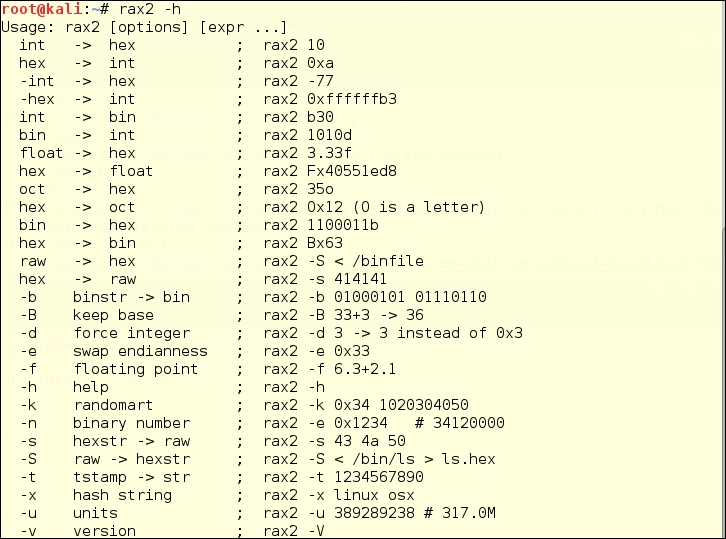
Some example conversions with rax2 include: