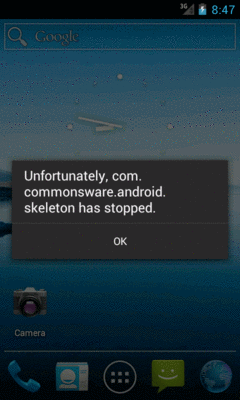
Figure 102: A Crash Dialog on Android 4.0.3
Now that we are starting to manipulate layouts and Java code more significantly, the odds increase that we are going to somehow do it wrong, and our app will crash.
Figure 102: A Crash Dialog on Android 4.0.3
In this chapter, we will cover a few tips on how to debug these sorts of issues.
If you see one of those “Force Close” or “Has Stopped” dialogs, the first thing you will want to do is examine the Java stack trace that is associated with this crash. These are logged to a facility known as Logcat, on your device or emulator.
To view Logcat, you have two choices:
adb logcat command at the command line (or something that uses
adb logcat, such as various colorizing scripts available online)There are also Logcat apps on the Play Store, such as aLogcat, that will display the contents of Logcat. However, for security and privacy reasons, on Android 4.1 and higher devices, such apps will only be able to show you their Logcat entries, not those from the system, your app, or anyone else. Hence, for development purposes, it is better to use one of the other alternatives outlined above.
The Logcat view is available at any time, from pretty much anywhere in Android Studio, by means of clicking on the Android tool window entry, usually docked at the bottom of your IDE window:

Figure 103: Minimized Tool Windows in Android Studio, Showing Logcat Tool
Tapping on that will bring up some Android-specific logs in an “Android DDMS” tool window, with a tab for “Devices | logcat”:
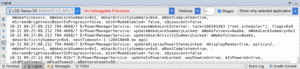
Figure 104: Android DDMS Tool Window, Showing Logcat
Logcat will show your stack traces, diagnostic information from the operating
system, and anything you wish to include via calls to static methods on the
android.util.Log class. For example, Log.e() will log a message at error
severity, causing it to be displayed in red.
If you want to send something from Logcat to somebody else, such as via an issue tracker, just highlight the text and copy it to the clipboard, as you would with any text editor.
The “trash can” icon atop the tool strip on the left is the “clear log” tool. Clicking it will appear to clear Logcat. It definitely clears your Logcat view, so you will only see messages logged after you cleared it. Note, though, that this does not actually clear the logs from the device or emulator.
In addition, you can:
If you crash, the stack trace might suggest that there is a problem tied to
your resources. One common flavor of this is a ClassCastException when you
call findViewById(). For example, you might call
(Button)findViewById(R.id.button), yet get a
ClassCastException: android.widget.LinearLayout as a result, indicating
that while you thought your findViewById() call would return a Button,
it really returned a LinearLayout.
Often times, this is not your fault. Sometimes, the R values get out of sync
with pre-compiled classes from previous builds. This most often occurs just
after you change your mix of resources (e.g., add a new layout).
To resolve this, you need to clean your project. To do this, in Android Studio, choose “Build > Clean Project” from the main menu.
So, if you get a strange crash that seems like it might be related to resources, clean your project. If the problem goes away, you are set — if the problem persists, you will need to do a bit more debugging.
One of the hallmarks of Java IDEs is the ability to do real-time debugging, using breakpoints and the like. In that respect, Android Studio works for Android apps in the same way that IntelliJ IDEA and Eclipse work for Java apps. You can debug on an emulator or any Android device for which you enabled USB debugging (as you may have done in Tutorial #1).
Lacking any Android Studio-specific documentation, you will wind up referring to the documentation for IntelliJ IDEA to learn how to use its debugger.
With Android Studio, the run controls in the toolbar will give you some options for debugging your app:
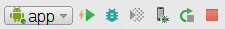
Figure 105: Android Studio Run Controls
The bug-shaped button to the right of the “run” green triangle will launch your app and attach the debugger, so breakpoints will be honored. If your app is already running, and you want to debug the running process, you can do that via the toolbar button that looks like a phone with a small bug in the lower-right corner.