Figure 924: Layout Inspector, As Initially Launched
Layouts get complicated. Not only might you be pulling in from several
sources (via fragments or <include> or whatever), but you make changes
to the contents of the UI at runtime. What you have in your layout resources
is a starting point, but only that. Sometimes, it would be helpful to
see exactly what is in the UI of your app right now, based on what
you have done inside that app.
First, get a debuggable build of your app running on your chosen device or emulator, with the desired activity in the foreground, in the state that you are interested in. Layout Inspector captures a snapshot of the state; it does not continuously update as the UI changes. Hence, you need to get the UI into the state that you want to inspect first.
Then, choose Tools > Layout Inspector from the Android Studio main menu.
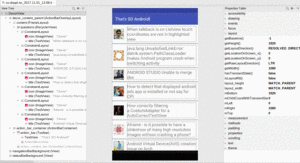
When you inspect a layout, a tab is opened in Android Studio with a tree of widgets on the left, a wireframe-enhanced screenshot in the center, and a properties pane on the right:
Figure 924: Layout Inspector, As Initially Launched
Hovering over a widget in the tree or the wireframe will outline it in red. Selecting that widget in the tree or the wireframe, by clicking on it, outlines it in blue and updates the properties pane with the properties for that particular widget or container.
The properties pane shows a tree of fields, getter methods, and XML-style attributes. You can use these to view the state of the widget or container. However, these properties are read-only; you cannot modify the UI from the Layout Inspector.
Layout Inspector is not purely a tab in the IDE. The data collected
by Android Studio to populate the Layout Inspector is saved in your
project’s captures/ directory. This allows you to view that same
data again in the future. This may be useful for comparing different
captures from different times, such as “before-and-after” captures
to see what effects a code change had on your layout contents.