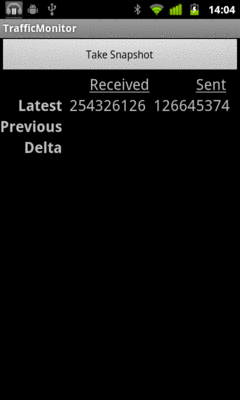
Figure 976: The TrafficMonitor sample application, as initially launched
To be able to have more intelligent code — code that can adapt
to Internet activity on the device — Android offers the
TrafficStats class. This class really is a gateway to a block of
native code that reports on traffic usage for the entire device and
per-application, for both received and transmitted data. This chapter
will examine how you can access TrafficStats and interpret its data.
Understanding this chapter requires that you have read the core chapters and understand how Android apps are set up and operate.
The TrafficStats class is not designed to be instantiated —
you will not be invoking a constructor by calling new
TrafficStats() or something like that. Rather, TrafficStats is
merely a collection of static methods, mapped to native code, that
provide access to point-in-time traffic values. No special
permissions are needed to use any of these methods. Most of the
methods were added in API Level 8 and therefore should be callable on
most Android devices in use today.
If you are interested in overall traffic, you will probably care most
about the getTotalRxBytes() and getTotalTxBytes() on
TrafficStats. These methods return received and transmitted
traffic, respectively, measured in bytes.
You also have:
getTotalRxPackets() and getTotalTxPackets(), if for your case
measuring IP packets is a better measure than bytesgetMobileRxBytes() and getMobileTxBytes(), which return the
traffic going over mobile data (also included in the total)getMobileRxPackets() and getMobileTxPackets(), which are the
packet counts for the mobile data connectionTechnically, TrafficStats does not provide per-application traffic
statistics. Rather, it provides per-UID traffic statistics. In most
cases, the UID (user ID) of an application is unique, and therefore
per-UID statistics map to per-application statistics. However, it is
possible for multiple applications to share a single UID (e.g., via
the android:sharedUserId manifest attribute) — in this case,
TrafficStats would appear to provide traffic data for all
applications sharing that UID.
There are per-UID equivalents of the first four methods listed in the
previous section, replacing “Total” with “Uid”. So, to find out
overall traffic for an application, you could use getUidRxBytes()
and getUidTxBytes(). However, these are the only two UID-specific
methods that were implemented in API Level 8. Equivalents of the
others (e.g., getUidRxPackets()) were added in API Level 12. API
Level 12 also added some TCP-specific methods (e.g.,
getUidTcpTxBytes()). Note, though, that the mobile-only method are
only available at the device level; there are no UID-specific
versions of those methods.
You will get one of two types of return value from these methods.
In theory, you will get the value the method calls for (e.g., number
of bytes, number of packets). The documentation does not state the
time period for that value, so while it is possible that it is really
“number of bytes since the device was booted”, we do not know that
for certain. Hence, TrafficStats results should be used for
comparison purposes, either comparing the same value over time or
comparing multiple values at the same time. For example, to measure
bandwidth consumption, you will need to record the TrafficStats
values at one point in time, then again later — the difference
between them represents the consumed bandwidth during that period of
time.
In practice, while the “total” methods seem reliable, the per-UID
methods may return -1.
Three possible meanings are:
Hence, the per-UID values are a bit “hit or miss”, which you will need to take into account.
To illustrate the use of TrafficStats methods and analysis, let us
walk through the code associated with the
Bandwidth/TrafficMonitor
sample application. This is a simple activity that records a snapshot of the
current traffic levels on startup, then again whenever you tap a
button. On-screen, it will display the current value, previous value,
and difference (“delta”) between them. In Logcat, it will dump the
same information on a per-UID basis.
It would have been nice if TrafficStats were indeed an object that
you would instantiate, that captured the traffic values at that
moment in time. Alas, that is not how it was written, so we need to
do that ourselves. In the TrafficMonitor project, this job is
delegated to a TrafficRecord class:
package com.commonsware.android.tuning.traffic;

import android.net.TrafficStats;

class TrafficRecord {
  long tx=0;
  long rx=0;
  String tag=null;

  TrafficRecord() {
    tx=TrafficStats.getTotalTxBytes();
    rx=TrafficStats.getTotalRxBytes();
  }

  TrafficRecord(int uid, String tag) {
    tx=TrafficStats.getUidTxBytes(uid);
    rx=TrafficStats.getUidRxBytes(uid);
    this.tag=tag;
  }
}There are two separate constructors, one for the total case and one
for the per-UID case. The total case just logs getTotalRxBytes()
and getTotalTxBytes(), while the per-UID case uses
getUidRxBytes() and getUidTxBytes(). The per-UID case also stores
a “tag”, which is simply a String identifying the UID for this
record — as you will see, TrafficMonitor uses this for a
package name.
An individual TrafficRecord, though, is insufficient to completely
capture the traffic figures at a moment in time. We need a collection
of TrafficRecord objects, one for the device (“total”) and one per
running UID. The work to collect all of that is handled by a
TrafficSnapshot class:
package com.commonsware.android.tuning.traffic;

import java.util.HashMap;
import android.content.Context;
import android.content.pm.ApplicationInfo;

class TrafficSnapshot {
  TrafficRecord device=null;
  HashMap<Integer, TrafficRecord> apps=
    new HashMap<Integer, TrafficRecord>();

  TrafficSnapshot(Context ctxt) {
    device=new TrafficRecord();

    HashMap<Integer, String> appNames=new HashMap<Integer, String>();

    for (ApplicationInfo app :
          ctxt.getPackageManager().getInstalledApplications(0)) {
      appNames.put(app.uid, app.packageName);
    }

    for (Integer uid : appNames.keySet()) {
      apps.put(uid, new TrafficRecord(uid, appNames.get(uid)));
    }
  }
}The constructor uses PackageManager to iterate over all installed
applications and builds up a HashMap, mapping the UID to a
TrafficRecord for that UID, tagged with the application package
name (e.g., com.commonsware.android.tuning.traffic). It also
creates one TrafficRecord for the device as a whole.
TrafficMonitorActivity is what creates and uses TrafficSnapshot
objects. This is a fairly conventional activity with a
TableLayout-based UI:
<?xml version="1.0" encoding="utf-8"?>
<TableLayout xmlns:android="http://schemas.android.com/apk/res/android"
  android:id="@+id/table"
  android:layout_width="match_parent"
  android:layout_height="wrap_content">

  <Button
    android:onClick="takeSnapshot"
    android:text="Take Snapshot"/>

  <TableRow>

    <TextView
      android:layout_column="1"
      android:layout_gravity="right"
      android:text="@string/received"
      android:textSize="20sp"/>

    <TextView
      android:layout_gravity="right"
      android:text="@string/sent"
      android:textSize="20sp"/>
  </TableRow>

  <TableRow>

    <TextView
      android:layout_marginRight="@dimen/margin_right"
      android:gravity="right"
      android:text="@string/latest"
      android:textSize="20sp"
      android:textStyle="bold"/>

    <TextView
      android:id="@+id/latest_rx"
      android:layout_marginRight="@dimen/margin_right"
      android:gravity="right"
      android:textSize="20sp"/>

    <TextView
      android:id="@+id/latest_tx"
      android:gravity="right"
      android:textSize="20sp"/>
  </TableRow>

  <TableRow>

    <TextView
      android:layout_marginRight="@dimen/margin_right"
      android:gravity="right"
      android:text="@string/previous"
      android:textSize="20sp"
      android:textStyle="bold"/>

    <TextView
      android:id="@+id/previous_rx"
      android:layout_marginRight="@dimen/margin_right"
      android:gravity="right"
      android:textSize="20sp"/>

    <TextView
      android:id="@+id/previous_tx"
      android:gravity="right"
      android:textSize="20sp"/>
  </TableRow>

  <TableRow>

    <TextView
      android:layout_marginRight="@dimen/margin_right"
      android:gravity="right"
      android:text="@string/delta"
      android:textSize="20sp"
      android:textStyle="bold"/>

    <TextView
      android:id="@+id/delta_rx"
      android:layout_marginRight="@dimen/margin_right"
      android:gravity="right"
      android:textSize="20sp"/>

    <TextView
      android:id="@+id/delta_tx"
      android:gravity="right"
      android:textSize="20sp"/>
  </TableRow>

</TableLayout>The activity implementation consists of three methods. There is your
typical onCreate() implementation, where we initialize the UI, get
our hands on the TextView widgets for output, and take the initial
snapshot:
  @Override
  public void onCreate(Bundle savedInstanceState) {
    super.onCreate(savedInstanceState);
    setContentView(R.layout.main);

    latest_rx=(TextView)findViewById(R.id.latest_rx);
    latest_tx=(TextView)findViewById(R.id.latest_tx);
    previous_rx=(TextView)findViewById(R.id.previous_rx);
    previous_tx=(TextView)findViewById(R.id.previous_tx);
    delta_rx=(TextView)findViewById(R.id.delta_rx);
    delta_tx=(TextView)findViewById(R.id.delta_tx);

    takeSnapshot(null);
  }
The takeSnapshot() method creates a new TrafficSnapshot (held in
a latest data member) after moving the last TrafficSnapshot to a
previous data member. It then updates the TextView widgets for
the latest data and, if the previous data member is not null,
also for the previous snapshot and the difference between them.
This alone is sufficient to update the UI, but we also want to log
per-UID data to Logcat:
  public void takeSnapshot(View v) {
    previous=latest;
    latest=new TrafficSnapshot(this);

    latest_rx.setText(String.valueOf(latest.device.rx));
    latest_tx.setText(String.valueOf(latest.device.tx));

    if (previous!=null) {
      previous_rx.setText(String.valueOf(previous.device.rx));
      previous_tx.setText(String.valueOf(previous.device.tx));

      delta_rx.setText(String.valueOf(latest.device.rx-previous.device.rx));
      delta_tx.setText(String.valueOf(latest.device.tx-previous.device.tx));
    }

    ArrayList<String> log=new ArrayList<String>();
    HashSet<Integer> intersection=new HashSet<Integer>(latest.apps.keySet());

    if (previous!=null) {
      intersection.retainAll(previous.apps.keySet());
    }

    for (Integer uid : intersection) {
      TrafficRecord latest_rec=latest.apps.get(uid);
      TrafficRecord previous_rec=
            (previous==null ? null : previous.apps.get(uid));

      emitLog(latest_rec.tag, latest_rec, previous_rec, log);
    }

    Collections.sort(log);

    for (String row : log) {
      Log.d("TrafficMonitor", row);
    }
  }
One possible problem with the snapshot system is that the process
list may change between snapshots. One simple way to address this is
to only log to Logcat data where the application’s UID exists in both
the previous and latest snapshots. Hence, takeSnapshot() uses a
HashSet and retainAll() to determine which UIDs exist in both
snapshots. For each of those, we call an emitLog() method to record
the data to an ArrayList, which is then sorted and dumped to Logcat.
The emitLog() method builds up a line with the package name and
bandwidth consumption information, assuming that there is bandwidth
to report (i.e., we have a value other than -1):
  private void emitLog(CharSequence name, TrafficRecord latest_rec,
                        TrafficRecord previous_rec,
                        ArrayList<String> rows) {
    if (latest_rec.rx>-1 || latest_rec.tx>-1) {
      StringBuilder buf=new StringBuilder(name);

      buf.append("=");
      buf.append(String.valueOf(latest_rec.rx));
      buf.append(" received");

      if (previous_rec!=null) {
        buf.append(" (delta=");
        buf.append(String.valueOf(latest_rec.rx-previous_rec.rx));
        buf.append(")");
      }

      buf.append(", ");
      buf.append(String.valueOf(latest_rec.tx));
      buf.append(" sent");

      if (previous_rec!=null) {
        buf.append(" (delta=");
        buf.append(String.valueOf(latest_rec.tx-previous_rec.tx));
        buf.append(")");
      }

      rows.add(buf.toString());
    }
  }
Since the lines created by emitLog() start with the package name,
and since we are sorting those before dumping them to Logcat, they
appear in Logcat in sorted order by package name.
Running the activity gives you the initial received and sent counts (in bytes):
Figure 976: The TrafficMonitor sample application, as initially launched
Tapping Take Snapshot grabs a second snapshot and compares the two:
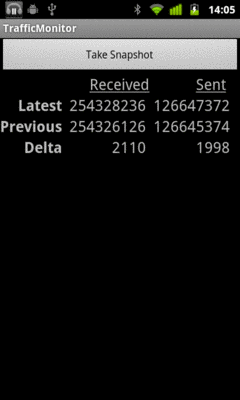
Figure 977: The TrafficMonitor sample application, after Take Snapshot was clicked
Also, Logcat will show how much was used by various apps:
08-15 14:05:10.128: DEBUG/TrafficMonitor(10283): com.amblingbooks.bookplayerpro=880 received (delta=0), 3200 sent (delta=0)
08-15 14:05:10.128: DEBUG/TrafficMonitor(10283): com.android.browser=19045241 received (delta=0), 2375847 sent (delta=0)
08-15 14:05:10.128: DEBUG/TrafficMonitor(10283): com.android.providers.downloads=27884469 received (delta=0), 9126 sent (delta=0)
08-15 14:05:10.128: DEBUG/TrafficMonitor(10283): com.android.providers.telephony=2328 received (delta=0), 4912 sent (delta=0)
08-15 14:05:10.128: DEBUG/TrafficMonitor(10283): com.android.vending=3271839 received (delta=0), 260626 sent (delta=0)
08-15 14:05:10.128: DEBUG/TrafficMonitor(10283): com.coair.mobile.android=887425 received (delta=0), 81366 sent (delta=0)
08-15 14:05:10.132: DEBUG/TrafficMonitor(10283): com.commonsware.android.browser1=262553 received (delta=0), 7286 sent (delta=0)
08-15 14:05:10.132: DEBUG/TrafficMonitor(10283): com.dropbox.android=6189833 received (delta=0), 4298 sent (delta=0)
08-15 14:05:10.132: DEBUG/TrafficMonitor(10283): com.evernote=3471398 received (delta=0), 742178 sent (delta=0)
08-15 14:05:10.132: DEBUG/TrafficMonitor(10283): com.google.android.apps.genie.geniewidget=358816 received (delta=0), 17775 sent (delta=0)
08-15 14:05:10.132: DEBUG/TrafficMonitor(10283): com.google.android.apps.googlevoice=103255 received (delta=0), 35559 sent (delta=0)
08-15 14:05:10.132: DEBUG/TrafficMonitor(10283): com.google.android.apps.maps=28440829 received (delta=0), 1230867 sent (delta=0)
08-15 14:05:10.132: DEBUG/TrafficMonitor(10283): com.google.android.backup=51320 received (delta=0), 49041 sent (delta=0)
08-15 14:05:10.132: DEBUG/TrafficMonitor(10283): com.google.android.gm=10915084 received (delta=0), 14428803 sent (delta=0)
08-15 14:05:10.132: DEBUG/TrafficMonitor(10283): com.google.android.googlequicksearchbox=37817 received (delta=0), 12554 sent (delta=0)
08-15 14:05:10.132: DEBUG/TrafficMonitor(10283): com.google.android.syncadapters.contacts=1955990 received (delta=0), 714893 sent (delta=0)
08-15 14:05:10.132: DEBUG/TrafficMonitor(10283): com.google.android.voicesearch=67948 received (delta=0), 121908 sent (delta=0)
08-15 14:05:10.132: DEBUG/TrafficMonitor(10283): com.google.android.youtube=3128 received (delta=0), 2792 sent (delta=0)
08-15 14:05:10.132: DEBUG/TrafficMonitor(10283): com.howcast.android.app=2250407 received (delta=0), 26727 sent (delta=0)
08-15 14:05:10.132: DEBUG/TrafficMonitor(10283): com.rememberthemilk.MobileRTM=6836605 received (delta=0), 2902904 sent (delta=0)
08-15 14:05:10.132: DEBUG/TrafficMonitor(10283): com.tripit=109499 received (delta=0), 50060 sent (delta=0)
Of course, there are more ways you could use TrafficStats than
simply having an activity to report them on a button click.
TrafficMonitor is merely a demonstration of using the class and
providing a lightweight way to get value out of that data. Depending
upon your application’s operations, though, you may wish to consider
using TrafficStats in other ways, in your production code or in
your test suites.
If your app is a bandwidth monitor, the need to use TrafficStats is
obvious. However, even if your app does something else, you may wish
to use TrafficStats to understand what is going on in terms of
Internet access within your app or on the device as a whole.
For example, you might want to consider bandwidth consumption to be a metric worthy of including in the rest of the “analytics” you generate from your app. If you are using services like Flurry to monitor which activities get used and so on, you might consider also logging the amount of bandwidth your application consumes. This not only gives you much more “real world” data than you will be able to collect on your own, but it may give you ideas of how users are using your application beyond what the rest of your metrics are reporting.
Another possibility would be to include your app’s bandwidth consumption in error logs reported via libraries like ACRA. Just as device particulars can help identify certain bug report patterns, perhaps certain crashes of your app only occur when users are using a lot of bandwidth in your app, or using a lot of bandwidth elsewhere and perhaps choking your own app’s Internet access.
The chapter on bandwidth mitigation strategies
will also cover a number of uses of TrafficStats for real-time
adjustment of your application logic.
You might consider adding TrafficStats-based bandwidth logging for
your application in your test suites. While individual tests may or
may not give you useful data, you may be able to draw trendlines over
time to see if you are consuming more or less bandwidth than you used
to. Take care to factor in that you may have changed the tests, in
addition to changing the code that is being tested.
From a JUnit-based unit test suite, measuring bandwidth consumption
is not especially hard. You can bake it into the setUp() and
tearDown() methods of your test cases, either via inheritance or
composition, and log the output to a file or Logcat.
From an external test engine, like
monkeyrunner or
NativeDriver, recording
bandwidth usage is more tricky, because your test code is not running
on the device or emulator. You may have to include a
BroadcastReceiver in your production code that will log bandwidth
usage and trigger that code via the am broadcast shell command.