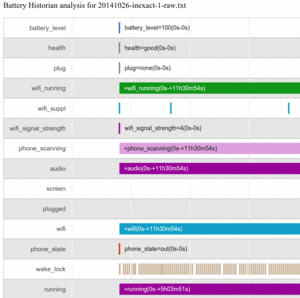
Figure 1012: Battery Historian Timeline, Partial View
As with any situation where you are trying to reduce your use of some system resource, you need to be able to accurately measure how much you are using that resource. Otherwise, you will have no idea whether your attempts to reduce usage are helping. It is possible that what you think will consume less of the resource actually consumes more, because of unanticipated side-effects. And, if nothing else, if the change makes your code more complicated and does not help much with resource consumption, you may be better served sticking with the original, simpler implementation.
So, when it comes to power usage, it helps to know how much power you are consuming, to determine if your attempts to use less power actually do help.
Unfortunately, compared to things like RAM and bandwidth, power measurement is a significant challenge. You really need to have hardware specifically instrumented to report power consumption for pieces of that hardware (CPU versus screen versus GPS versus mobile data radio versus …). Even if you cannot get power usage per component, just having accurate power consumption overall is not something you can necessarily get from any Android device. Alas, getting that level of power usage knowledge can be troublesome in its own right, for a variety of reasons.
This chapter will explore a few ways of measuring power usage, along with the pros and cons of that approach.
Understanding this chapter requires that you have read the core chapters and understand how Android apps are set up and operate.
Android 5.0 brought us “Project Volta”, an initiative to reduce the amount of power consumed by apps, the framework classes, and the OS itself.
Part of what we got from Project Volta is batterystats, a dump of
data pertaining to power consumption. Since that data dump can be
large and inscrutable, we also have the Battery Historian, a tool
that can convert key batterystats output into a timeline of
events.
However, none of this is especially well-documented at this time, and so the usefulness of these utilities is limited at present. The following sections provide some basic guidance for trying to use these tools.
First, since batterystats is obtained via adb shell dumpsys,
you will want adb to be in your PATH, by adding your SDK
installation’s platform-tools/ directory to your PATH environment
variable.
Then, in a terminal, run:
adb shell dumpsys batterystats --enable full-wake-history
adb shell dumpsys batterystats --reset
This will ensure that batterystats captures all relevant information
about WakeLock behavior, and it resets all of the logs.
At this point, run your tests. Ideally, you would do so in a fairly
power-neutral environment, such as not using a USB cable for
an adb connection (as that charges the device).
When your test scenario is complete, run adb shell dumpsys batterystats,
redirecting the output to some file:
adb shell dumpsys batterystats > /tmp/bs.txt
You can optionally supply your applicationId as part of the batterystats
command, which will restrict the output to events pertaining to your app.
However, some events that are from other processes, like the Play Services
Framework, may be of interest to you. You will need to experiment to determine
which mode (full or filtered for your app) will work best for you.
Depending on how long your test runs, the information included in
the batterystats output can be anywhere from tens of KB to tens
of MB in size. The output will also vary by Android OS release.
The file will lead off with the “Battery History” section:
Battery History (13% used, 35KB used of 256KB, 68 strings using 4232):
          0 (9) RESET:TIME: 2014-10-25-19-54-07
          0 (2) 100 status=not-charging health=good plug=none temp=207 volt=4296 +running +wake_lock +sensor +phone_scanning +audio +screen phone_state=out +wifi_running +wifi wifi_signal_strength=4 wifi_suppl=completed proc=u0a3:"android.process.acore"
          0 (2) 100 proc=u0a29:"com.android.calendar"
          0 (2) 100 proc=1027:"com.android.nfc:sendui"
          0 (2) 100 proc=u0a7:"com.google.android.gms"
          0 (2) 100 proc=1000:"WebViewLoader-armeabi-v7a"
          0 (2) 100 proc=u0a32:"com.google.android.configupdater"
          0 (2) 100 proc=u0a7:"com.google.process.location"
          0 (2) 100 proc=u0a12:"com.android.launcher"
          0 (2) 100 proc=1001:"com.android.server.telecom"
          0 (2) 100 proc=u0a7:"com.google.process.gapps"
          0 (2) 100 proc=u0a55:"com.nuance.xt9.input"
          0 (2) 100 proc=u0a33:"com.google.android.deskclock"
          0 (2) 100 proc=u0a5:"android.process.media"
          0 (2) 100 proc=u0a20:"com.android.systemui"
          0 (2) 100 proc=1027:"com.android.nfc"
          0 (2) 100 proc=1001:"com.android.phone"
          0 (2) 100 proc=u0a37:"com.google.android.gallery3d"
          0 (2) 100 proc=u0a58:"com.commonsware.android.job"
          0 (2) 100 proc=u0a2:"com.android.providers.calendar"
          0 (2) 100 proc=u0a16:"com.android.vending"
          0 (2) 100 proc=u0a7:"com.google.android.gms.unstable"
          0 (2) 100 proc=u0a42:"com.google.android.inputmethod.latin"
          0 (2) 100 proc=u0a11:"com.google.android.partnersetup"
          0 (2) 100 top=u0a58:"com.commonsware.android.job"
          0 (2) 100 wake_lock_in=-1:"screen"
          0 (2) 100 user=0:"0"
          0 (2) 100 userfg=0:"0"
      +36ms (2) 100 +wake_lock_in=u0a7:"Wakeful StateMachine: GeofencerStateMachine"
      +37ms (2) 100 -wake_lock_in=u0a7:"Wakeful StateMachine: GeofencerStateMachine"
     +104ms (2) 100 +wake_lock_in=u0a7:"UlrDispatchingService"
     +146ms (2) 100 +wake_lock_in=u0a7:"GCoreFlp"
     +147ms (2) 100 -wake_lock_in=u0a7:"GCoreFlp"
     +150ms (2) 100 -wake_lock_in=u0a7:"UlrDispatchingService"
   +2s001ms (2) 100 volt=4243
   +6s779ms (3) 100 -sensor +wake_lock_in=1000:"ActivityManager-Sleep"
   +6s781ms (2) 100 +wake_lock_in=u0a20:"show keyguard"
   +6s811ms (2) 100 -wake_lock_in=1000:"ActivityManager-Sleep"
   +6s820ms (2) 100 +wake_lock_in=1000:"WifiSuspend"
   +6s835ms (2) 100 -wake_lock_in=1000:"WifiSuspend"
   +6s868ms (2) 100 +wake_lock_in=1013:"AudioMix"
   +6s875ms (2) 100 -wake_lock_in=u0a20:"show keyguard"
   +6s878ms (2) 100 -wake_lock_in=1013:"AudioMix"
   +6s878ms (2) 100 +wake_lock_in=u0a20:"AudioMix"
   +6s941ms (2) 100 +wake_lock_in=1027:"NfcService:mRoutingWakeLock"
   +6s941ms (2) 100 +wake_lock_in=u0a7:"Wakeful StateMachine: GeofencerStateMachine"
   +6s942ms (2) 100 -wake_lock_in=u0a7:"Wakeful StateMachine: GeofencerStateMachine"
   +6s943ms (2) 100 +wake_lock_in=u0a7:"GCoreFlp"
   +6s946ms (2) 100 -wake_lock_in=u0a7:"GCoreFlp"
   +6s968ms (2) 100 -wake_lock_in=1027:"NfcService:mRoutingWakeLock"
.
.
.
This contains information about how much the battery was drained during the test run, along with a detailed roster of the power-related events that occurred during the test run. The timestamps on those roster entries are relative to the first entry in the roster. Beyond that, there is little explanation of what the roster entries mean.
Next, there will be a short stanza labeled “Per-PID Stats” and, possibly, “Discharge step durations”:
Per-PID Stats:
  PID 0 wake time: +134ms
  PID 536 wake time: +1m35s993ms
  PID 0 wake time: +10s842ms
  PID 881 wake time: +301ms
  PID 536 wake time: +70ms
  PID 989 wake time: +23s167ms
  PID 1136 wake time: +2s974ms
  PID 1193 wake time: +230ms
  PID 0 wake time: +1s123ms
  PID 617 wake time: +187ms
  PID 536 wake time: +18ms
  PID 536 wake time: +13ms
  PID 627 wake time: +586ms
  PID 536 wake time: +184ms
  PID 3690 wake time: +9m42s965ms

Discharge step durations:
  #0: +4h8m36s976ms to 97 (screen-off, power-save-off)
  #1: +3h7m47s132ms to 98 (screen-off, power-save-off)
If you determine your process’ PID, you will see how long the process’ “wake time” was. The precise definition of “wake time” is undocumented.
Next may be a section entitled “Daily stats”:
Daily stats:
  Current start time: 2015-12-12-05-27-33
  Next min deadline: 2015-12-13-01-00-00
  Next max deadline: 2015-12-13-03-00-00
    Package changes:
      Update com.google.android.dialer vers=20312
      Update com.google.android.apps.cloudprint vers=113
      Update com.android.chrome vers=252608301
      Update com.google.android.marvin.talkback vers=40400003
      Update com.google.android.contacts vers=10307
      Update com.commonsware.empublite vers=1
      Update com.commonsware.android.picasso vers=1
  Daily from 2015-12-11-05-55-34 to 2015-12-12-05-27-33:
    Discharge step durations:
      #0: +4h49m4s38ms to 93 (screen-off, power-save-off, device-idle-on)
      #1: +3h53m22s969ms to 94 (screen-off, power-save-off)
      #2: +5h8m4s10ms to 95 (screen-off, power-save-off, device-idle-on)
      #3: +3h33m53s102ms to 96 (screen-off, power-save-off, device-idle-on)
        Discharge total time: 18d 3h 10m 2s 900ms  (from 4 steps)
        Discharge screen off time: 18d 3h 10m 2s 900ms  (from 4 steps)
        Discharge screen off device idle time: 18d 18h 33m 58s 300ms  (from 3 steps)
    Package changes:
      Update com.commonsware.empublite vers=1
  Daily from 2015-12-10-04-55-48 to 2015-12-11-05-55-34:
    Discharge step durations:
      #0: +5h1m15s618ms to 98 (screen-off, power-save-off, device-idle-on)
      #1: +42m34s7ms to 98 (screen-off, power-save-off, device-idle-off)
        Discharge total time: 11d 22h 31m 21s 200ms  (from 2 steps)
        Discharge screen off time: 11d 22h 31m 21s 200ms  (from 2 steps)
        Discharge screen off device idle time: 20d 22h 6m 1s 800ms  (from 1 steps)
    Package changes:
      Update com.commonsware.ct3 vers=1
      Update com.commonsware.ct3 vers=1
      Update com.commonsware.ct3 vers=1
      Update com.commonsware.ct3 vers=1
      Update com.commonsware.ct3 vers=1
      Update com.commonsware.ct3 vers=1
      Update com.commonsware.android.fsendermnc vers=1
...
This indicates, for various time slices, what apps were updated and what the “discharge step durations” are (which is undocumented).
Next up will be a “Statistics since last charge” header, with a few summary blocks of data:
Statistics since last charge:
  System starts: 0, currently on battery: false
  Time on battery: 11h 30m 29s 177ms (99.9%) realtime, 16m 13s 306ms (2.3%) uptime
  Time on battery screen off: 11h 30m 7s 940ms (99.9%) realtime, 15m 52s 69ms (2.3%) uptime
  Total run time: 11h 30m 55s 300ms realtime, 16m 39s 430ms uptime
  Start clock time: 2014-10-25-19-54-07
  Screen on: 21s 237ms (0.1%) 2x, Interactive: 20s 191ms (0.0%)
  Screen brightnesses:
    dark 21s 237ms (100.0%)
  Total partial wakelock time: 10m 22s 877ms
  Mobile total received: 0B, sent: 0B (packets received 0, sent 0)
  Phone signal levels:
    none 11h 30m 29s 177ms (100.0%) 0x
  Signal scanning time: 9s 0ms
  Radio types:
    none 11h 30m 29s 177ms (100.0%) 0x
  Mobile radio active time: 0ms (0.0%) 0x
  Wi-Fi total received: 0B, sent: 0B (packets received 0, sent 0)
  Wifi on: 11h 30m 29s 177ms (100.0%), Wifi running: 11h 30m 29s 177ms (100.0%)
  Wifi states: (no activity)
  Wifi supplicant states:
    group-handshake 16ms (0.0%) 12x
    completed 11h 30m 29s 161ms (100.0%) 12x
  Wifi signal levels:
    level(4) 11h 30m 29s 177ms (100.0%) 1x
  Bluetooth on: 0ms (0.0%)
  Bluetooth states: (no activity)

  Device battery use since last full charge
    Amount discharged (lower bound): 2
    Amount discharged (upper bound): 3
    Amount discharged while screen on: 0
    Amount discharged while screen off: 3

  Estimated power use (mAh):
    Capacity: 3448, Computed drain: 107, actual drain: 69.0-103
    Idle: 40.3
    Wifi: 36.4
    Uid u0a58: 14.8
    Uid 0: 12.8
    Uid 1000: 1.75
    Uid u0a20: 0.521
    Uid u0a7: 0.389
    Screen: 0.375
    Uid 1013: 0.0775
    Uid 1001: 0.0219
    Uid u0a42: 0.0168
    Uid u0a12: 0.0138
    Uid 1027: 0.0110
    Uid u0a5: 0.00866
    Uid u0a33: 0.00253
    Uid u0a16: 0.000867
    Uid u0a3: 0.000815
    Uid u0a29: 0.000523
    Uid u0a2: 0.000474
    Over-counted: 4.04
The first block has useful data about how much various radios
were on, how much data they transmitted, how long the screen was
on, how long the device had an outstanding partial WakeLock, etc.
Also, the “Estimated power use (mAh)” block is basically the data that underlies the “battery blame screen” in Settings. You will see how many milliamp-hours (mAh) were attributed to your process.
Next up may a summary of WakeLock events:
All kernel wake locks:
Kernel Wake lock PowerManagerService.WakeLocks: 10m 23s 46ms (717 times) realtime
Kernel Wake lock qcom_rx_wakelock: 9m 9s 836ms (1537 times) realtime
Kernel Wake lock alarm_rtc: 55s 327ms (717 times) realtime
Kernel Wake lock sns_async_ev_wakelock: 16s 525ms (9 times) realtime
Kernel Wake lock power-supply: 15s 730ms (1448 times) realtime
Kernel Wake lock event0-536: 11s 822ms (1484 times) realtime
Kernel Wake lock event2-536: 10s 686ms (1509 times) realtime
Kernel Wake lock event4-536: 10s 234ms (1509 times) realtime
Kernel Wake lock alarm: 7s 972ms (1239 times) realtime
Kernel Wake lock wlan: 1s 608ms (2 times) realtime
Kernel Wake lock PowerManagerService.Display: 611ms (2 times) realtime
Kernel Wake lock main: 608ms (0 times) realtime
Kernel Wake lock KeyEvents: 136ms (1548 times) realtime
Kernel Wake lock mmc0_detect: 38ms (1507 times) realtime
Kernel Wake lock deleted_wake_locks: 28ms (170 times) realtime
Kernel Wake lock event5-536: 20ms (2 times) realtime

All partial wake locks:
Wake lock u0a58 wake:com.commonsware.android.job/.DemoScheduledService: 9m 0s 153ms (671 times) realtime
Wake lock 1000 *alarm*: 44s 114ms (683 times) realtime
Wake lock u0a7 Checkin Service: 16s 572ms (4 times) realtime
Wake lock 1000 NetworkStats: 7s 347ms (338 times) realtime
Wake lock 1013 AudioMix: 5s 833ms (2 times) realtime
Wake lock 1000 DHCP: 4s 953ms (12 times) realtime
Wake lock u0a7 *net_scheduler*: 1s 504ms (82 times) realtime
Wake lock u0a7 Event Log Service: 1s 98ms (18 times) realtime
Wake lock u0a42 DownloadManager: 322ms (1 times) realtime
Wake lock u0a7 Config Service fetch: 235ms (1 times) realtime
Wake lock u0a7 Icing: 197ms (5 times) realtime
Wake lock u0a7 Event Log Handoff: 143ms (18 times) realtime
Wake lock u0a58 *alarm*: 120ms (24 times) realtime
Wake lock u0a7 GCM_CONN: 61ms (36 times) realtime
Wake lock u0a7 GmsDownloadService: 47ms (1 times) realtime
Wake lock u0a7 *alarm*: 42ms (10 times) realtime
Wake lock u0a7 Wakeful StateMachine: GeofencerStateMachine: 35ms (8 times) realtime
Wake lock 1000 SyncManagerHandleSyncAlarm: 34ms (6 times) realtime
Wake lock u0a7 GCM_HB_ALARM: 34ms (36 times) realtime
Wake lock u0a7 Checkin Handoff: 12ms (4 times) realtime
Wake lock 1000 SyncLoopWakeLock: 8ms (4 times) realtime
Wake lock u0a33 *alarm*: 7ms (4 times) realtime
Wake lock u0a42 *alarm*: 4ms (3 times) realtime
Wake lock u0a7 GCoreFlp: 2ms (5 times) realtime
If you do not have a separate section for these, they may be interleaved in the “Statistics since last charge:” data.
Your code will tend to show up in the “All partial wake locks”
section, showing how many WakeLocks you acquired and for
how long overall.
And, if you show up here, you can definitely find out your
app’s PID — for example, u0a58 is associated with the
com.commonsware.android.job package.
Next up may be summaries of information per process; otherwise, this information is interleaved in the “Statistics since last charge:” section. Your process will show up somewhere in the list:
.
.
.
u0a58:
  Wake lock wake:com.commonsware.android.job/.DemoScheduledService: 9m 0s 153ms partial (671 times) realtime
  Wake lock *alarm*: 120ms partial (24 times) realtime
  TOTAL wake: 9m 0s 273ms partial realtime
  Foreground activities: 7s 817ms realtime (1 times)
  Foreground for: 12s 959ms
  Active for: 3h 58m 47s 853ms
  Running for: 11h 30m 29s 177ms
  Proc com.commonsware.android.job:
    CPU: 1m 4s 370ms usr + 21s 140ms krn ; 400ms fg
  Proc *wakelock*:
    CPU: 43s 690ms usr + 1m 19s 590ms krn ; 0ms fg
  Apk com.commonsware.android.job:
    672 wakeup alarms
    Service com.commonsware.android.job.DemoScheduledService:
      Created for: 11m 14s 174ms uptime
      Starts: 647, launches: 647
.
.
.
As usual, the exact definitions of the information here is largely undocumented.
While batterystats is part of the Android 5.0+ runtime
environment, and tools like adb are part of the Android
SDK, the Battery Historian is neither. Instead, it is a
separate project that you have to download to your development
machine from its GitHub project.
The original implementation of the Battery Historian was a Python
script. This is still available as the historian.py file in that
GitHub repository, until such time as Google elects to delete it.
Battery Historian 2.0 is now a server written in the Go programming language. This requires a fair bit more work to set up, as you need to:
PATH environment variable, plus add new environment variablesThis chapter focuses on the original Python script.
Once you have downloaded that Python script, and assuming that you
have a Python interpreter installed, you can run the script, supplying it
with the output of your batterystats run, and redirecting
the script’s output to an HTML file:
python historian.py /tmp/bs.txt > /tmp/bs-report.html
You can then load that HTML into a Web browser (Chrome-flavored ones are probably
a good choice, given that it is Google-generated HTML).
This will give you a
timeline across the horizontal axis, with event categories culled from the
“Battery History” section of the batterystats output on the vertical axis:
Figure 1012: Battery Historian Timeline, Partial View
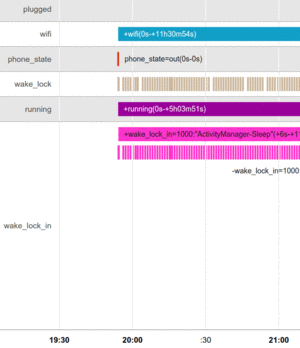
Figure 1013: Battery Historian Timeline, Additional
The length of the bar shows the approximate duration of the event, though really short events have a de minimus length to give you something to see. Hovering your mouse over one of the bars brings up a pop-up with more details about that event:
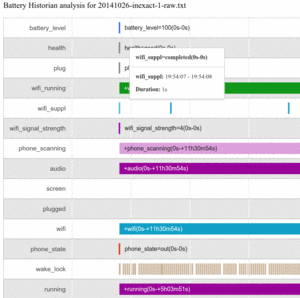
Figure 1014: Battery Historian Timeline, Partial View, with Pop-Up
If the bar is really long, you may need to scroll your browser horizontally to see the pop-up, as the rendering of the pop-up location does not seem to pay attention to the browser viewport very well.
Below the main chart is a “Zoom” field that you can use to change the scale of the horizontal axis, along with an “Event summary”:
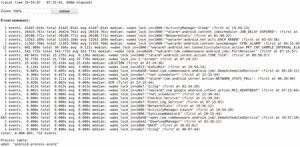
Figure 1015: Battery Historian Timeline, Zoom and “Event summary”
Again, this is largely undocumented.
Perhaps the best-known third-party power analyzer is PowerTutor. PowerTutor is the outcome of a research project from the University of Michigan, with a bit of assistance from Google. In principle, PowerTutor is capable of letting you know power consumption on a device, much along the lines of what Trepn can record on a Qualcomm MDP. In practice, PowerTutor is significantly less powerful and sophisticated.
PowerTutor was created with the HTC Dream (T-Mobile G1), HTC Magic (T-Mobile G2), and Nexus One in mind. Its power output values will be as accurate as they could make it for those devices. If you run PowerTutor on other hardware, the results will be less accurate.
You can obtain PowerTutor from the Play Store, or from the PowerTutor Web site, or you can compile it from source.
PowerTutor is not tied to testing a particular application. As such, you can simply run PowerTutor whenever you want from its launcher icon, then press “Start Power Profiler” in the main activity:

Figure 1016: The PowerTutor main activity
At this point, you can start playing with your application, or running your unit test suite, or whatever. When you want to get an idea of how much power you have been consuming, you can switch back to the PowerTutor activity and choose “View Application Power Usage”. This brings up a list of processes and toggle buttons to show various power consumption values for each:
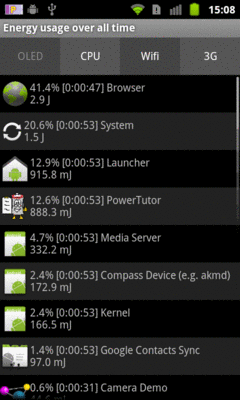
Figure 1017: The PowerTutor application roster
Tapping the list entry brings up a graph for that particular process, though since this information is only available while PowerTutor is recording new data, the graph is usually empty unless you have logic running in the background:

Figure 1018: The PowerTutor live charts for a single process current power consumption
You can also bring up a chart showing what portion of your power consumption came from various sources for the whole device, such as a pie chart of current consumption:
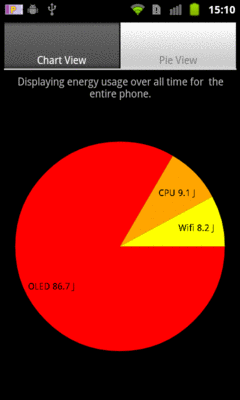
Figure 1019: The PowerTutor pie chart for current overall power consumption
Given that the source code is available, one might augment PowerTutor to:
Of course, what developers tend to focus on most with power is the battery consumption screen in the Settings application, as shown in a previous chapter:
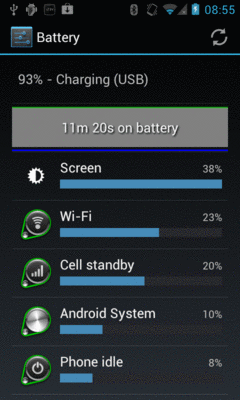
Figure 1020: Battery Screen from Settings App
After all, this is what users will tend to focus on — anything showing up in here is a source of blame for whatever power woes the user believes she is experiencing. Conversely, if your application does not show up in this screen during normal operation, then there is no compelling reason for you to do further analysis, as users will tend to be oblivious to your actual power consumption.
If you do show up in the list, tapping on your entry can give you some more details of what power you consumed and why:
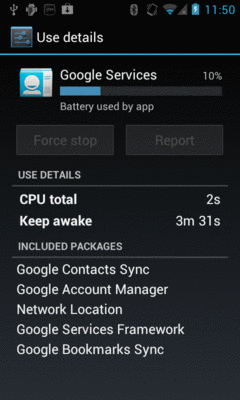
Figure 1021: Battery Details Screen from Settings App
However, the information contained in here is mostly guesswork, using a more refined version of the same approach that PowerTutor uses. Ordinary Android hardware simply lacks enough fine-grained power measurement instrumentation to do an accurate job of apportioning power usage among different processes. So, the details of how long you kept the CPU powered on may be accurate, but the percentage of battery consumption associated with your app is just an estimate.
Yet another possibility on older Android devices
is to use the adb shell dumpsys batteryinfo
command from your command prompt or terminal on your
development workstation. This will emit a fair amount of data that
probably means something to somebody, such as general device
information:
Battery History:
       -1h00m56s463ms 096 20030002 status=discharging health=good
plug=none temp=191 volt=4060 +screen +wake_lock +sensor
brightness=medium
       -1h00m52s490ms 096 22030302 +wifi phone_state=off
       -1h00m51s844ms 096 2703d102 +phone_scanning +wifi_running
phone_state=out data_conn=other
       -1h00m49s303ms 096 2743d102 +wifi_scan_lock
         -57m48s766ms 095 2743d102
         -53m24s627ms 095 2743d100 brightness=dark
         -53m17s620ms 095 0741d100 -screen -wake_lock
         -53m17s107ms 095 0740d100 -sensor
         -38m17s007ms 095 0642d100 -wifi_running +wake_lock
         -38m08s998ms 095 0640d100 -wake_lock
            -54s781ms 095 4640d100 status=full plug=usb temp=193
volt=4084 +plugged

Per-PID Stats:
  PID 96 wake time: +12s75ms
  PID 177 wake time: +1s13ms
  PID 458 wake time: +1s898ms
  PID 326 wake time: +3s925ms
  PID 205 wake time: +2s107ms
  PID 415 wake time: +843ms
  PID 96 wake time: +281ms

Statistics since last charge:
  System starts: 0, currently on battery: false
  Time on battery: 1h 0m 1s 682ms (0.3%) realtime, 8m 21s 883ms
(0.0%) uptime
  Total run time: 16d 11h 13m 34s 654ms realtime, 2h 9m 37s 404ms
uptime,
  Screen on: 7m 37s 868ms (12.7%), Input events: 0, Active phone
call: 0ms (0.0%)
  Screen brightnesses: dark 7s 7ms (1.5%), medium 7m 30s 861ms (98.5%)
  Kernel Wake lock "SMD_DS": 2s 368ms  (3 times) realtime
  Kernel Wake lock "mmc_delayed_work": 1s 210ms  (1 times) realtime
  Kernel Wake lock "SMD_RPCCALL": 56ms  (435 times) realtime
  Kernel Wake lock "power-supply": 575ms  (4 times) realtime
  Kernel Wake lock "radio-interface": 3s 1ms  (3 times) realtime
  Kernel Wake lock "ApmCommandThread": 4ms  (10 times) realtime
  Kernel Wake lock "ds2784-battery": 2s 6ms  (21 times) realtime
  Kernel Wake lock "msmfb_idle_lock": 14ms  (2273 times) realtime
  Kernel Wake lock "kgsl": 51s 482ms  (613 times) realtime
  Kernel Wake lock "rpc_read": 164ms  (272 times) realtime
  Kernel Wake lock "main": 7m 39s 708ms  (0 times) realtime
  Total received: 0B, Total sent: 0B
  Total full wakelock time: 149ms , Total partial waklock time: 31s
14ms
  Signal levels: none 59m 57s 63ms (99.9%) 1x
  Signal scanning time: 59m 57s 63ms
  Radio types: none 641ms (0.0%) 1x, other 59m 56s 973ms (99.9%) 1x
  Radio data uptime when unplugged: 0 ms
  Wifi on: 59m 57s 709ms (99.9%), Wifi running: 22m 35s 424ms
(37.6%), Bluetooth on: 0ms (0.0%)

  Device battery use since last full charge
    Amount discharged (lower bound): 0
    Amount discharged (upper bound): 1
    Amount discharged while screen on: 1
    Amount discharged while screen off: 0

(... and lots more...)
and per-process information (here, showing power used by PowerTutor itself):
#10058:
    Wake lock window: 5s 71ms window (1 times) realtime
    Proc edu.umich.PowerTutor:
      CPU: 11s 750ms usr + 4s 530ms krn
      1 proc starts
    Apk edu.umich.PowerTutor:
      Service edu.umich.PowerTutor.service.UMLoggerService:
        Created for: 4m 4s 750ms  uptime
        Starts: 1, launches: 1
In principle, one might create tools that use this output — or perhaps steal a peek at the data used by the Settings application – to create something a bit more developer-friendly.