Supervised Learning Based Detection of Malware on Android
F. Tchakounté; F. Hayata University of Ngaoundéré, Ngaoundéré, Cameroon
Abstract
This chapter aims to present a new approach for detecting Android malware by relying permissions and supervised learning techniques. For that, we present security and its flaws in the Android system. Then we present concepts around machine learning and how they can be used for malware detection in general. We discuss works using permissions as key feature for the characterization of applications to detect malicious behavior.
We present a detection system combining the proportion of requested permissions and risks induced on resources. This system requires the user to specify resources to protect and inform in an understandable way, activities performed in background with those permissions. We pass through some graphical interfaces of the implementation, then elucidate results concerning detection and prediction performance with the support of learning algorithms.
We compare these results against well-known antiviruses and related solutions on the same collected datasets of malicious and benign applications. It is revealed that our system outperforms most of them and it is able to detect zero-day malware. Therefore it constitutes an interesting step forward to help users understanding the risks induced on resources and to help them detecting malware.
Keywords
Detection; Permission; Resource; Risk; Supervised learning
Acknowledgments
The authors would like to thank the Computer Security Group of the University of Göttingen for sharing the Drebin dataset, and Zhou Y., Jiang X., for sharing the dataset of Genome Project. We acknowledge founders of VirusTotal and Contagio, who provide us samples.
Android has become the most popular open-source operating system for smartphones and tablets with an estimated market share of 70–80% (Canalys, 2013). A shipment of one billion Android devices has been forecast in 2017; over 50 billion applications have been downloaded since the first Android phone was released in 2008 (Llamas et al., 2013). The system is based on a Linux kernel and designed for Advanced RISC Machine (ARM) architectures. It includes various layers running on top of each other, with the lower ones providing services to the upper level layers. We give an overview of the architecture of Android presented in Fig. 1; existing studies (Brähler, 2015; Ehringer, 2010) give more details.
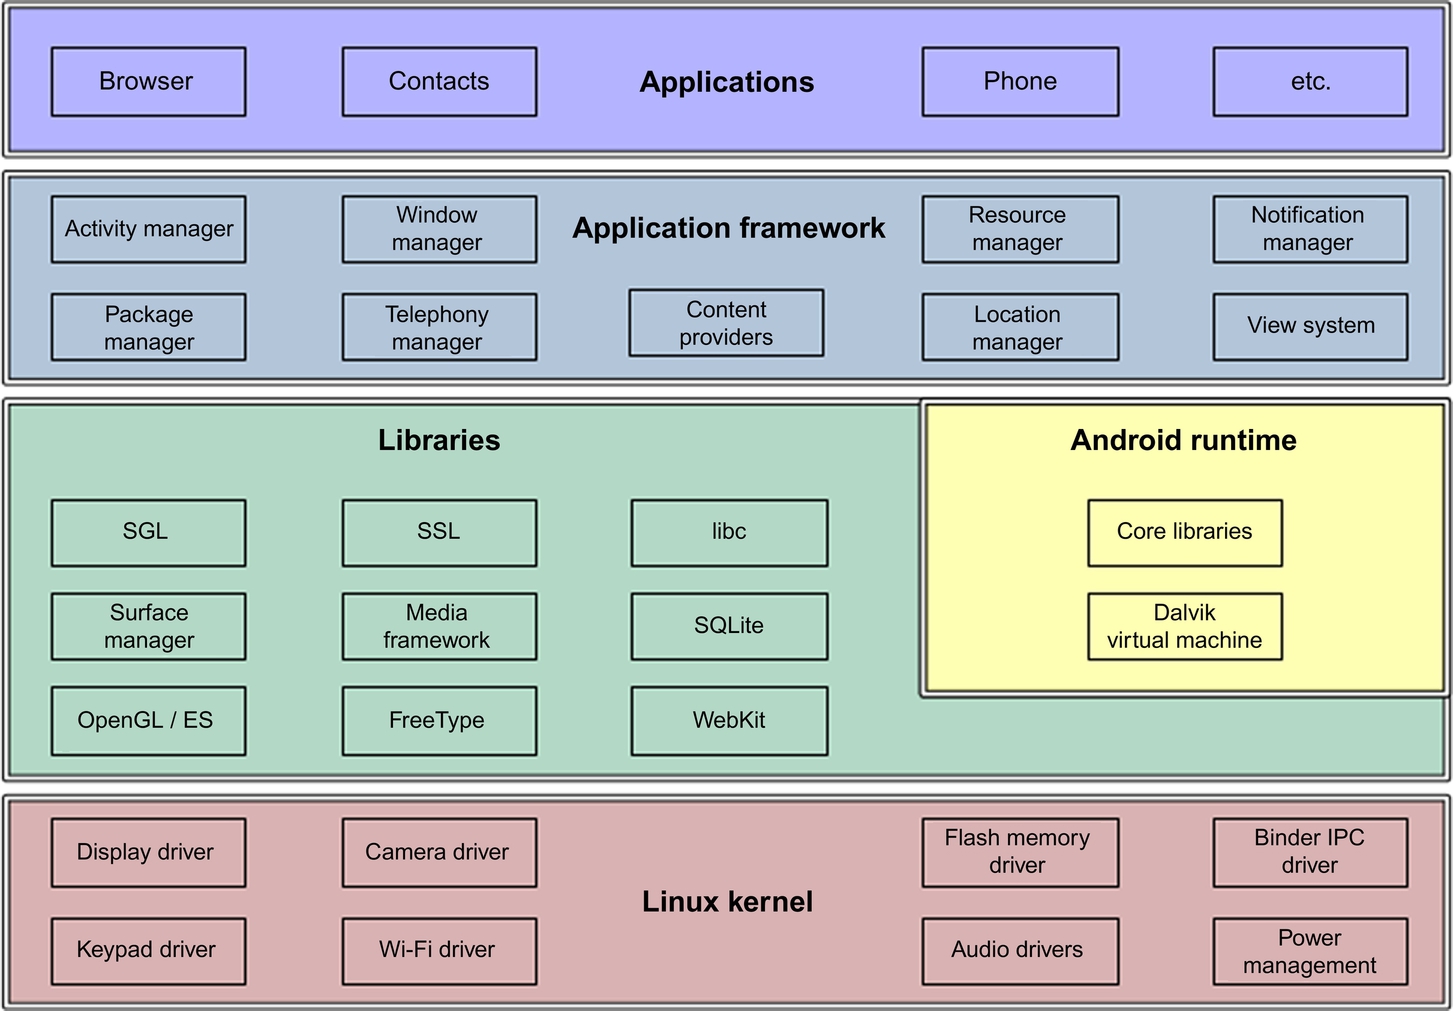
Linux Kernel Android has taken the Linux kernel code and modified it to run in an embedded environment. Thus it does not have all the features of a traditional Linux distribution.The Linux Kernel is responsible for hardware abstraction and drivers, security, file management, process management, and memory management.
Libraries A set of native C/C++ libraries is exposed to the application framework and to the Android runtime via the libraries component. It includes the Surface Manager, responsible for graphics on the device screen; 2D and 3D graphics libraries; WebKit, the web rendering engine that powers the default browser; and SQLite, the basic data store technology for the Android platform.
Android Runtime Each application runs in its own instance of the Android runtime, and the core of each instance is a Dalvik virtual machine (DVM). The DVM is a mobile-optimized virtual machine, specifically designed to run fast on the devices that Android targets. Present in this layer and in each application runtime are also the Android core libraries, such as the Android class libraries (I/O).
Application Framework The Application Framework provides high-level building blocks for applications in the form of various Android* packages. Most components in this layer are implemented as applications and run as background processes on the device.
Applications This includes applications that developers write as well as applications from Google and other Android developers.
1 Permission Background
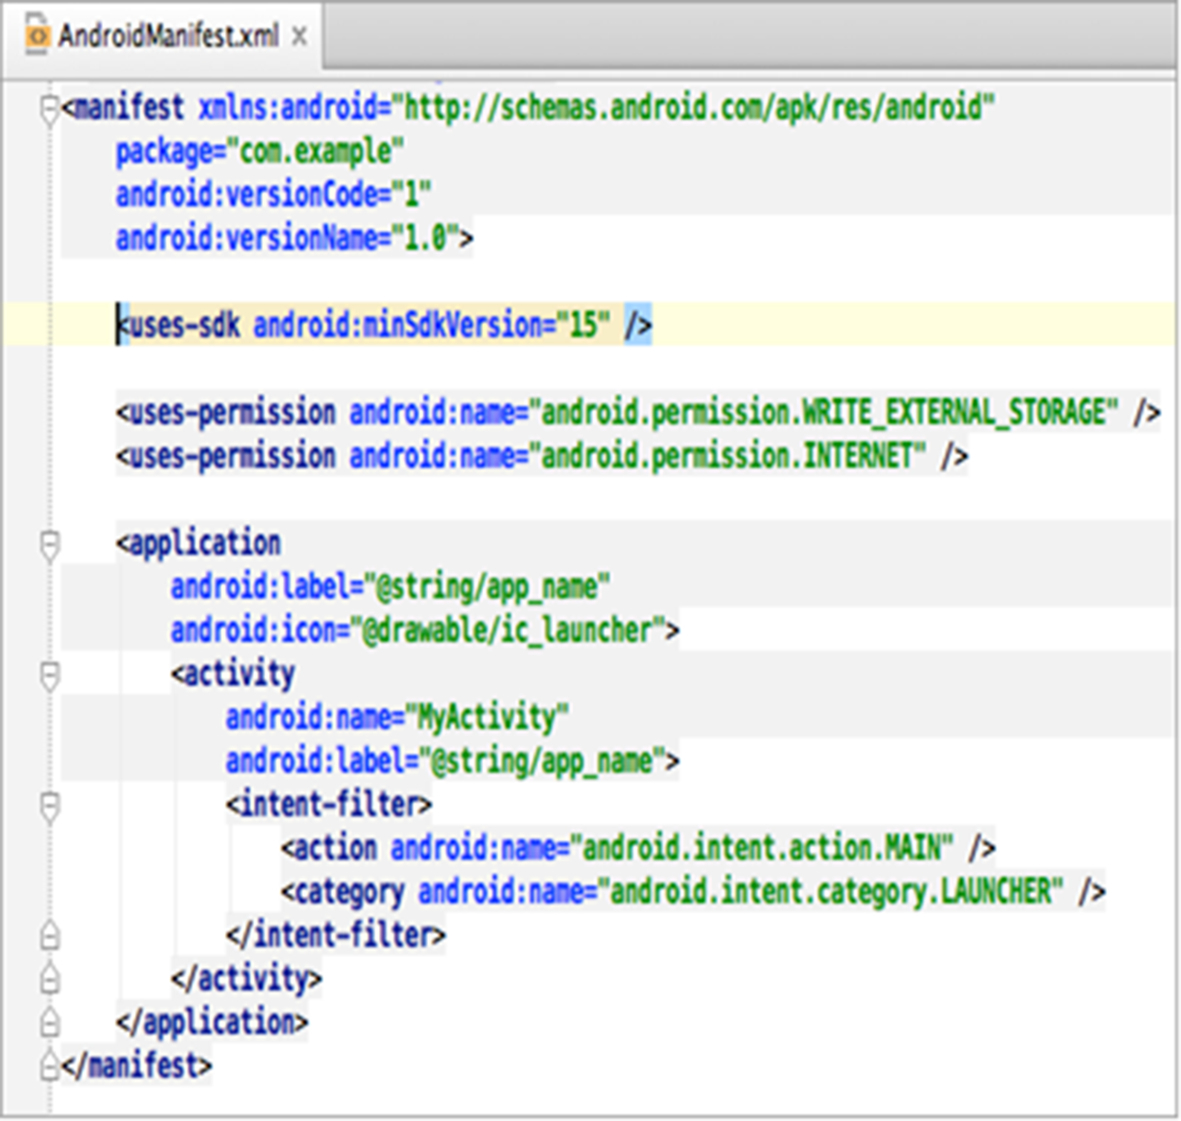
The model of security in Android is mainly based on permissions. A permission is a restriction limiting the access to a part of the code or data on a device. The limitation is imposed to protect critical data and code that could be misused to distort or damage the user’s experience. Permissions are used to allow or restrict an application access to restricted APIs and resources. The INTERNET permission, for example, is required by applications to perform network communication, so, opening a network connection is restricted by the INTERNET permission. An application must have the READ_CONTACTS permission in order to read entries in a user’s phonebook as well. The developer declares a <uses-permission> attribute to require a permission and specifies the name of the permission in the android:name field. They are both included in a file called the Android manifest or AndroidManifest.xml. This file describes the application capabilities of an application and includes the different components of the application. Fig. 2 presents two permissions: WRITE_EXTERNAL_STORAGE and INTERNET. The first one allows an application to write to external storage and the second one allows to open network sockets.
Android follows the Principle of Least Privilege (PLP) that stipulates entities having just enough privileges to do their job and no more as a prerequisite for security. For instance, if an application does not need Internet access, it should not request the Internet permission.
Table 1 describes some permissions.
Table 1
Permission Examples
| Permissions | Descriptions |
| CALL_PHONE | Allows an application to initiate a phone call without going through the dialer user interface to confirm the call being placed |
| MODIFY_PHONE_STATE | Allows modifications of the telephony state such as power on |
| WRITE_SMS | Allows an application to write SMS messages |
| READ_CONTACTS | Allows an application to read the user’s contact data |
A permission can be associated with one of the following Google Protection Levels (GPL) (Han et al., 2014):
• GPL0—Normal: A low-risk permission, which allows applications to access API calls (eg, SET_WALLPAPER) causing no harm to users.
• GPL1—Dangerous: A high-risk permission, which allows applications to access potential harmful API calls (eg, READ_CONTACTS) such as leaking private user data or control over the smartphone device. Dangerous permissions are explicitly shown to the user before an application is installed. The user must choose whether to grant a permission and to authorize whether the installation should continue.
• GPL2—Signature: A permission, which is granted if the requesting application is signed with the same certificate as the application, which defines the permission.
• GPL3—Signature-Or-System: Permissions of this type are used for certain special situations where multiple vendors have applications built into a system image and need to share specific features explicitly because they are being built together.
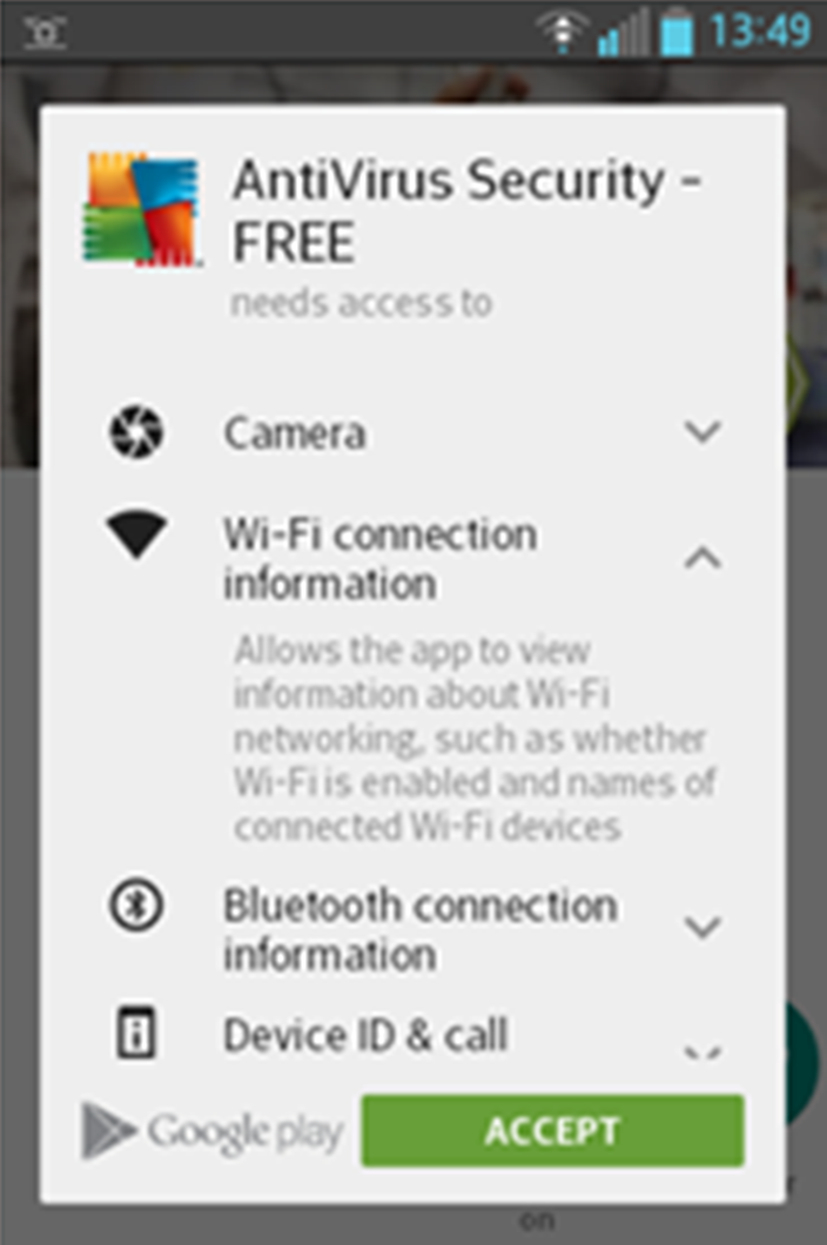
An Android application requires several permissions to work. Each application has to explicitly request permission from the user during the installation to perform certain tasks on the device, such as sending a messages. Before an application is being installed, the system prompts a list of permissions requested by the application and asks the user to confirm the installation. The user can either grant them all to install the application or refuse to install the application (as shown in Fig. 3).
1.1 Limitations of Permission Model
Android disposes several limitations and flaws, which can expose users to malicious actions, although it is the most used mobile OS. This section presents only those related to the permission system, which is the principal concern of this chapter. According to Fang et al. (2014), there are four general issues in the permission model.
1. Coarse-granularity of permissions: Most of Android permissions are coarse-grained. For instance, INTERNET permission (Barrera et al., 2010), READ_PHONE_STATE permission, and WRITE_SETTINGS permission give arbitrary accesses to certain resources (Jeon et al., 2015): INTERNET permission allows an application to send HTTP(S) requests to all domains and connect to arbitrary destinations and ports (Felt et al., 2010). The INTERNET permission therefore provides insufficient expressiveness to enforce control over the Internet accesses of the application (Barrera et al., 2010).
2. Overclaim of permissions: Overclaim of permissions is probably the most severe threat to Android security. It directly breaks the Principle of Least Privilege (PLP) (Saltzer, 1974). This violation of PLP exposes users to potential privacy leakage and financial losses. For example, if a stand-alone game application requests the SEND_SMS permission, which is unnecessary, the permission can be exploited to send premium rate messages without user’s knowledge. Developers may make wrong decisions because of several reasons, concluded by Felt et al. (2010): At first, developers tend to request permissions with names that look relevant to the functionalities they design, even if the permissions are not actually required. Second, developers may request for permissions, which should be requested by deputy applications instead of their own application. Finally, developers may make mistakes due to using copy and paste, deprecated permissions, and testing artifacts. Other issues, including coarse-granularity of permissions, incompetent permission administrators, and insufficient permission documentation, are drivers of overclaim of permissions.
3. Incompetent permission administrators: Both developers and users lack professional knowledge in the process of permission. They have sometimes conflicting interests (Han et al., 2014). A developer may not precisely know user risks, once permissions declared in the Manifest are granted. Developers might choose to simply overclaim permissions to make sure that their applications work anyway (Barrera et al., 2010), while others might take time to learn individual permissions to request them appropriately. A survey done by Felt et al. (2012) shows that only 3% of respondents (users) answered correctly having understood permissions and 24% of the laboratory study participants demonstrated competence but imperfect comprehension.
4. Insufficient permission documentation: Google provides a great deal of documentation for Android application developers, but the content on how to use permissions on the Android platform is limited (Vidas et al., 2011). The insufficient and imprecise permission information confuses Android application developers, who may write applications with guesses, assumptions, and repeated trials. This leads to defective applications, which become threats with respect to security and privacy of users (Felt et al., 2011). The content of permissions is usually too technical for users to understand. Google describes the INTERNET permission as follows: “allows an application to create network sockets” (Android, 2015). This description seems to be too complex and abstruse for the user. The user might not know exactly risks related to this permission once granted.
Google made a change to the way application permissions work that has left a potential door opened to attackers in two points Google Play Help:
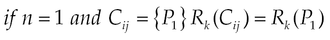
Permission’s effect hidden to the user Google defines permission groups according to resources to access and to certain objectives. The MESSAGES group contains, for instance, permissions that allow an application to send messages on behalf of the user or to intercept messages being received by the user. The application manager displays the group of resources which will be accessed after the user’s approval. The user can scroll to see details on capabilities. The problem resides in the evaluation of risks to approve, because permissions requested are hidden behind a group of resources. Let’s take for instance two categories C1 and C2 including respectively (P1: GPL normal, P2: GPL dangerous) and (P3: GPL dangerous, P4: GPL dangerous). Let’s consider also an application, A, declaring P1, P2, P3, and P4. While installing A, C1 and C2 are displayed to the user because they contain permissions of GPL dangerous. Since P1 is of GPL normal, by definition, it is not displayed. The combination of P1 with P2 can be malicious on related resources. Permissions in C1 associated with those in C2 could have negative actions on resources.
Coarse-grained approval A user will not need to review or accept permission groups already accepted for an application in the case that he has automatic updates turned on. Once a user approves an app’s permissions, he actually approves all of the permission groups. For example, if an app want to read your incoming SMS, then it requires the “Read SMS messages” permission. But now installing an app, you are actually giving it access to all SMS-related permissions. The application developer can then include additional permissions from “SMS-related permissions Group,” in a future update, which will not trigger any warning before installation. Then malicious developers can gain access to new dangerous permissions without user’s knowledge by abusing this mechanism.
2 Malware Landscape
A malicious application or malware refers to an application that can be used to compromise the operation of a device, steal data, bypass access controls, or otherwise cause damage on the host terminal. Normal or benign applications or good software are, in contrast, those that do not perform any dangerous action on the system. Android malware is malicious software on the Android platform.
2.1 Malware Techniques
Zhou and Jiang (2012) categorize existing ways used by Android malware to install on user phones and generalize them into three main social engineering-based techniques: repackaging, update attack, and drive-by download.
2.1.1 Repackaging
It is one of the most common techniques that malware authors use to piggyback malicious payloads into popular applications. In essence, malware authors may locate and download popular applications, disassemble them, enclose malicious payloads, and then reassemble and submit the new applications to Google Play and alternative markets. Users are vulnerable by being enticed to download and install these infected applications.
2.1.2 Update Attack
Malware developers insert a special upgrade component into a legitimate application allowing it to be updated to a new malicious version, which is unlike the first technique that typically piggybacks the entire malicious payloads into applications.
2.1.3 Drive-by Downloads
The ability to install and download applications outside the official marketplaces allows malware developers to mislead users into downloading and installing malicious applications. It is a class of techniques where a web page automatically starts downloading an application when a user visits it. Drive-by downloads can be combined with social engineering tactics to appear as if they are legitimate. Because the browser does not automatically install downloaded applications on Android, a malicious Website needs to encourage users to open the downloaded file for actually infecting the device with malware.
2.1.4 Remote Control
Malware authors aim to access the device during the infection phase remotely. Zhou and Jiang noted that 1.172 samples (93.0%) turn the infected phones into bots for remote control during their analysis.
2.2 Tools for Malware Detection
There exist several tools to prohibit malware to infiltrate targeted devices. To help users in the task, free and paid tools are available to them. Three tools are commonly used for this purpose in discovery, assimilation, and destruction stages: firewalls, intrusion detection systems (IDS), and antivirus software. Their common mission is to track down and to eliminate potential malicious applications.
2.2.1 Firewall
A firewall is a barrier that protects information from a device or network when establishing communication with other networks such as the Internet. Its purpose is to protect the purity of the devices on which they are installed by blocking intrusions orchestrated from the Internet. Several benefits are associated with their use. First, they are well-known solutions. Then, they are also extensively used on other platforms (PC and server). Finally, they are very effective because they take advantage of the maturity gained by firewalls on PCs. A disadvantage is, that they are ineffective against attacks on the browser, Bluetooth, e-mail, SMS, and MMS; they are used as modules in antiviruses on Android.
2.2.2 Intrusion Detection Systems
An IDS represents a set of software and hardware components whose main function is to detect abnormal or suspicious activities on the analyzed target, a network or a host. This is a family of tools of many types: IDS, host intrusion detection system (H-IDS), network intrusion detection system (NIDS), IDS hybrid, intrusion prevention system (IPS), and kernel IDS/IPS kernel (K-IDS/IPS-K). IDS has two major advantages. First, it is able to detect new attacks, even those that seem isolated. Second, it can be easily adapted to any task. Unfortunately it generates a high consumption of resources and a high false alarm rate. Andromaly (Burguera et al., 2011) and Crowdroid (Burguera et al., 2011) are examples of an IDS dedicated to detecting malware on the Android platform. Crowdroid is specifically designed to recognize Trojans.
2.2.3 Antiviruses
Antiviruses are security software relying on application traits to recognize malicious behavior. Avast, AVG, and F-Secure are examples of renowned antiviruses. They are facing new constraints brought by the growing sophisticated techniques of malicious applications. Their efficiency is closely related to their detection methods, which are classified in three families by Filiol (Filiol, 2005).
1. Form analysis is detecting the presence of a threat in an application by static characters. It can be based on research of signatures, heuristics, or spectral analysis.
(a) Research of signatures: Searches for patterns or bits, which are characteristics of a known threat. Its main disadvantage is that it is not able to detect unknown threats and known threats that are modified. It requires a permanent update of the signature database. It is simple to implement and is most often used by antivirus companies (Zhou and Jiang, 2012).
(b) Spectral analysis: Scrutinizes statements commonly used by malware samples but rare in normal applications. It analyzes the frequency of such statements statistically to detect unknown threats. This approach is subject to false positive, ie, normal applications, which are incorrectly classified as malware.
(c) Heuristic analysis: Its approach is to establish and maintain rules, which are used as a pattern to recognize malicious applications. It is also subject to false alerts, as the previous approach.
2. Integrity checking is based on the evidence that abnormal modifications of a file can reveal contamination by dangerous code. Dynamic behavior analysis is used to scrutinize the actions of an application when it is running.
3. The third method detects suspicious actions such as attempting to modify data of another application or to modify libraries and memory space reserved for the system.
The system built in this chapter uses the form analysis method.
3 Machine Learning
The rapid growth of the Android platform involves a pressing need to develop effective solutions. However, our defense capability is largely constrained by the limited understanding of the emerging malware and the lack of timely access to related samples. Moreover, Zhou and Jiang (2012) showed that malware is rapidly evolving and existing antimalware solutions are seriously becoming ineffective. For instance, it is not uncommon for Android malware to have encrypted root exploits or obfuscated C&C servers. The adoption of various sophisticated techniques greatly raises the bar for their detection. Conventional security measures relying on the analysis of security incidents and attack development inherently fail to provide a timely protection. As a consequence, users often remain unprotected over longer periods of time. The field of machine learning has been considered an ideal match for these problems, as learning methods are able to automatically analyze data, provide timely decisions, and support early detection of threats. Much work on mobile security based on this approach has produced interesting results.
3.1 Concepts
The concept of learning can be described in many ways including acquisition of new knowledge, enhancement of existing knowledge, representation of knowledge, organization of knowledge, and discovery of facts through experiments (Michalski et al., 1983). This approach can be used to acquire knowledge from malware and good software, in our case. A learning task may be considered the estimation of a function with sets of inputs and outputs. When such learning is performed with the help of computer programs, it is referred to as machine learning. A more fundamental way to distinguish machine learning is on the basis of the input type and the way in which the knowledge is used.
This division consists of learning for classification and regression, learning for acting and planning, and learning for interpretation and understanding. This work is based on the first; it is the most widely used method of learning. In this case, classification consists of assigning a new instance into one of the fixed classes from a finite set of classes. The learning scheme is presented with a set of classified examples from which it is expected to learn a way of classifying unknown instances. Regression involves the prediction of the new value on the basis of some continuous variable or attribute.
3.1.1 Dataset
A set of data items, the dataset, is a very basic concept of machine learning. A dataset is roughly equivalent to a two-dimensional spreadsheet or database table. A dataset is a collection of examples, with each instance consisting of a number of attributes.
• Training dataset: This is the sample of items or records (training items) used to determine rules to acquire knowledge for its items after the learning process.
• Testing dataset: This is a set of items or records (testing items) disjointed from the learning dataset. It is used to evaluate the capacity of the knowledge to classify unknown instances.
3.1.2 Attributes and Classes
Each instance that provides the input to machine learning is characterized by its values on a fixed, predefined set of features or attributes. The instances are the rows of the table and the attributes are the columns. They are generally in numeric (both discrete and real-value) or nominal form. Numeric attributes may have continuous numeric values, whereas nominal values may have values from a pre-defined set. The input data for a classification task are formally a collection of records. Each record, also known as an instance or example, is characterized by a tuple (x, y), where x is the attribute set and y is a special attribute, designated as the class label (also known as category, target attribute, or output). Table 2 shows a sample dataset used for classifying vertebrates into one of the following categories: mammal, bird, fish, reptile, or amphibian. The attribute set includes properties of a vertebrate such as its body temperature, skin cover, method of reproduction, ability to fly, and ability to live in water.
Table 2
Data for Classifying Vertebrates Into One of the Categories
| Name | Body Temperature | Skin Cover | Gives Birth | Aquatic Creature | Aerial Creature | Has Legs | Hibernates | Class Label |
| Human | Cold-blooded | None | No | Semi | No | Yes | Yes | Amphibian |
| Python | Cold-blooded | Scales | No | No | No | No | Yes | Reptile |
| Whale | Warm-blooded | Hair | Yes | Yes | No | No | No | Mammal |
| Salmon | Cold-blooded | Scales | No | Yes | No | No | No | Fish |
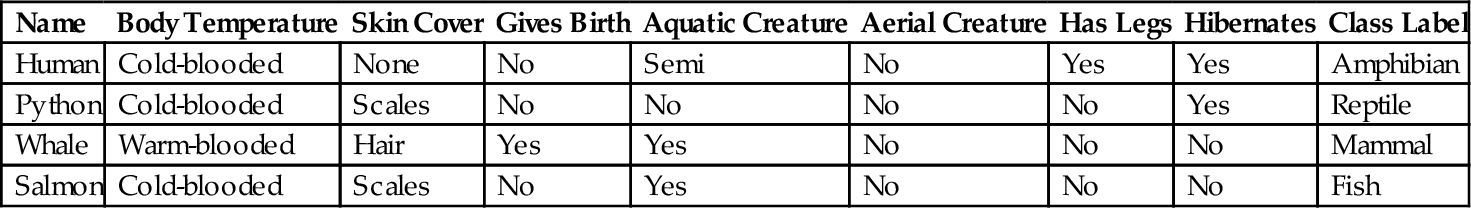
The class label, on the other hand, must be a discrete attribute. This is a key characteristic that distinguishes classification from regression, a predictive modeling task in which y is a continuous attribute.
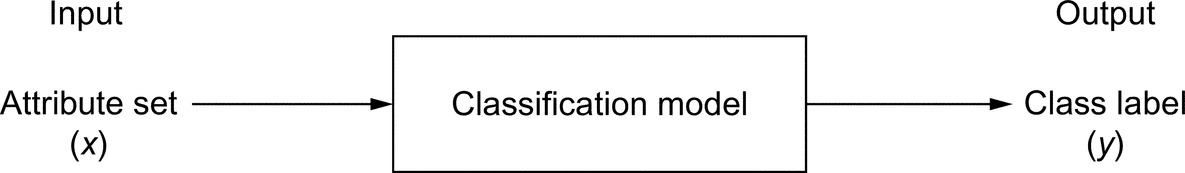
3.1.3 The Classification Model
Classification is the task of learning a target function f that maps each attribute set x to one of the predefined class labels y (Fig. 4). The target function is also informally known as a classification model.
The way in which knowledge is obtained is another important issue for machine learning. The learning element may be trained in different ways (Dietterich and Langley, 2003). For classification and regression, knowledge may be learned in a supervised, unsupervised, or semisupervised manner. Concerning supervised learning, the learner is provided with training examples with associated classes or values for the attribute to be predicted. Decision-tree and rule induction methods, neural network methods, the nearest neighbor approaches, and probabilistic methods are types of supervised learning. These methods differ in the way they represent the obtained knowledge and also in the algorithms that are used for learning. Unsupervised learning is concerned with the provision of training examples without any class association or any value for an attribute used for prediction. A third approach, which is essentially between the two described above, is that of semisupervised learning. In this type of learning, the set of training samples is mixed; that is, for some instances the associated classes are present, whereas they are absent for others. The goal in this case is to model a classifier or regression coefficient that accurately predicts and improves its behavior by using the unlabeled instances.
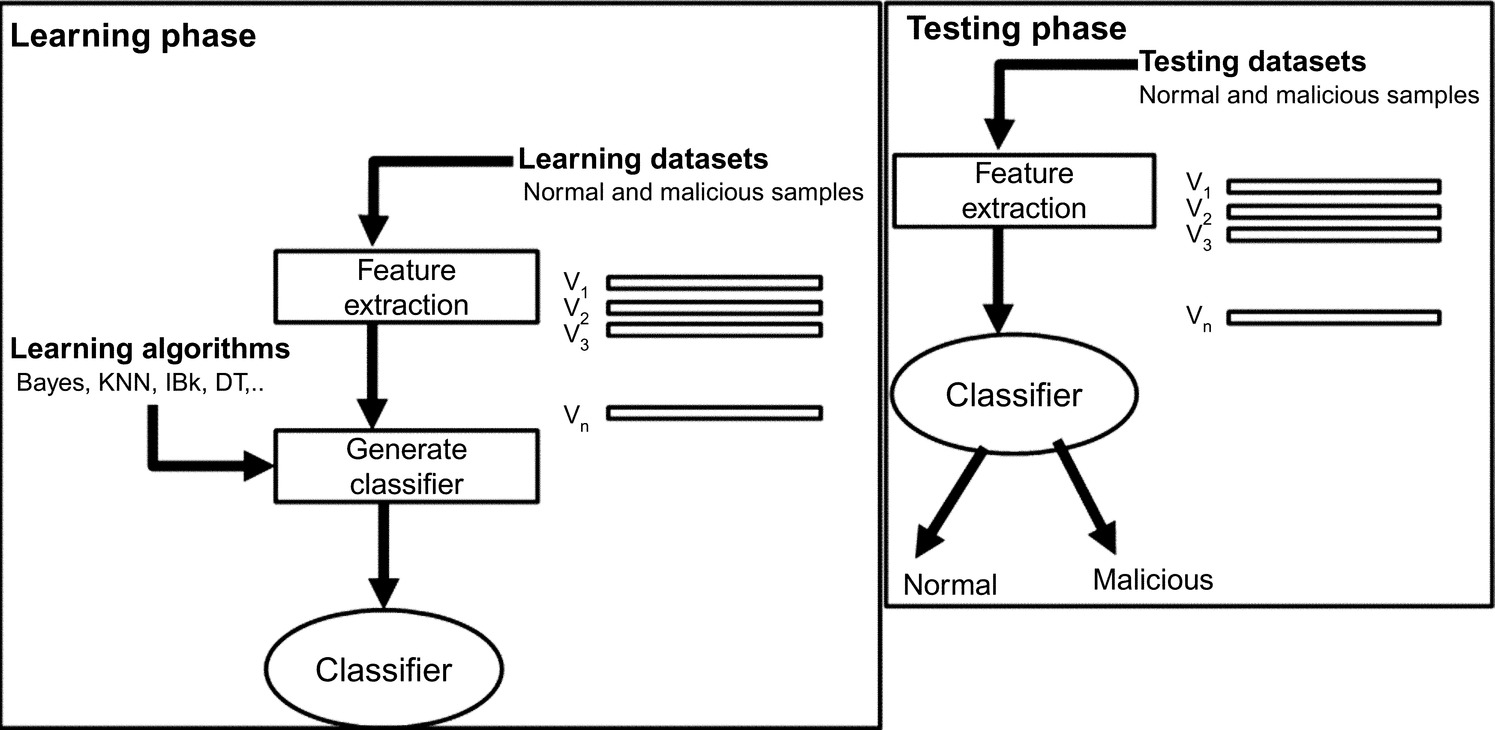
Fig. 5 illustrates the general lifecycle of the machine learning. It includes the learning phase to acquire the knowledge and the testing phase to test the capacity of the learning knowledge to predict the class of unknown samples. After the characterization of application samples into feature vectors, several learning algorithms such as Bayes, KNN, IBk, DT can be applied to generate a form of knowledge that can be used to identify the class of applications. Two major kinds of knowledge representation are used in learning: the decision tree and the classification rule. A classification rule is represented under the following form (Grzymala-Busse, 2010):
if (attribute1, value1) and (attribute2, value2) and ... and (attributen, valuen) then (decision, value).
or (attribute1, value1) δ (attribute2, value2) δ..δ(attributen, valuen)→ (decision, value).
The knowledge obtained during the learning phase can be applied to the test dataset to predict the class labels of unknown applications. It is often useful measuring the performance of the knowledge on the test dataset because such a measure provides an unbiased estimate of its generalization error.
3.1.4 Performance of Classification Models
The evaluation of the performance of a classification model is based on the counts of testing records correctly and incorrectly predicted by the model. These counts are represented in a table known as a confusion matrix (Witten et al., 2011). Table 3 depicts the confusion matrix for a binary classification problem.
Table 3
Confusion Matrix
| Predicted Class | ||
| Actual Class | Yes | No |
| Yes | True positive | False negative |
| No | False positive | True negative |
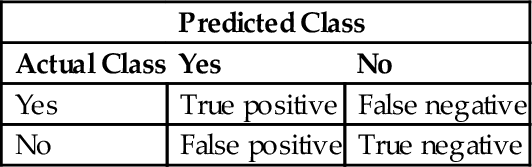
In our case, positive means malicious applications and negative means normal applications. Some metrics are based on Table 3 to determine the performance of classification models:
• True positive rate (TPR) (M1). It is the proportion of positive instances (ie, feature vectors of malicious applications) classified correctly:

where TP is the number of positive instances correctly classified and FN is the number of positive instances misclassified.
• False positive rate (FPR) (M2). It is the proportion of negative instances (ie, feature vectors of benign applications) classified incorrectly:
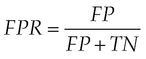
where FP is the number of negative instances incorrectly classified and TN is the number of negative instances correctly classified.
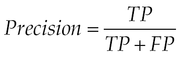
• Precision (M3). It is the number of true positives divided by the total number of elements labeled as belonging to the positive class.
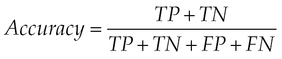
• The accuracy (M4) provides general information about how many samples are misclassified:
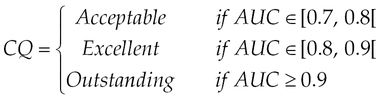
• Area under curve (AUC) (M5): This metric is the summary reflecting the classification ability. It represents the probability that a randomly chosen malicious sample will be correctly classified. The following guidelines are used to assess the classification quality (CQ) by the AUC value (Hanley and McNeil, 1982; Hosmer et al., 2013):
3.1.5 Performance Evaluation of a Classifier
Cross validation is a method commonly used to evaluate the performance of a classifier on unknown samples (Tan et al., 2005). In this method, each record is used the same number of times for training and exactly once for testing in this approach. We partition the data into two equal-sized subsets as an example. We first choose one of the subsets for training and the other for testing. We then swap the roles of the subsets so that the previous training set becomes the testing set and vice versa. This approach is called a twofold cross validation. The total error is obtained by summing up the errors for both runs. Each record is used exactly once for training and once for testing in this example. The k-fold cross validation method generalizes this approach by segmenting the data into k equal-sized partitions. One of the partitions is chosen for testing, while the rest of them are used for training during each run. This procedure is repeated k times so that each partition is used for testing exactly once. Again, the total error is found by summing up the errors for all k runs. A special case of the k-fold cross validation method sets k = N, the size of the dataset.
3.2 Related Works: Machine Learning and Permissions
We investigate and discuss related works that focuses on requested permissions and those using classification learning for the detection of malware. The strategy starts by describing works that analyze the permissions requested to make decisions on behalf of the user. We then present works that use permissions individually and associatively to characterize applications. The last point proposes enhancements on these mechanisms.
3.2.1 Permission Analysis
This section presents works that analyze the requested permissions to make decisions on behalf of the user. Holavanalli et al. (2013) propose flow permissions, an extension to the permission mechanism. It is used to examine and grant explicit information flows within an application as well as implicit information flows across multiple applications. VetDroid (Zhang et al., 2013) is a dynamic analysis platform for reconstructing sensitive behavior in applications from the permission point of view. Felt et al. (2010) evaluate whether permissions of an application are effective in protecting users. Their results indicate a positive impact of permissions on the security. They also stipulate that this mechanism should be improved. This study reveals that users are frequently granting dangerous permissions during installation. Installation security warnings at installation therefore may not be an effective prevention tool for alerting users. Felt et al. (2012) provides guidelines to determine the most appropriate granting mechanism. Rosen et al. (2013) provide an approach to inform the user about the nature of applications by mapping API calls and privacy behaviors. Barrera et al. (2010) perform an empirical analysis on the expressiveness of some permission sets and propose some potential improvements. Their work is based on the verification of signature, the assignment of the UID, and their interrelation. Grace et al. (2012) describe mechanisms by which granted permissions to one application can be leaked to another. They built Woodpecker to examine capability leaks among pre-loaded apps in the phone firmware. Dini et al. (2012a) propose a multicriteria evaluation of applications to improve the understanding the trustworthiness degree of an application, from security and functional aspects. They assign a permission threat score according to the operations controlled by this permission. They compute then a global threat score for each application, which is a function of the threat score of all the required permissions, combined to information regarding the developer, the rating, and the number of downloads of the application.
3.2.2 Individual Permissions
Zhou and Jiang (2012) characterize existing malware from various aspects, including the permissions requested. They identified the permissions that are widely requested in both malicious and benign applications. Malicious applications clearly tend to request more frequently on the SMS-related permissions, such as READ_SMS, WRITE_SMS, RECEIVE_ SMS, and SEND_SMS. The result is the same with RECEIVE_BOOT_COMPLETED and CHANGE _WIFI_STATE. Barrera et al. (2010) found no strong correlation between application categories and requested permissions and introduce a self-organizing method to visualize permission usage in different categories. Sanz et al. (2012) propose a method for categorizing Android applications through machine learning techniques. Their method extracts different feature sets including permissions. This classifies applications into several categories such as entertainment, society, tools, productivity, multimedia and video, communication, and puzzle and brain games. Orthacker et al. (2012) develop a method to circumvent the permission system by spreading permissions over two or more applications. Sato et al. (2013) is a method that analyzes the manifest by extracting four types of keyword lists: the permission, the intent filter, the process name, and the number of custom permissions. This approach determines the malignancy score by classifying individually permissions as malicious or benign.
3.2.3 Combinations of Permissions
DroidRanger (Zhou et al., 2012) is a system that characterizes and detects malware samples relying on two schemes: the first one provides footprinting based on the combination of permissions requested by known malware families; the second one is a heuristics-based filtering scheme. PermissionWatcher (Struse et al., 2012) is tool that analyzes permissions of other applications installed on the phone. They determined rules including association of permissions to classify application as suspicious. PermissionWatcher increases user awareness of potentially harmful applications through a home screen widget. Sarma et al. (2012) investigate the feasibility of using the permissions by an application, its category (such as games, education, social) and requested permissions in the same category to inform users about the risks. Rassameeroj and Tanahashi (2011) applies network virtualization and clustering algorithms to permissions. They determine irregular permission combinations requested by abnormal applications. Gomez and Neamtiu (2015) classify malicious applications into four classes of malware: DroidDream, DroidDreamLight, Zsone SMS, and Geinimi. This categorization is based on resources accessed by these four families, the infiltration technique and the payload used. Wei et al. (2012) present the nature, sources, and implications of sensitive data in an enterprise environment. They characterize malicious applications and the risks engendered. They finally propose several approaches for dealing with security risks for enterprises. Tang et al. (2011) introduce an extension of the security enforcement with a security distance model to mitigate malware. A security distance pair is the quantitative representation of the security threat that this pair of permissions may cause. A permission pair’s security distance consists of a threat point, which represents the danger level and related characteristics. Canfora et al. (2013) propose a method for detecting malware based on three metrics: the occurrences of a specific subset of system calls, a weighted sum of a subset of permissions, and a set of combinations of permissions. Kirin (Enck et al., 2009) is a system to detect malware at install time based on an undesirable combination of permissions. Su and Chang (2014) determine whether an application is malware depending on a set of permissions. They compute a score depending on the number of occurrences of each permission like in other works (Huang et al., 2013; Sanz et al., 2013a,b; Liu and Liu, 2014). Liu and Liu (2014) considers the occurrence of two permissions to reflect malicious activities. Ping et al. (2014) propose a malware detection method based on the contrasting permission patterns. They specify three subsets used for the classification: the unique permission patterns in the malware dataset, the unique permission patterns in the normal dataset, and the commonly required permission patterns.
3.2.4 Machine Learning Techniques
Machine learning has been applied in some works for malware detection. Sanz et al. (2013b) introduced a method to detect malicious applications through machine learning techniques by analyzing the extracted permissions from the application itself. Classification features include the permissions required by the application (specified by the uses-permission tag) and the elements under the uses-features group. They employed supervised learning methods to classify Android applications into malware and benign software. MAMA is a method that extracts several features from the manifest to be trained with the ML classifiers to detect malware. These features are the requested permissions, and the uses-feature tag. They used four algorithms: K-nearest neighbors, decision trees, bayesian networks, and SVM for the classification. Huang et al. (2013) explore the performance for detecting malicious applications using the classification learning with four ML algorithms: adaBoost, naïve bayes, decision tree (C4.5), and Support Vector Machine. They extracted 20 features including required and requested permissions. The values of selected features are stored as a feature vector, which is represented as a sequence of comma-separated values. Aung and Zaw (2013) propose a framework to detect malware applications and to enhance security. This system monitors various permission-based features and events obtained from the applications; it analyses these features by using ML classifiers. The features are some requested permissions, such as INTERNET, CHANGE_CONFIGURATION, WRITE_SMS, SEND_SMS, CALL_PHONE and others not described in the paper. Shabtai et al. (2010) suppose that a successful differentiation between games and tools could provide a positive indication to differentiate malware. They extracted APK features, XML features, and DEX features to be trained with Machine Learning algorithms. Arp et al. (2014) combine required permissions and requested combined to six other features. Support Vector Machine algorithms are then applied to determine profiles for malicious and benign applications. Liu and Liu (2014) extract requested permissions, pairs of requested permissions and pairs of required permissions. The machine learning techniques and permissions are used to classify an application as benign or malicious. MADAM (Dini et al., 2012b) is a system to monitor the system at the Kernel level and at the user level. It combines permission features with kernel features such as system calls, and then train the samples. Crowdroid (Burguera et al., 2011) is a framework, which collects the traces of behaviour of applications from users based on crowdsourcing. Authors applied then the partitional clustering algorithm on these traces in order to differentiate between benign applications and malicious trojan applications. Andromaly (Shabtai et al., 2012) is a type of IDS that relies on the processor, the memory and the battery states to detect suspicious activities. Su and Chang (2014) detect whether an application is malware according to the permission combinations of the application. They used two different weighted methods to adjust the weights of the permissions. These methods are essentially based on permission occurrences in both samples and the frequency gap between samples. Protsenko and Müller (2014) use randomly metrics related to software code combined to features specific application structure, to detect malware with ML algorithms. Rovelli and Vigfusson (2014) design the system PMDS (Permission-based Malware Detection System). It is a cloud-based architecture based on the requested permissions with the main feature of detecting abnormal behavior. They build a Machine Learning classifier on those features to automatically identify malicious combination of permissions. Wang et al. (2014) analyze only risks associated to individual permissions. They employ three feature ranking methods, namely, mutual information, correlation coefficient, and T-test to rank Android individual permissions with respect to their risk. They additionally use sequential forward selection as well as principal component analysis to identify risky permission subsets. Finally, they evaluate the usefulness of risky permissions for malware detection with support vector machine, decision trees, as well as random forest.
3.2.5 Limitations
The authors restrict their study to the most requested permissions or a set of permissions. The other permissions are ignored, although they could hide important information for the detection. The research works require ML techniques for the classification between benign and malicious applications. ML require a representative basis of data for training to provide a powerful tool for automatically inferring models. The quality of the detection model of such systems critically depends on the availability of representative malicious and benign applications (Arp et al., 2014). While the collection of benign applications is straightforward, gathering recent malware samples requires some technical effort. The number of features to extract from the Manifest (such as in Canfora et al. (2013) and Huang et al. (2013)) increases the computing overhead and the inefficiency of the solution. The choice of the feature to associate is relevant because its modification can give false results. Zhu et al. give acceptable results if the description is really filled by the developer; otherwise, the output could be false. This is also the case for the technique proposed by Gomez and Neamtiu (2015). It is inadequate to detect unknown malware because applications are classified using characteristics of known families of malware. Most of these works extract a feature set to represent the applications. There is no evidence to show which features give the best detection result, even if studies considers permissions as feature. The problem of usability of solutions remains urgent for the security. Many security solutions such as Flowdroid (Fritz et al., 2014; Chin et al., 2011) are harder to install even for expert users. The deployment is often not applicable in real devices, requiring installing components by command line. This fact discourages users and entices them to install risky solutions (Tchakounté and Dayang, 2013). Most of the approaches using ML classifiers are just theoretical: there is no inline system built to validate the results found. This shows eventually the difficulty of practicability of such mechanisms. Some works build the classifier inside a remote server, which receives some information necessary for the classification from the smartphone (Rovelli and Vigfusson, 2014). The server replies with the classification results to the client. Different users have different types of privacy and security concerns (Zhou and Jiang, 2012); one may need to protect their SMS while another may need to protect their contacts. Researches on permissions try to identify implicit concerns related to the user while categorizing permissions either in privacy threat, system threat, money threat (Dini et al., 2012a) or in privacy threat, monetary threat, and damage threat (Sarma et al., 2012). These views are too coarse and not resources oriented, and the user is not involved in the definition of the resources important in the smartphone.
3.2.6 Enhancements
Some efforts should be made to improve the effectiveness of permission-based solutions. For the sake of completeness, researchers should consider not only the 130 official permissions in Android, but also additional ones published in the GitHub (Android source, 2015) and third parties. The reason is to consider that a permission becomes risky when combining with others. The research should study all these permissions rather than focus on some. For sake of flexibility and performance, a detection mechanism should learn from samples historically close to the testing dataset. Older training datasets indeed cannot account for all malware lineages, and newer datasets do not contain enough representatives of most malware from the past (Allix et al., 2014). Building a reliable training dataset is essential to obtain the best performance. Authors should avoid using independent several features to construct the vector that represents an application. This could increase significant overhead, and there should be a relationship between them. None of the previous works that determine occurrences of permissions examine duplicated permissions in the Manifest. The extraction of permissions from applications should consider this possibility for the sake of precision. The percentage of permission occurrence in malware and benign software is one of the features often used by works aiming to characterize a malware sample. If a permission is required 10 times in normal applications more than in malware, this permission is not important to discriminate. The best approach should be to find a correlation between the permission frequency in malware and good software in such a way that even one presence is significant. We recommend implementing a lightweight system related to experiments. This could help to perform the testing phase. A survey on the usage could be performed to evaluate the usability in order to improve the design. There is no research work related to the permission analysis, which involve the user to give its view on what resources to be protected. This information represents the concern of the user on the security of the smartphone. A module could evaluate the risk according to this input and warn the user accordingly.
4 Characterization and Detection With the Consideration of User Security Specifications
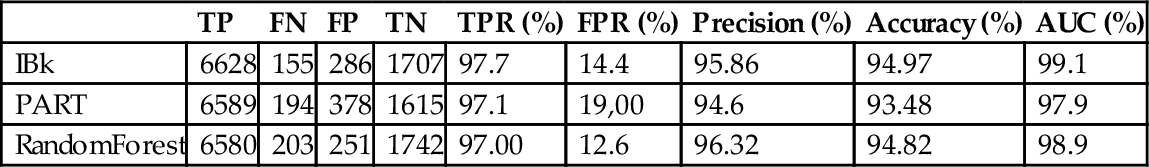
We propose a system to detect Android malware based on 222 permissions and structured in four layers, while considering limitations of related works elucidated in Section 3.2. The first layer is supported by a new model, based on the frequency of permissions and the proportion of requests by malicious applications within the whole sample. The second layer uses a model that relies on security risks related to granting permissions. The third layer uses a model that characterizes an application based on an association of vectors derived from the two first layers. The last layer involves the user to specify resources to be secured. Risk signals are generated to inform the user, depending on its specifications and the requested permissions.
We characterize applications in the first three layers using some models to translate them into vectors. For that, we collected a huge amount of normal and malicious samples.
4.1 Sampling
4.1.1 Applications for Learning Detection
We collected a dataset of 1993 normal applications from 2012 to 2015 in Google Play (2015) and VirusTotal (2015). In Google Play, we selected free ones from categories based on their descriptions, the number of downloads and the ratings given by users: only the top ones are picked. Each application taken from Google Play has been scanned by 57 engines from renowned antiviruses on VirusTotal, and only the ones that succeed all virus tests are considered “benign” and kept inside the dataset of normal applications.
The malware sample includes the dataset released by Drebin authors (Arp et al., 2014) to help the scientific community that often lacks this kind of data to carry out research. It is composed of 5560 malicious applications collected from 2010 to 2012, and includes 1260 malware samples grouped into 49 families (between August 2010 and October 2011) and released by Zhou and Jiang (2012). We additionally gather 1223 malicious applications from Contagio (2015) and VirusTotal from 2012 to 2014.
4.1.2 Applications for System Validation
Some applications constitute the dataset for evaluating and validating our security system. Normal applications have been collected from Google Play between 2013 and 2014, and the malicious ones from Contagio during the same period. According to Allix et al. (2014) learning and testing datasets must be historically coherent for good performance of the malware detection scheme; this justifies the period for the collection of the datasets.
4.1.3 Reengineering
Applications are dissembled to gather requested permissions from the manifest in a feature set. For this, it has used reengineering to investigate files included in the package of an application independently of its execution such as Android-apktool and JD-GUI. Some scripts have been developed to automate the tasks of extraction of information from applications. These scripts allow constituting the set of permissions to be scrutinize.
4.2 Layer 1
We will introduce some definitions required to define the model in this layer.
4.2.1 Definitions
Definition 1
We denote by 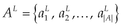 , the training dataset of malicious applications and
  , the training dataset of normal applications with |AL| and |BL| the sizes of AL and BL.
Definition 2
We denote by  the set of permissions used in the model with |Perm| the size of Perm, which constitutes permissions declared in Android GitHub (Saltzer, 1974). There are 206 permissions with complete descriptions provided. We consider 16 permissions not listed in previous sources, but only found in third party applications. Therefore |Perm| = 222. We denote P(a) the set of all different permissions found in application a. P(a) does not contain repeated elements.
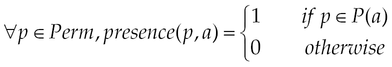
Definition 3
The function presence(p, a) of the permission p in the application a is given by:
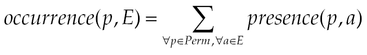
Definition 4
The function occurrence(p, E) of the permission p in the set of applications E is defined by:
Definition 5
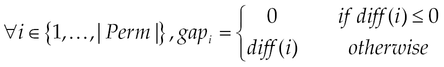
The function, gapi between the occurrences of permission i in AL and BL is given by:

Definition 6
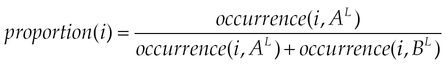
The function proportion(i) of requests of permission i by malicious applications is defined by:
Readjustment of the normal sample. We adopted a probabilistic approach to estimate probable occurrences of permissions in a sample with 6783 normal applications, since the size of the malicious sample around five times the size of the normal applications. This solution is motivated by two reasons: the 1993 normal applications are diverse (of different categories), the most downloaded and the most recommended by Google. These selection criteria guarantee that the way permissions are requested in the same proportion follows the same tendency of permission requests by other normal applications in Google Play (Vennon and Stroop, 2010).
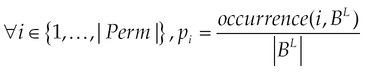
pi represents the probability of the request of the permission i. Probable occurrences of permissions in a sample of 6783 malicious applications will be estimated as follows:
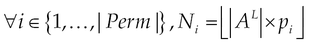
Ni is the number of occurrences predicted for the permission pi in Eq. (12).
4.2.2 Determination of Discriminating Metrics
This section describes the model which takes the requested permissions for applications and calculates their DM. The DM model is a novel approach to evaluate the popularity of a permission, and its definition includes two objectives: the first one concerns a measure that indicates the capacity for the permission to characterize malicious applications compared to normal ones. The second one is to evaluate the danger level, which may appear once the user grants this permission. The higher is the DM; more the permission is considered to be preferred by malicious applications and so it represents a high risk for devices. A question arises consequently: “From which value ε, is considered to be significant?” Two elements simultaneously guide to answer this question: |AL| and the DM’s scale. We intuitively expect a scale of 10 (from zero to nine), that is 10 measures for permissions looking for more fine grained evaluation to be effectively used to discriminate applications. We finally determine ε as follows:
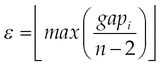
where n is the number of levels.
We dedicate the scale nine (09) to permissions in the set MalwarePermission, specifically for malware pieces, since the scale goes until nine. This is the reason why we end at eight which is the size of scale minus two. We then model the DM by combining two strategies: the first one considers the occurrences of permissions in normal and malicious and the second one considers the proportion of requests of permission in malware.
First strategy: Discriminating Metric, DM1.
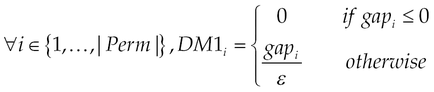
Second strategy: Discriminating Metric, DM2.
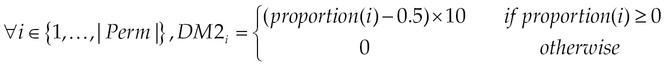
Determination of DM.

MalwarePermission is the set of permissions that are requested only by malicious applications; that is those with no presence in normal applications.
4.2.3 Translation Into Vector Space
We associate with an application A a vector V of 10 elements. The element V (i) of application A contains n(A, i), the number of permissions requested by the application A with DM equals to i. Table 4 illustrates the vector representation.

4.3 Layer 2
This model aims to identify risks induced by application actions from a point of view of accessing resources through requested permissions.
4.3.1 Risk and Category Definitions
We consider 10 categories of resources, which could intuitively be targeted by malware and risky permissions. The categories of resources are:
Messages: Users manipulate SMS and MMS messaging to communicate with each other. They could be sensitive for users if contents inside should be kept secret or should not be modified. Permissions in this category allow an application to send these resources on behalf of the user (SEND_SMS) to intercept (RECEIVE_SMS), and to read or modify messages (READ_SMS, WRITE_SMS). The permission is related to MMS: RECEIVE_MMS, which allows monitoring, recording, and processing on incoming MMS messages. If an application accesses SMS resources, there is no direct incidence on MMS resources. This is why RECEIVE_MMS is not combined with SMS permissions (Struse et al., 2012).
Contacts: Contacts could be launched without the user’s knowledge when someone has the capacity to access (private) user contacts, calls, or even messages. It is therefore fundamental to consider these resources. Permissions considered in this group are READ_CONTACTS, WRITE_CONTACTS, and MANAGE_ACCOUNTS, which respectively allow an application to read the user’s contact data, to write (but not read) them, and to manage the list of accounts in the AccountManager. We associate group accounts and contacts defined by Google separately. All combinations of the three permissions for this resource are considered.
Calls: Making calls represents one of the services mostly used on smartphones. They are associated with accessing contacts because calling requires having a phone number. Performing actions on calls without user consent could represent a privacy risk for him. Permissions investigated here are PROCESS_OUTGOING_CALLS (allowing an application to monitor, modify, or abort outgoing calls), READ_CALL_LOG (allowing an application to read the user’s call log), WRITE_CALL_LOG (allowing an application to write, but not read, the user’s contact data), CALL_PHONE (allowing an application to initiate a phone call without going through the dialer user interface, confirming the call being placed) and CALL_PRIVILEGED (allowing an application to call any phone number, including emergency numbers, without going through the dialer user interface, confirming the call being placed). Google defines a group called “telephony state,” which is not limited to call-related permissions but also to permissions associated with accessing and modifying the telephony state. Calls can be launched without manipulating telephony state. We therefore create two groups: calls and telephony state.
Telephony state: It includes MODIFY_PHONE_STATE and READ_PHONE_ STATE permissions, which respectively allow the modification of the phone state (such as power on, reboot) and allow read-only access to the phone state. All combinations are considered in this case such as MODIFY_PHONE_STATE and READ_PHONE _STA TE.
Calendar: Users save events on a calendar to be reminded later. It could be harmful for the user if one can modify user events without any consent. In this case, meetings could easily be missed or canceled. Associated permissions are READ_CALEN DAR and WRITE_CALENDAR, which respectively allow an application to read the user’s calendar data and allow an application to write, but not read it. The only association is {READ_CALENDAR, WRITE_CALENDAR}. Location: This is a resource that is used to know the current location of the device owner. The access of this resource is often granted by default; in this case, the user can be tracked physically. ACCESS_FINE_LOCATION (that allow an application to access the precise location from location sources such as GPS, cell towers, and Wi-Fi), ACCESS_COARSE_LOCATION (that allow an application to access an approximate location derived from a network location such as Wi-Fi), INSTALL_LOCATION_PRO VIDER (that allows an application to install a location provider into the Location Manager), LOCATION_HARDWARE (that allows an application to use location features in hardware). This group includes sixteen combinations.
Wi-Fi: Google defines a group network used for permissions that provide access to networking services. We decide to create a group for Wi-Fi and Bluetooth network resources independently to detect effectively which network is frequently used by applications. This resource is mainly used for mobile data communication; if one can take the control of it, sensitive data can be transferred (from/to) the device without the user’s knowledge. Permissions are: ACCESS_WIFI_STATE (that allows applications to access information about Wi-Fi networks), and CHANGE_WIFI_STATE (that allows applications to change the Wi-Fi connectivity state). We add moreover CHANGE_WIFI_MULTICAST_STATE permission taken from the group AFFECTS _BATTERY defined by Google to complete the present group because it allows changing a property of the Wi-Fi resource. It allows specifically applications to enter the Wi-Fi Multicast mode connectivity state; the battery consumption is big in this case.
Bluetooth: This is a technology that lets your phone communicate without wire over short distances; it is similar to Wi-Fi in many ways. While it is not a danger to your phone, it does enable an application to send and receive data from other devices. Permissions are BLUETOOTH (that allows applications to connect to paired Bluetooth devices), and BLUETOOTH_ADMIN (that allows applications to discover and pair of Bluetooth devices). The only combination is {BLUETOOTH, BLUETOOTH_ADMIN}.
Network: This information concerns network socket states (open or closed) and the connectivity state (on or off). It is crucial for accessing a remote server via Internet sending retrieved sensitive data from a smartphone. Permissions included are: CHANGE_NETWORK_STATE (that allows applications to change the network connectivity state), ACCESS_NETWORK_STATE (that allows applications to access information about network connectivity), and INTERNET (that allows applications to open network sockets).
Web Traces: Users usually save sensitive information (password, login, and banking codes) consciously when browsing across the Internet. Malicious applications try to gather this resource. Permissions included are WRITE_ HISTORY_BOOKMARKS (that allows an application to write, but not read, the user’s sensitive data) and READ_HISTORY_BOOKMARKS (that allow an application to read (but not write) the user’s browsing history and bookmarks).
A category of permissions includes several permissions and the possible distinct combinations made from these permissions, as depicted in Appendix A. For instance, the category contacts has permissions READ_CONTACTS, WRITE_CONTACTS, MANAGE_ACCOUNTS, READ_CONTACTS & WRITE_CONTACTS, READ_ CONTACTS & MANAGE_ACCOUNTS, MANAGE_ACCOUNTS & WRITE_CONTACTS, READ _CONTACTS & WRITE_ CONTACTS & MANAGE_ACCOUNTS.
We define permission risks as follows:
Risk1(R1): The capability given by a permission to an application to directly read confidential information in the device. It is equal to one for the positive case and zero otherwise.
Risk2(R2): The capability given by a permission to an application to directly modify user resources in the device. It is equal to one for the positive case and zero otherwise.
Risk3(R3): The capability given by a permission to an application to perform some actions without knowledge of the user. It is equal to one for the positive case and zero otherwise.
Risk4(R4): The capability given by a permission to an application to charge the user without any consent. It is equal to one for the positive case and zero otherwise.
The risk generated by a combination Cij of permissions j, in the category i is defined by:
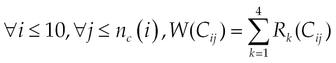

nc(i) represents the number of combinations for the resource i and OR is the logical function OR(x, y) = max(x, y).
In other words, the overall risk incurred in a category is the sum of individual risks generated by each combination of permission, in other words. Appendix A presents the whole different risks in categories of resources.
4.3.2 Translation Into Vector Space
The process to construct the vector profile is described by Algorithm 1:
Algorithm 1
Construction of the Vector
Input:
• An application a
• Cij: set of combinations i belonging to resource j
Output: The Vector V associated to a
Variables: S = / ', the set of weight values
Begin
For resource j do
For Cij of resource j do
if presence(Cij, a) then

else 
end if
End For
V (j) = Maximum(S)
S = / Ø
End For
End
Let’s consider an application with the following permissions:
• READ_PHONE_STATE;
• RECEIVE_BOOT_COMPLETED;
• WRITE_EXTERNAL_STORAGE;
• ACCESS_NETWORK_STATE;
• INTERNET.
We obtain the following results after applying the process in Table 5:

Resource 1: Cij has no SMS/MMS permissions. S = 01…016, V (1) = MAX(S) = 0
Resource 2: S = 01...07, V (2) = MAX(S) = 0
Resource 3: S = 01...032, V (3) = MAX(S) = 0
Resource 4: S = 01...04, V (4) = MAX(S) = 0
Resource 5: S = 01...015, V (5) = MAX(S) = 0
Resource 6: Cij = C16, S = 11, 02...015, V (6) = MAX(S) = 1
Resource 7: S = 01...03, V (7) = MAX(S) = 0
Resource 8: Cij = C18, C28, C48, S = 21, 12, 03, 34, 05, 06, 07, 08, 09, 010V (8) = MAX(S) = 3
Resource 9: Cij = C29, S = 01, 12, 03V (9) = MAX(S) = 1
Resource 10: S = 01, 02, 03V (10) = MAX(S) = 0
The vector resultant is consigned in Table 5.
4.4 Layer 3
An application A is represented in this model as the association of the two vectors from the first two layers. That means that the vector is represented as in Table 6 where the first layer determines the first 10 features and the second layer the last 10. We then associate the two to obtain the vector characteristics for an application in this model.

4.5 Preliminary Learning
We perform a preliminary learning to identify algorithms that best fit for the samples. According to Fig. 5, the next step is the selection of learning algorithms, since we already have the samples and we already know the how to characterize applications. There are two reasons for that:
• The only possibility to compare algorithms is to apply several ones to samples and to retrieve best classification results.
• We would like to represent each of the learning approaches: divide and conquer (Suh, 2011), separate and conquer (Suh, 2011), Bayesian networks (Pearl, 1982), support vector machines (Vapnik, 2000), ensemble methods (Freund and Schapire, 1996), and K-nearest neighbors (Fix and Hodges, 1952).
We select seven algorithms: NaiveBayes (Kohavi, 1996), LibSVM (Vapnik, 2000), IBk (Fix and Hodges, 1952), AdaBoost M1 (Freund and Schapire, 1996), PART (Frank and Witten, 1998), J48 (Quinlan, 1993), and RandomForest (Breiman, 2001). They are available in Weka 3, a collection of machine learning algorithms for data mining tasks, to classify benign and malicious applications due to its simplicity and user-friendly interface.
Table 7 summarizes statistics concerning the preliminary evaluation of the models during the learning phase. For that, every model learns the whole dataset with seven classifiers to gather the capability of recognizing the class of a known application.
Table 7
Results of Classification
| Classifier | TP Rate | FP Rate | Precision | Recall | F-Measure | AUC | |
| Layer 1 | NaiveBayes | 0.828 | 0.139 | 0.871 | 0.828 | 0.839 | 0.904 |
| LibSVm | 0.9 | 0.231 | 0.897 | 0.9 | 0.897 | 0.834 | |
| IBk | 0.926 | 0.122 | 0.927 | 0.926 | 0.926 | 0.979 | |
| AdaBoostM 1 | 0.875 | 0.28 | 0.871 | 0.875 | 0.872 | 0.928 | |
| PART | 0.911 | 0.164 | 0.911 | 0.911 | 0.911 | 0.963 | |
| J48 | 0.911 | 0.15 | 0.912 | 0.911 | 0.912 | 0.946 | |
| RandomForest | 0.924 | 0.119 | 0.926 | 0.924 | 0.925 | 0.977 | |
| Layer 2 | NaiveBayes | 0.842 | 0.347 | 0.835 | 0.842 | 0.837 | 0.858 |
| LibSVm | 0.884 | 0.309 | 0.886 | 0.884 | 0.877 | 0.787 | |
| IBk | 0.895 | 0.275 | 0.892 | 0.895 | 0.89 | 0.941 | |
| AdaBoostM1 | 0.86 | 0.366 | 0.853 | 0.86 | 0.851 | 0.885 | |
| PART | 0.888 | 0.285 | 0.884 | 0.888 | 0.883 | 0.927 | |
| J48 | 0.885 | 0.296 | 0.882 | 0.885 | 0.88 | 0.899 | |
| RandomForest | 0.894 | 0.275 | 0.891 | 0.894 | 0.889 | 0.94 | |
| Layer 3 | NaiveBayes | 0.806 | 0.14 | 0.864 | 0.806 | 0.819 | 0.892 |
| LibSVm | 0.912 | 0.209 | 0.91 | 0.912 | 0.911 | 0.852 | |
| IBk | 0.95 | 0.116 | 0.949 | 0.95 | 0.949 | 0.991 | |
| AdaBoostM1 | 0.879 | 0.272 | 0.875 | 0.879 | 0.876 | 0.932 | |
| PART | 0.935 | 0.153 | 0.934 | 0.935 | 0.934 | 0.979 | |
| J48 | 0.926 | 0.168 | 0.925 | 0.926 | 0.925 | 0.957 | |
| RandomForest | 0.948 | 0.104 | 0.948 | 0.948 | 0.948 | 0.989 |
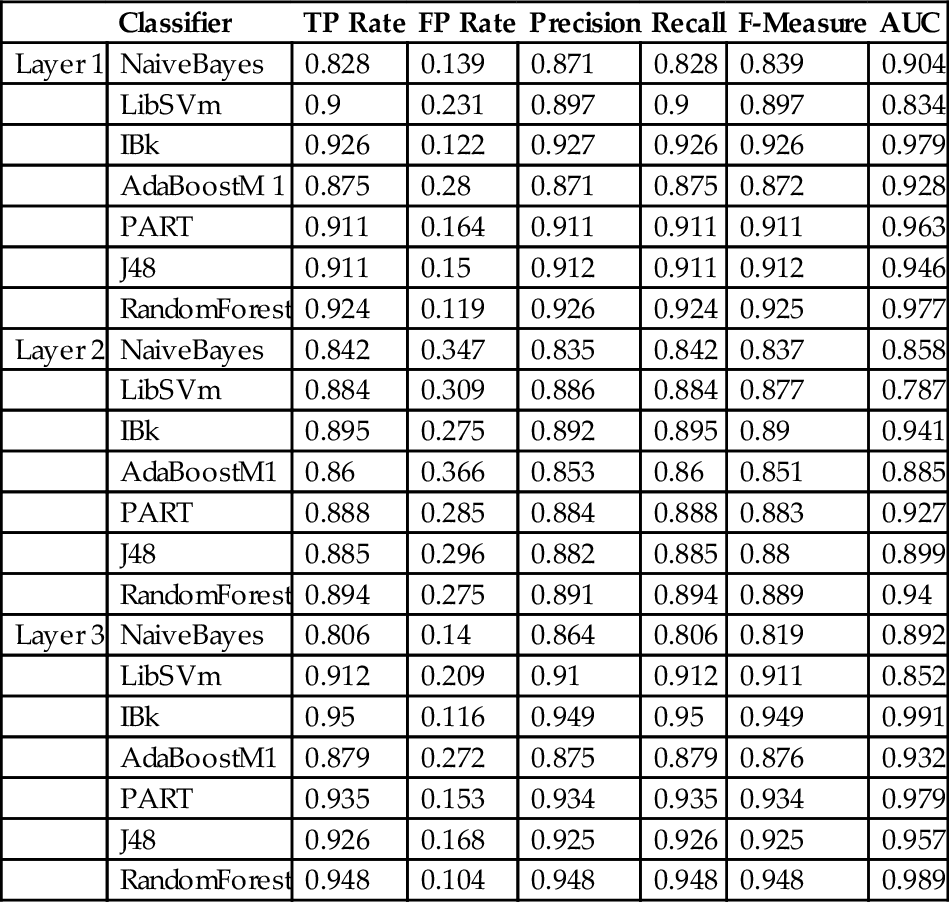
It is clearly shown that the best classifiers are IBk, RandomForest, and PART for the three layers. The first layer assimilates with a precision of around 92% and with an AUC, which tends to 98% with these classifiers. Layer 2 is less precise with around 89%; the AUC decreased to 94%. Layer 3 is more accurate with around 95% and with an AUC nearer to 1. All models are excellently able to assimilate profiles for normal and malicious applications according to these results, because they have an AUC greater than 90% (Hosmer et al., 2013). The third layer is almost perfect while assimilating application patterns. A testing and validation phase should, however, be done using cross validation; an implemented system is needed to confirm the performance in each layer. It is developed in the next chapter.
All models are complementary and can be combined to classify an application. The question now is which classification algorithm should be applied when an unknown application is assigned as normal or malicious.
4.6 Extracted Rules
The detection of malware with different characteristics is a big challenge. We are motivated to detect malware with varied characteristics with a set of detection rules extracted from the permission sets. The determination of characteristics is already effective (Sections 4.2, 4.3, and 4.4). We apply learning algorithms to extract rules based on these characteristics. RandomForest provides the best performance according to results shown in Table 7. However, this learning algorithm combines a set of independently learned decision trees and cannot construct explicit rules. It is the same for IBk. On the contrary, PART provides explicit rules that can be used for detection.
The first layer includes 71 decision rules constructed with the 222 permissions using all the learning dataset composed of the whole benign and malicious samples. Each rule has a condition as a conjunction of attribute values and a consequence as a class label. The class label is either normal or malicious in our case. Note that in a rule the conjunction of attribute values forms a sufficient condition for detecting malware, but not a necessary condition. In this layer, attributes correspond to DM values. As an example, detection Rules 1 and 5 are depicted as
In the previous excerpt, Rule 1 indicates a normal application and Rule 5 describes a malicious characteristic. The Rule 1 can be interpreted as follows. An application is considered as malware if it has the corresponding profile: It requests at least one permission belonging to a DM equals to 8 and with at most five permissions with a DM equals to zero and at least one permission with DM equals to six and with at most one permission with a DM equals to four and at most four permissions with DM equals to one.
The second layer consists of 53 decision rules. Note that in a rule the conjunction of attribute values forms a sufficient condition for detecting malware, but not a necessary condition. In this layer, the attributes correspond to risk values associated to resource accessed. As an example, detection Rules 28 and 49 are depicted as
In the previous excerpt, Rule 49 indicates a normal application and Rule 28 profiles a malicious application. The Rule 28 can be interpreted as follows. An application with the following profile is to be considered as a malware: application requests permissions inducing a risk concerning calls greater than one, a risk concerning telephony greater than zero, a risk concerning Wi-Fi resource at most equals to one, risk concerning message resources at most equals to three, a risk concerning location resources at least equals to zero, and no risk concerning web trace resources.
The third layer consists of 128 decision rules. As an example, detection Rule 1 is depicted as:
Rule 1 combines attributes from Layers 1 and 2. This rule can be interpreted as follows. An application is considered as a malware sample in Layer 3 if it requests at least two permissions with DM equals to three, at most three permissions with DM equals to zero, at least one permission with DM equals to four; and it requests permissions inducing risks concerning message and telephony at least equal to zero, and risk concerning network greater than one.
4.7 Classifier
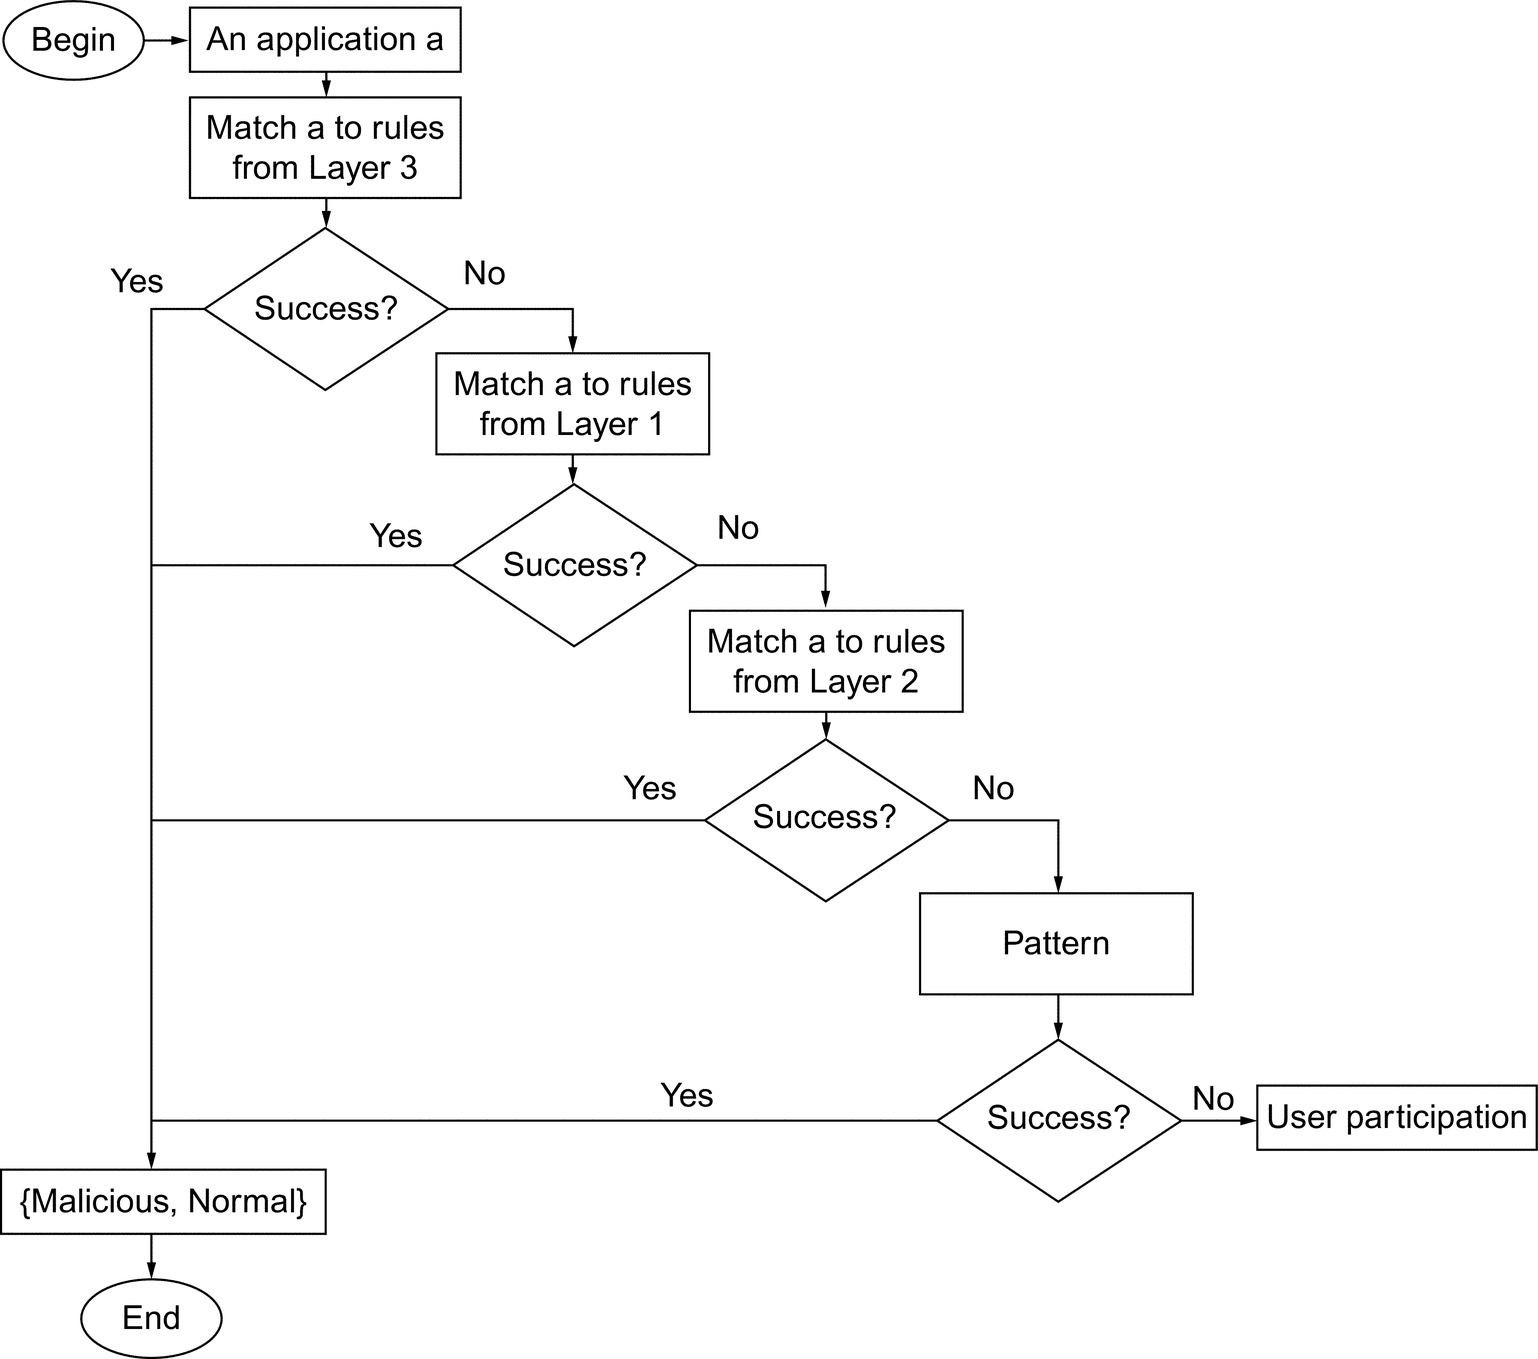
An experiment has been conducted to study different possibilities to associate the models of the different layers. As presented in Fig. 6, the procedure includes two steps.
Step 1. Selection of the association that minimizes FPR and FNR. In case the number of FP and FN remains the same, complete Step 2. The objective here is to investigate whether a misclassified application in a model can be truly classified in a different one. As we have three models, there are six associations possible to check:
• Model 1–Model 2–Model 3: Taken misclassified applications in Model 1; transfer them to Model 2 to determine if they get well classified; if not then they are transferred to Model 3 for the same purpose.
• Model 1–Model 3–Model 2: Taken misclassified applications in Model 1; transfer them to Model 3 to determine if they get well classified; if not then they are transferred to Model 2 for the same purpose.
• Model 2–Model 1–Model 3: Taken misclassified applications in Model 2; transfer them to Model 1 to determine if they get well classified; if not then they are transferred to Model 3 for the same purpose.
• Model 2–Model 3–Model 1: Taken misclassified applications in Model 2; transfer them to Model 3 to determine if they get well classified; if not then they are transferred to Model 1 for the same purpose.
• Model 3–Model 1–Model 2: Taken misclassified applications in Model 3; transfer them to Model 1 to determine if they get well classified; if not then they are transferred to Model 2 for the same purpose.
• Model 3–Model 2–Model 1: Taken misclassified applications in Model 3; transfer them to Model 2 to determine if they get well classified; if not then they are transferred to Model 1 for the same purpose.
Six possible association sets are obtained, and they provide the same outputs GoodClassifiedPositive and GoodClassifiedNegative after applying Algorithm 1. The second step is therefore performed.
Algorithm 2
Selection of the Association
Input: M = model1, model2, model3
Output:
• GoodClassifiedPositive: applications misclassified as malware at the beginning but finally classified as normal
• GoodClassifiedNegative: applications misclassified as normal at the beginning but finally classified as malware
Variables:
• fp′ = fn′ = ∅
• fpi: Set of applications belonging to FP for the model i
• fni: Set of applications belonging to FN for the model i
Begin
For m in M do

FalsePositive = fpm
FalseNegative = fnm
For n in M do

FalsePositive = fp′

FalseNegative = fn′
End For
GoodClassifiedPositive, GoodClassifiedNegative = ∅
End For
End
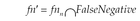
Step 2. Selection of the model with the best precision. Model 3 has the best precision (around 0.94 of AUC), as shown in Table 8; Model 1 follows with around 0.92 of AUC.
Table 8
Detection Results Obtained With the Known Dataset
| TP | FN | FP | TN | TPR (%) | FPR (%) | Precision (%) | Accuracy (%) | AUC (%) | |
| IBk | 6628 | 155 | 286 | 1707 | 97.7 | 14.4 | 95.86 | 94.97 | 99.1 |
| PART | 6589 | 194 | 378 | 1615 | 97.1 | 19,00 | 94.6 | 93.48 | 97.9 |
| RandomForest | 6580 | 203 | 251 | 1742 | 97.00 | 12.6 | 96.32 | 94.82 | 98.9 |
The selected association is therefore Model 3—Model 1—Model 2. The whole classifier for the classification of an unknown application, app, requires sequentially three phases:
• Phase 1: Apply Model 3 to app. Classify the application within this model. If app is found as malware, we believe it is malware. If app is classified as normal, we believe it is normal. In these cases, the classifier sends the results to the displaying module. If app has a profile that is not found within the rules defined in the model, then the classifier checks it in Model 1.
• Phase 2: Apply Model 1 to app. Classify the application within this model. If app is found as malware, we believe it is malware. If app is classified as normal, we believe it is normal. In these cases, the classifier sends the results to the displaying module. If app has a profile that is not found within rules defined in the model, then the classifier checks it in Model 2.
• Phase 3: Apply Model 2 to app. Classify the application within this model. If app is found as malware, we believe it is malware. If app is classified as normal in the first two steps, we believe it is normal. In these cases, then the classifier sends the results to the displaying module. If app has a profile that is not found within the rules defined in the model, the classifier checks if app matches the rule if the Manifest file declared only one system permission and if it is READ_LOGS, INSTALL_PACKAGES, or READ_USER_DICTIONARY, then the application is malicious. The classifier will transfer it to the user participation module defined in the next section if app does not match with any permission pattern until this step.
4.8 User Participation
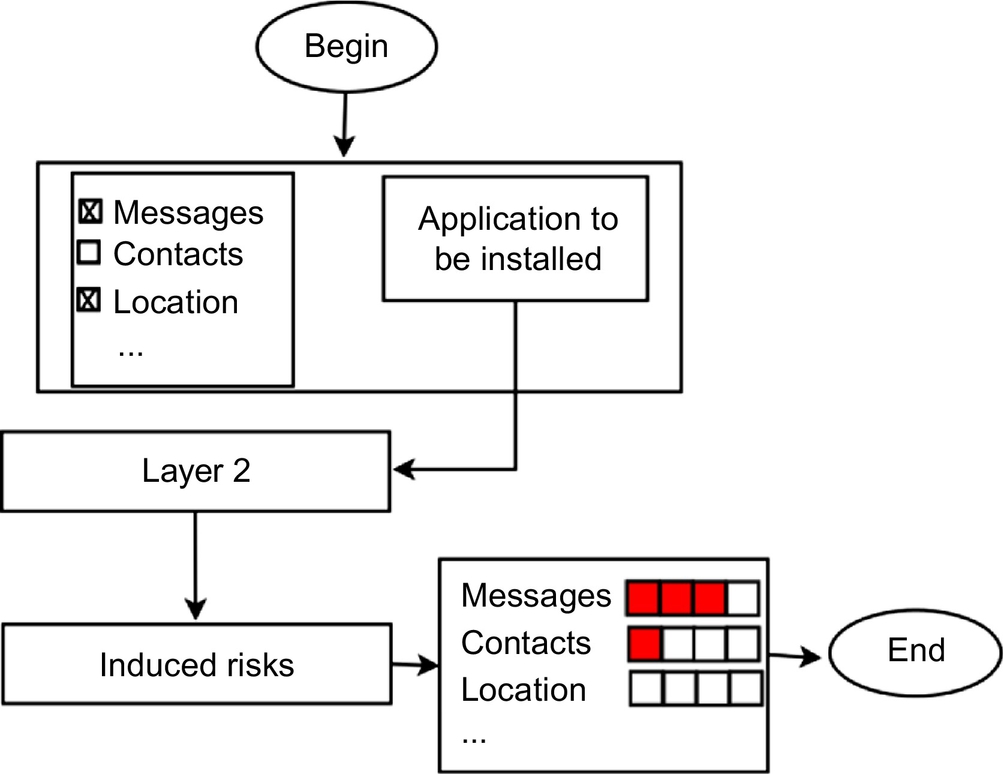
This module receives applications, which do not succeed in the classification process (Fig. 7). The only possibility is to require user to express their security points of view and define which resources have to be considered as sensitive and then to be protected. The module retrieves the permission requested by the application according to this information and computes the features of Model 2. Depending on the result, the modules define the types of alerts to display to the user and sends them to the displaying module.
The type of alerts depends on the resources selected by the user and the answer to the question determined with the help of Model 2: Does the application fit the user’s security requirements?
The following resources are displayed to the user with descriptions:
• Contact: User contacts.
• Agenda: User events and meetings.
• Call: Information related to user calls: caller contact, callee contact, etc.
• Location: The user’s geographic position at any time.
• Telephony state: It includes resources used to track the user with his current location, his unique device ID, and his phone number. They are accessed to modify the phone state in order to shut down the device or to intercept outgoing calls.
• Network: It includes resources accessed to use the Internet. They are also requested by an application to take user information to the Internet or to transfer sensitive information from the Internet to the user device. Therefore, user information can be leaked without his/her knowledge.
• Bluetooth: It includes resources manipulated in a user’s open Bluetooth network to take information to a nearby mobile device or to transfer sensitive information from a nearer mobile device to the device. Therefore, user information can be leaked without his/her knowledge.
• Wi-Fi: It includes resources, which open the communication to the Internet or to a remote device via Wi-Fi. Therefore, user information can be leaked without his/her knowledge.
• Information for browsing: It is information saved by the user like passwords, logins, banking codes, online payment codes, etc. when browsing in the Internet.
By default, all the resources are selected. Additionally, clear descriptions of possible activities with requested permissions are presented; after that the user selects the resources to protect. For that, it is scaled results within the interval (Canalys, 2013; Ehringer, 2010) to emphasize security risks linked to the intention of the application compared to the requirement specified by the user. There are actions that the user can apply on the application: To uninstall, remove the application, display application details, etc.
5 Implementation
We have proceeded to the implementation after designing the whole system. We used the Android Studio, the official Integrated Development Environment (IDE) for Android developers, to build the system Android studio. It is conventionally named “Look at your Resources and Detect Android Malware” (LaReDAMoid) and it includes five interrelated modules, as presented in Fig. 8.
The module of retrieving is used to extract and list user applications. The module of analysis is responsible for characterizing, scanning, and classifying applications coming from the module of retrieving. It includes selective analysis, in which the user scans some applications, and complete analysis, in which the user scans all the installed applications. The module of automatic analysis listens and intercepts installations and updates to renew the characterizations of applications; then it calls the module of analysis and notifies the user about the results. The module of preferences is used to define settings such as specifying resources to protect and activate automatic analysis. The module of interpretation and presentation of results is responsible to interpret results from the modules of analysis and preferences and to present them in comprehensible manner to the user.
LaReDAMoid deals with update vulnerability. It reclassifies the application while considering new permissions included in the modified version to inform the user.
5.1 Interfaces
This section presents some interfaces LaReDAMoid. Fig. 9 represents a screenshot, which depicts a list of user applications. This interface appears after clicking on the List Apps button on the home screen in Fig. 10.
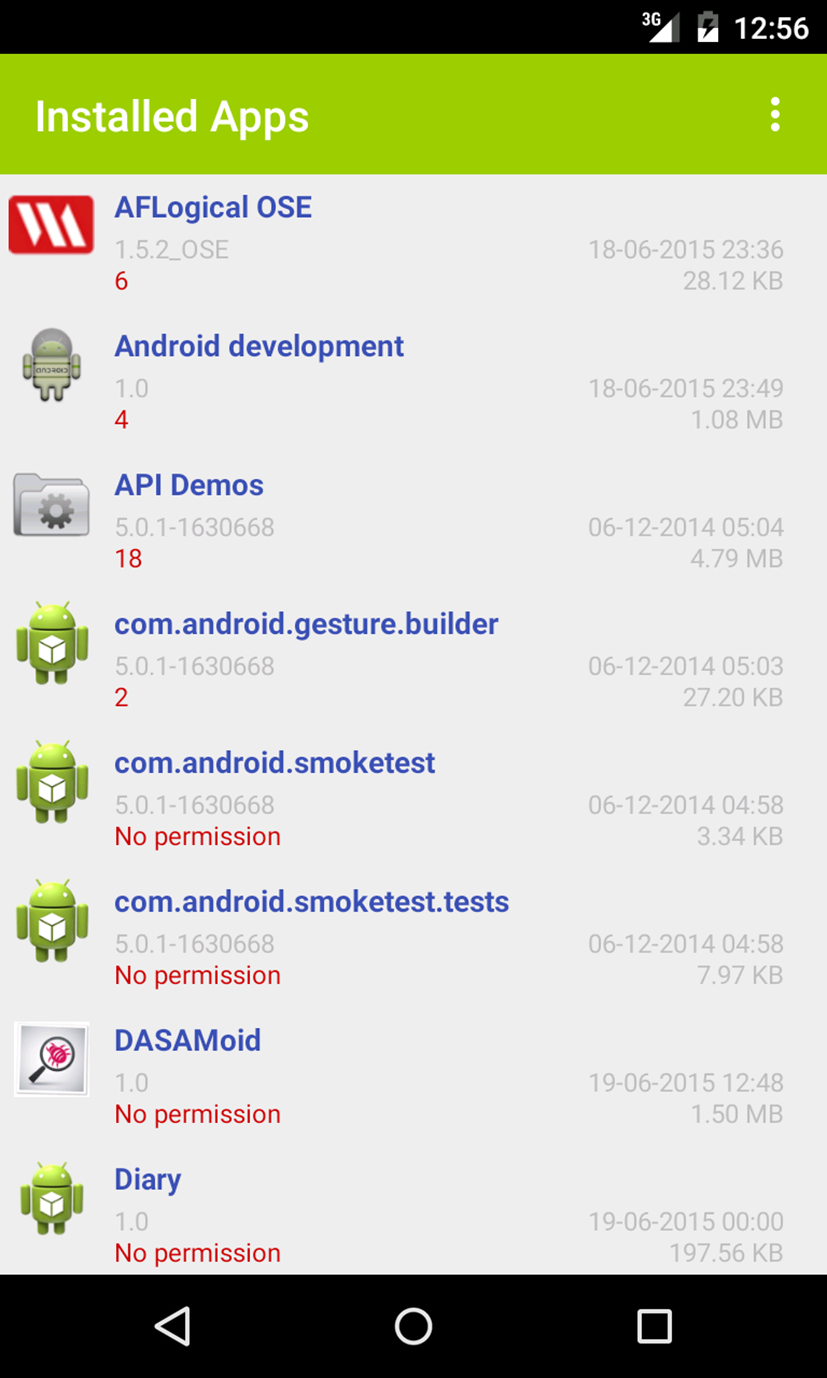
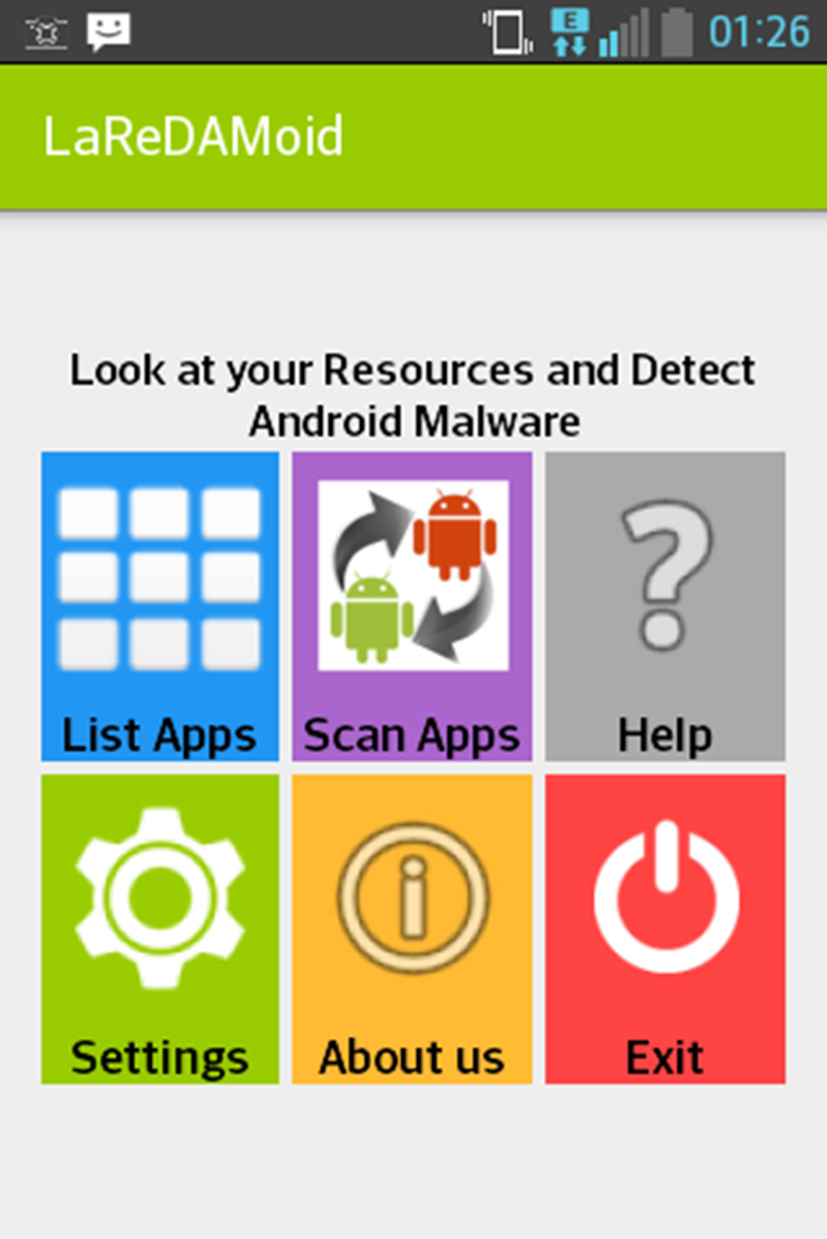
Fig. 11 represents an interface to perform the complete analysis. This interface is obtained after clicking on the button Scan Apps from the home screen. The item Analyse all is then selected to launch the complete analysis. The button Scan All Now is used to launch the complete scanning; the user can rather select the item Select Apps used to select specific applications for scanning as shown in Fig. 12.
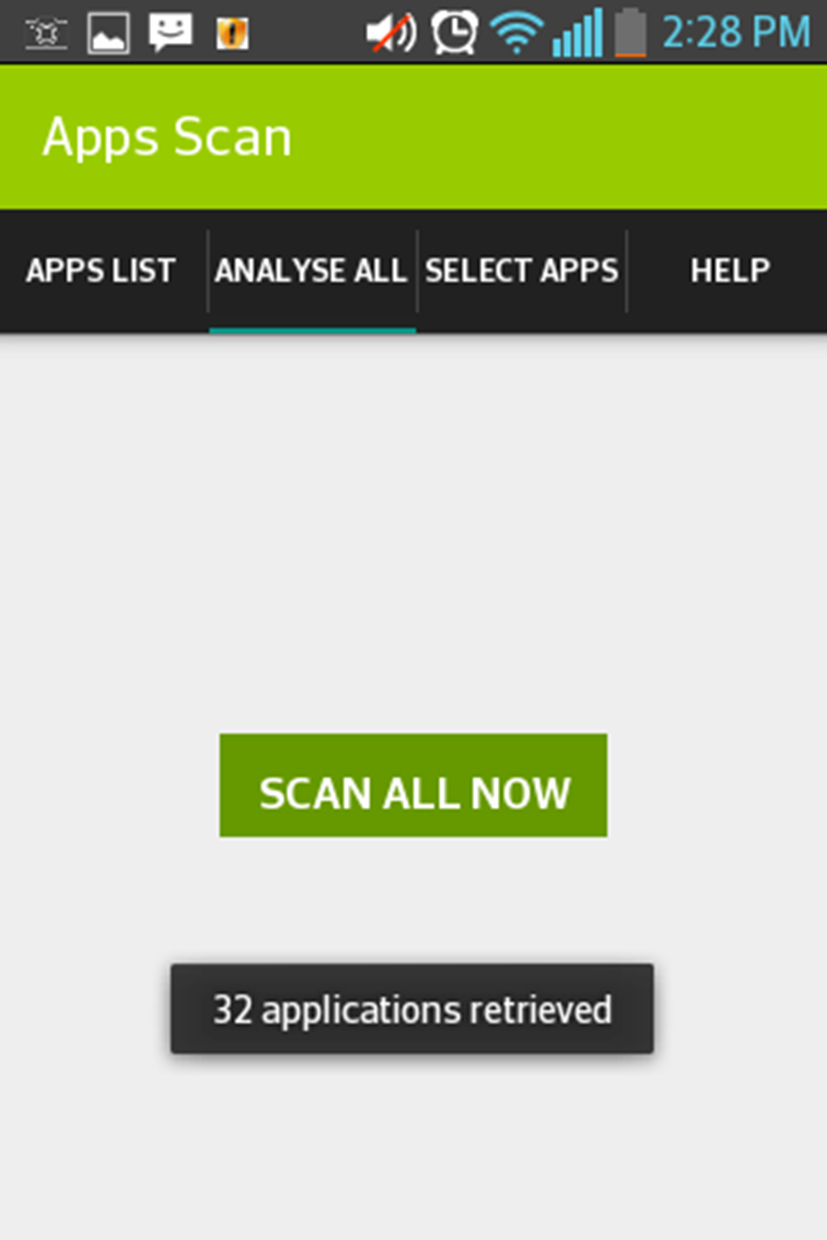
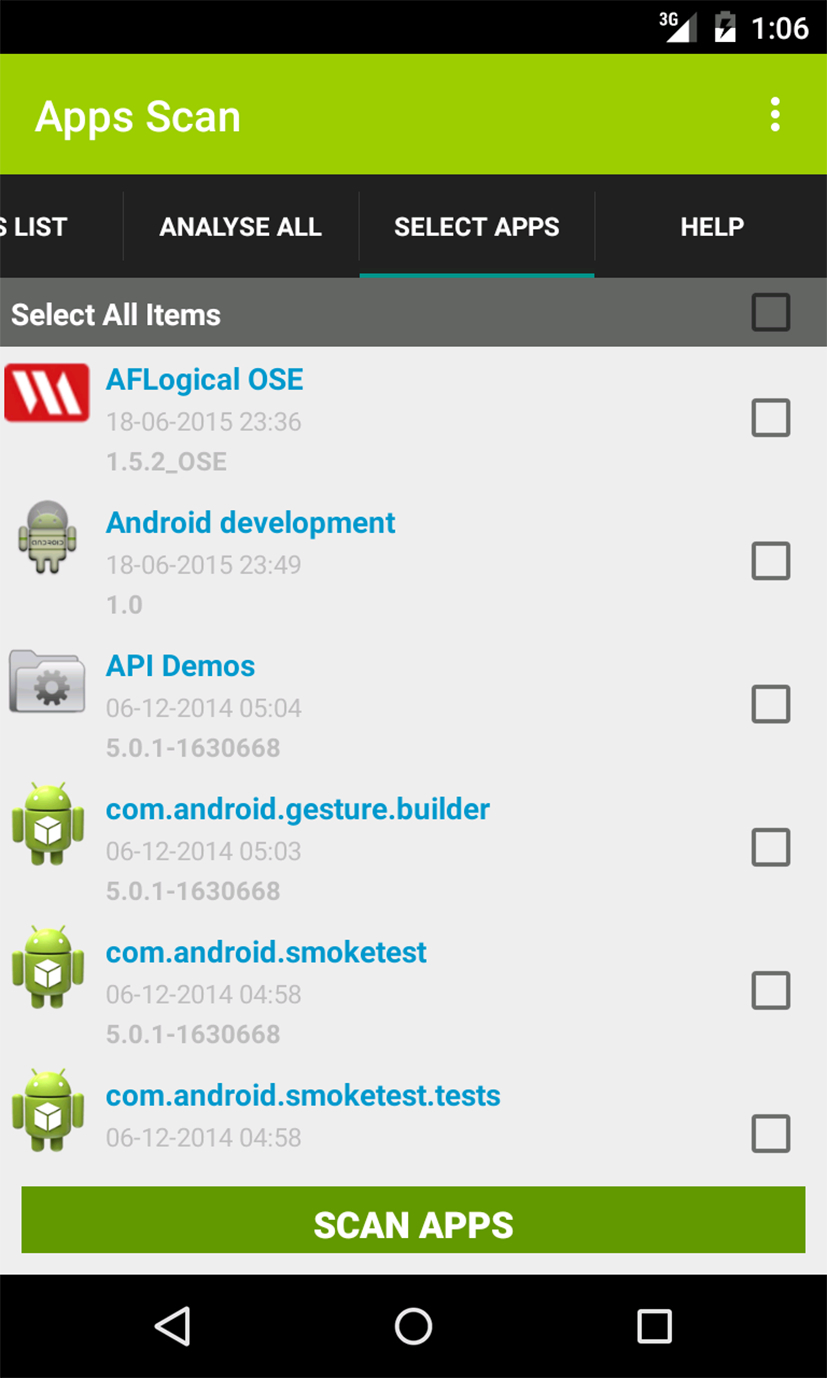
Fig. 13A depicts views for the analysis results. The first one displays applications with their status and corresponding icons to highlight statuses. The user clicks on the application icon to obtain Fig. 13A, to go deeper into the results. This figure shows actions that the user can take according to results and settings made on resources. A risk value under scale of 4 is displayed to indicate to the user whether his security requirements have been considered for each selected resource. The user can then decide to run the application or to remove it.
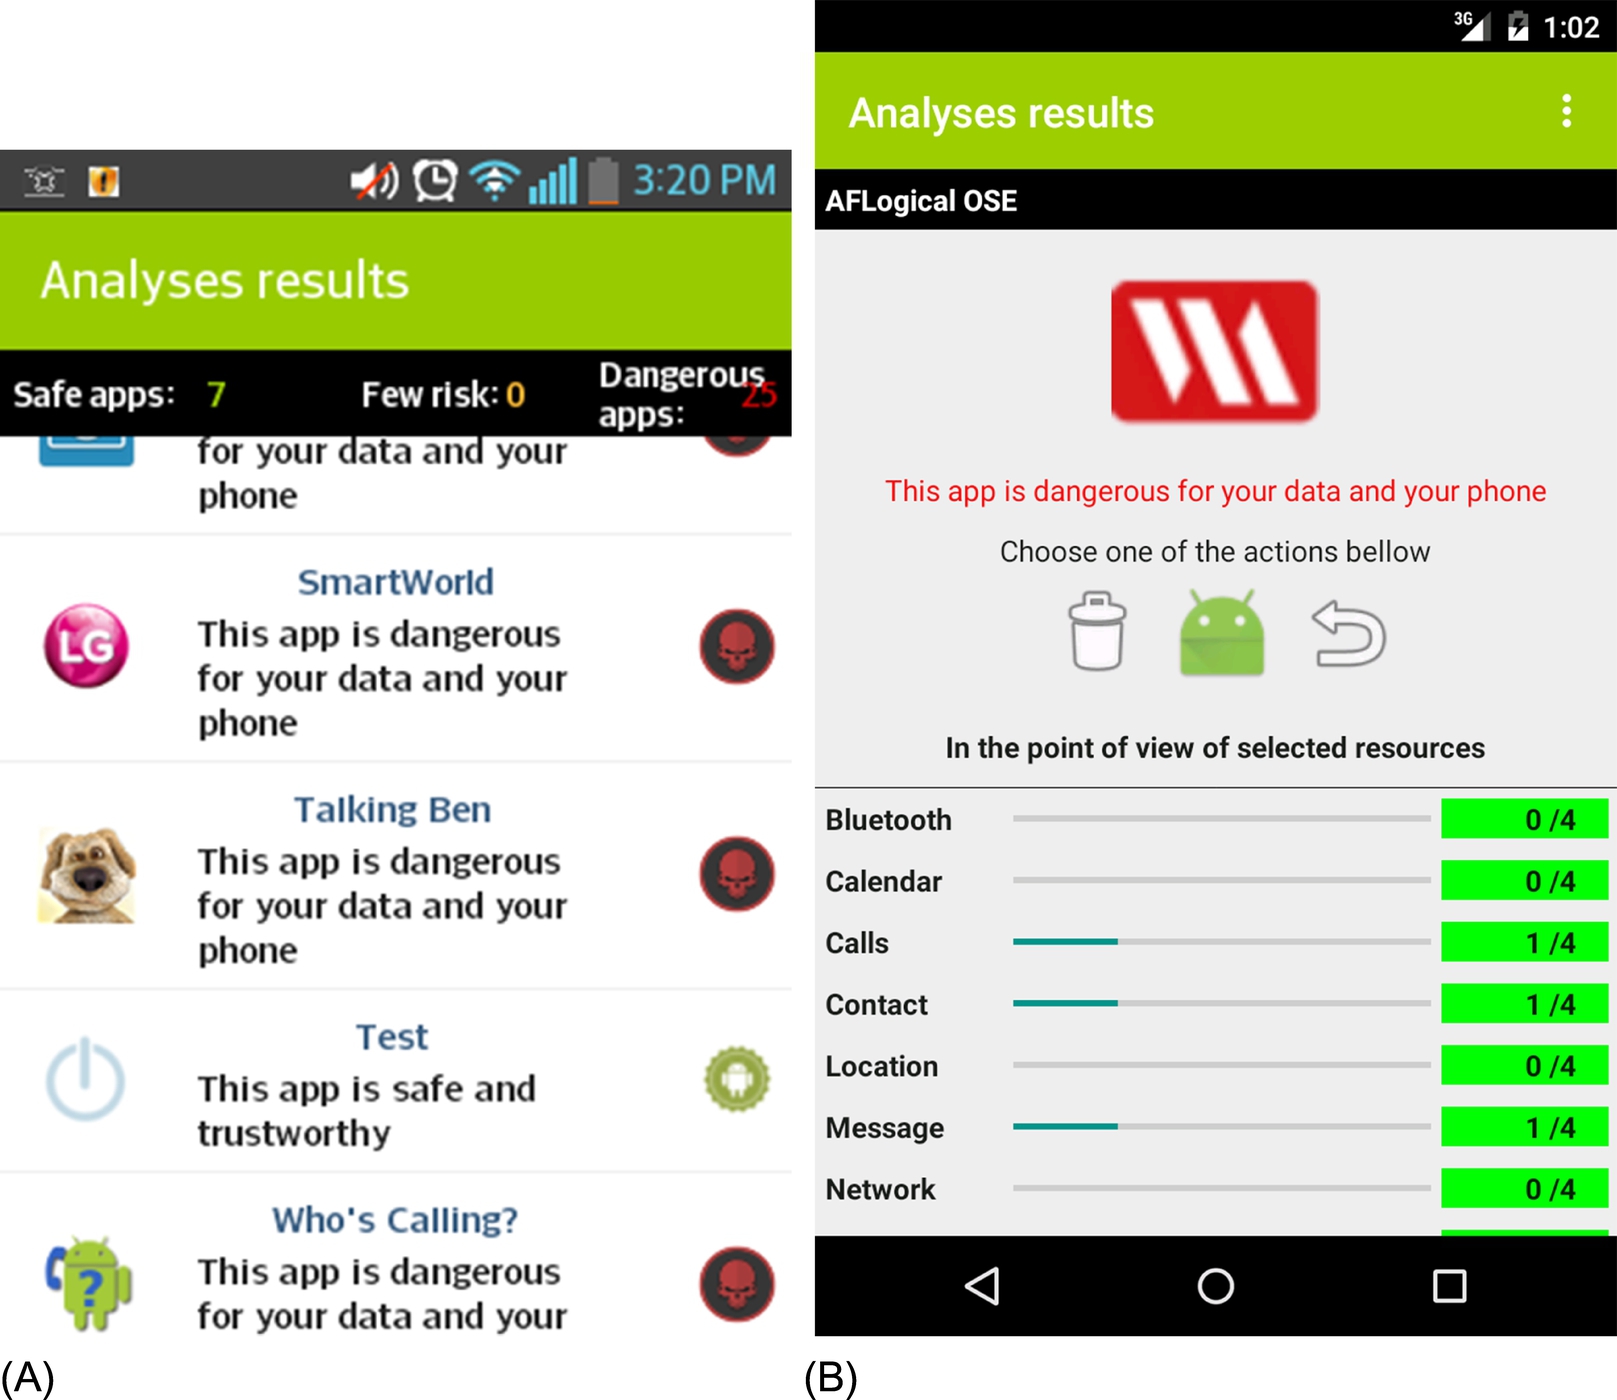
The user is invited to specify how he will be informed of the results of the automatic analysis: with a notification or with an alert dialog. Additionally, the user selects resources to protect in order to evaluate security risks. These two previous functionalities are shown in Fig. 14A. He is then notified after a new installation or a new update, as shown in Fig. 14B.
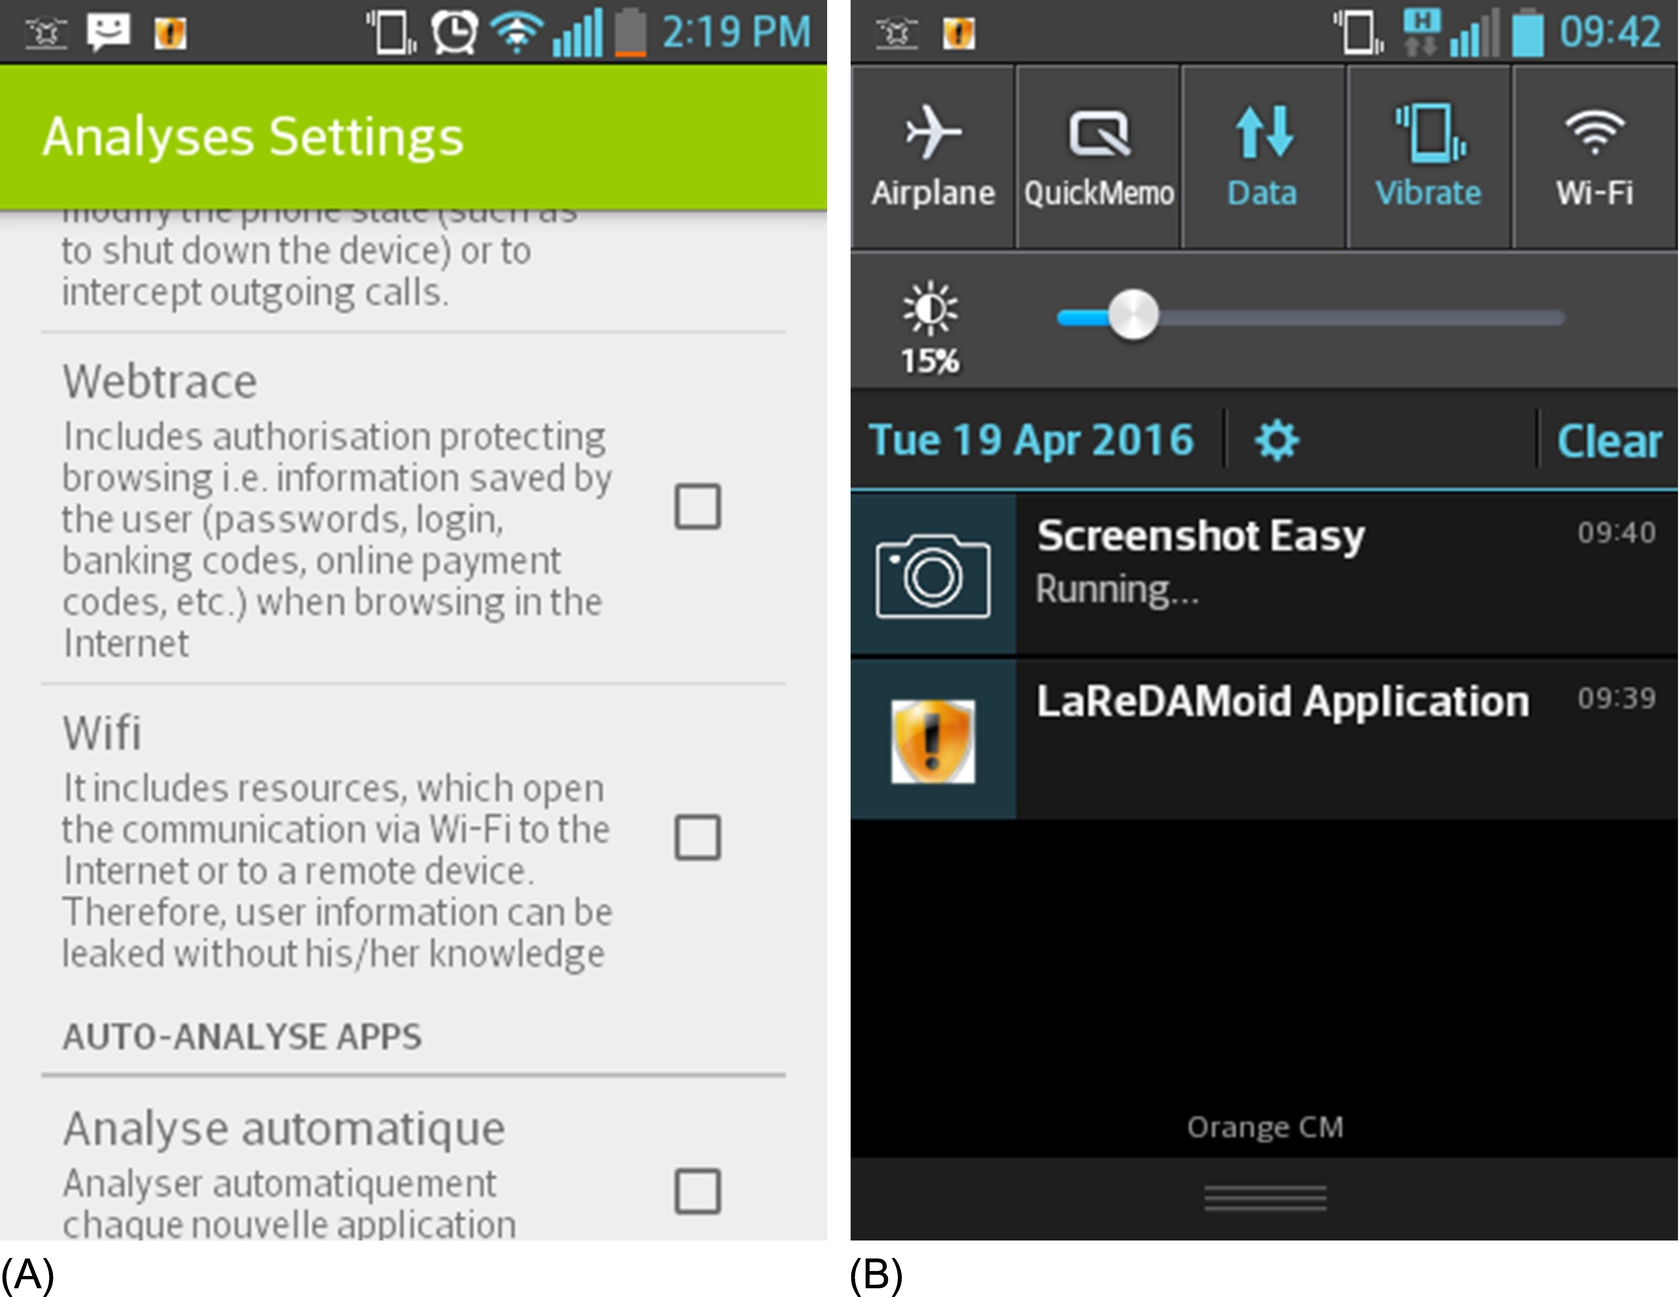
6 Evaluation and Discussion
This section aims to evaluate LaReDAMoid in several objectives:
• Performance detection and performance prediction: is LaReDAMoid able to detect known samples and unknown samples?
• Comparison of LaReDAMoid detection of malware families against related works.
• Comparison of LaReDAMoid with renowned antiviruses.
• Comparison of LaReDAMoid with related works.
6.1 Detection Performance
The first step in this section consists of evaluating the detection performance of LaReDAMoid on known samples provided during the training. We consider the three best classifiers, IBk, PART, and RandomForest. Table 8 presents the detailed results.
The system is able to detect 97% of the malware samples used in the training with 99% of AUC. This proves that the model is outstanding with a precision of 95% at least. But, what is the situation when it has to predict the class of unknown samples? We build the experiments to evaluate the prediction performance of LaReDAMoid. We determine first of all the performance with the 10-fold cross validation, a case of the k-fold cross validation method, described as applying the classifier to the data 10 times, and each time with a 90-10 configuration; that is, 90% of data for training and 10% for testing; Table 9 summarizes the average of these 10 iterations. We keep the same metrics and the same classifier used to determine detection performance.
Table 9
Prediction Results Simulating the Unknown Dataset
| TP | FN | FP | TN | TPR (%) | FPR (%) | Precision (%) | ACC (%) | AUC (%) | |
| IBK | 6468 | 315 | 497 | 1496 | 95.4 | 24.9 | 92.9 | 90.74 | 95.7 |
| PART | 6427 | 356 | 418 | 1575 | 94.8 | 21,00 | 93.9 | 91.18 | 94.7 |
| RandomForest | 6475 | 308 | 432 | 1561 | 95.5 | 21.7 | 93.7 | 91.56 | 96.6 |
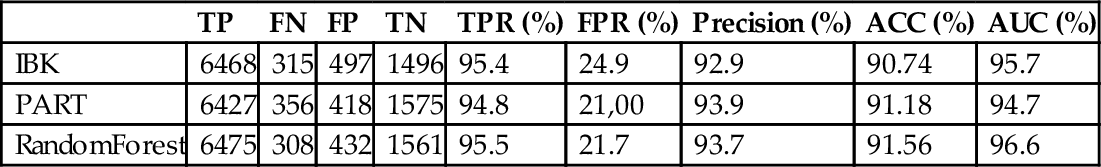
The model remains outstanding; it is able to detect 95 % of the malware samples with 93% precision. We randomly split the partitions into known and unknown ones. We apply three cases:
• known partition (60%) and unknown one (40%);
• known partition (66%) and unknown one (34%);
• known partition (70%) and unknown one (30%).
We repeat them 10 times and take the average results. The partitioning cases ensure that the reported results refer to the capacity of the system to predict unknown malware during the learning phase.
The results of these experiments are consigned in Table 10, where only the AUC metric with classifiers IBk, PART and RandomForest is considered.
Table 10
Values of AUC for Every Partition
| Partitions | Classifier | AUC |
| Splitting 60-40 | IBk | 0.952 |
| PART | 0.952 | |
| RandomForest | 0.964 | |
| Splitting 66-34 | IBk | 0.957 |
| PART | 0.95 | |
| RandomForest | 0.965 | |
| Splitting 70-30 | IBk | 0.955 |
| PART | 0.95 | |
| RandomForest | 0.966 |
The system is able to efficiently detect unknown malware with 95–97% of AUC, corresponding to 95–97 samples of unknown malware when installing 100 applications. It is an excellent model according to Hosmer et al. (2013).
6.1.1 Model Validation
We collected a testing dataset including 51 malicious applications published at the end of 2014 by antivirus companies and research groups and 34 normal applications from Google Play to achieve the validation of the model. Normal applications have been tested in VirusTotal to confirm their normality. After eliminating duplicates and removing corrupted packages, we are left with 30 malicious applications and 33 normal applications. The results obtained are the following:
• LaReDAMoid detects correctly 30 pieces of malware out of 30.
• LaReDAMoid detects correctly 25 normal applications among 30; eight are misclassified, among which are the antivirus software AVAST, AVG, McAfee, F-SECURE Mobile Security, which require accessing the user’s whole sensitive information of the user: personal information (accounts, phone calls, messages, personal information, location, services that cost money), hardware information (network communication, storage, hardware controls, and system tools). They request respectively 42, 57, 70, and 59 permissions, too much for an application. This result indicates that the false positives could be considerable due to the fact that an application that requires many permissions tends almost all resources considered in the model. Therefore it will be considered as risky according to the second layer.
6.2 Comparison Between Layer Models
The objective of this section is to determine, which layer models offers independently better results. Fig. 15 (A–C) illustrates respectively AUC, precision, and true positive rate results on these models for the best classifier RandomForest.
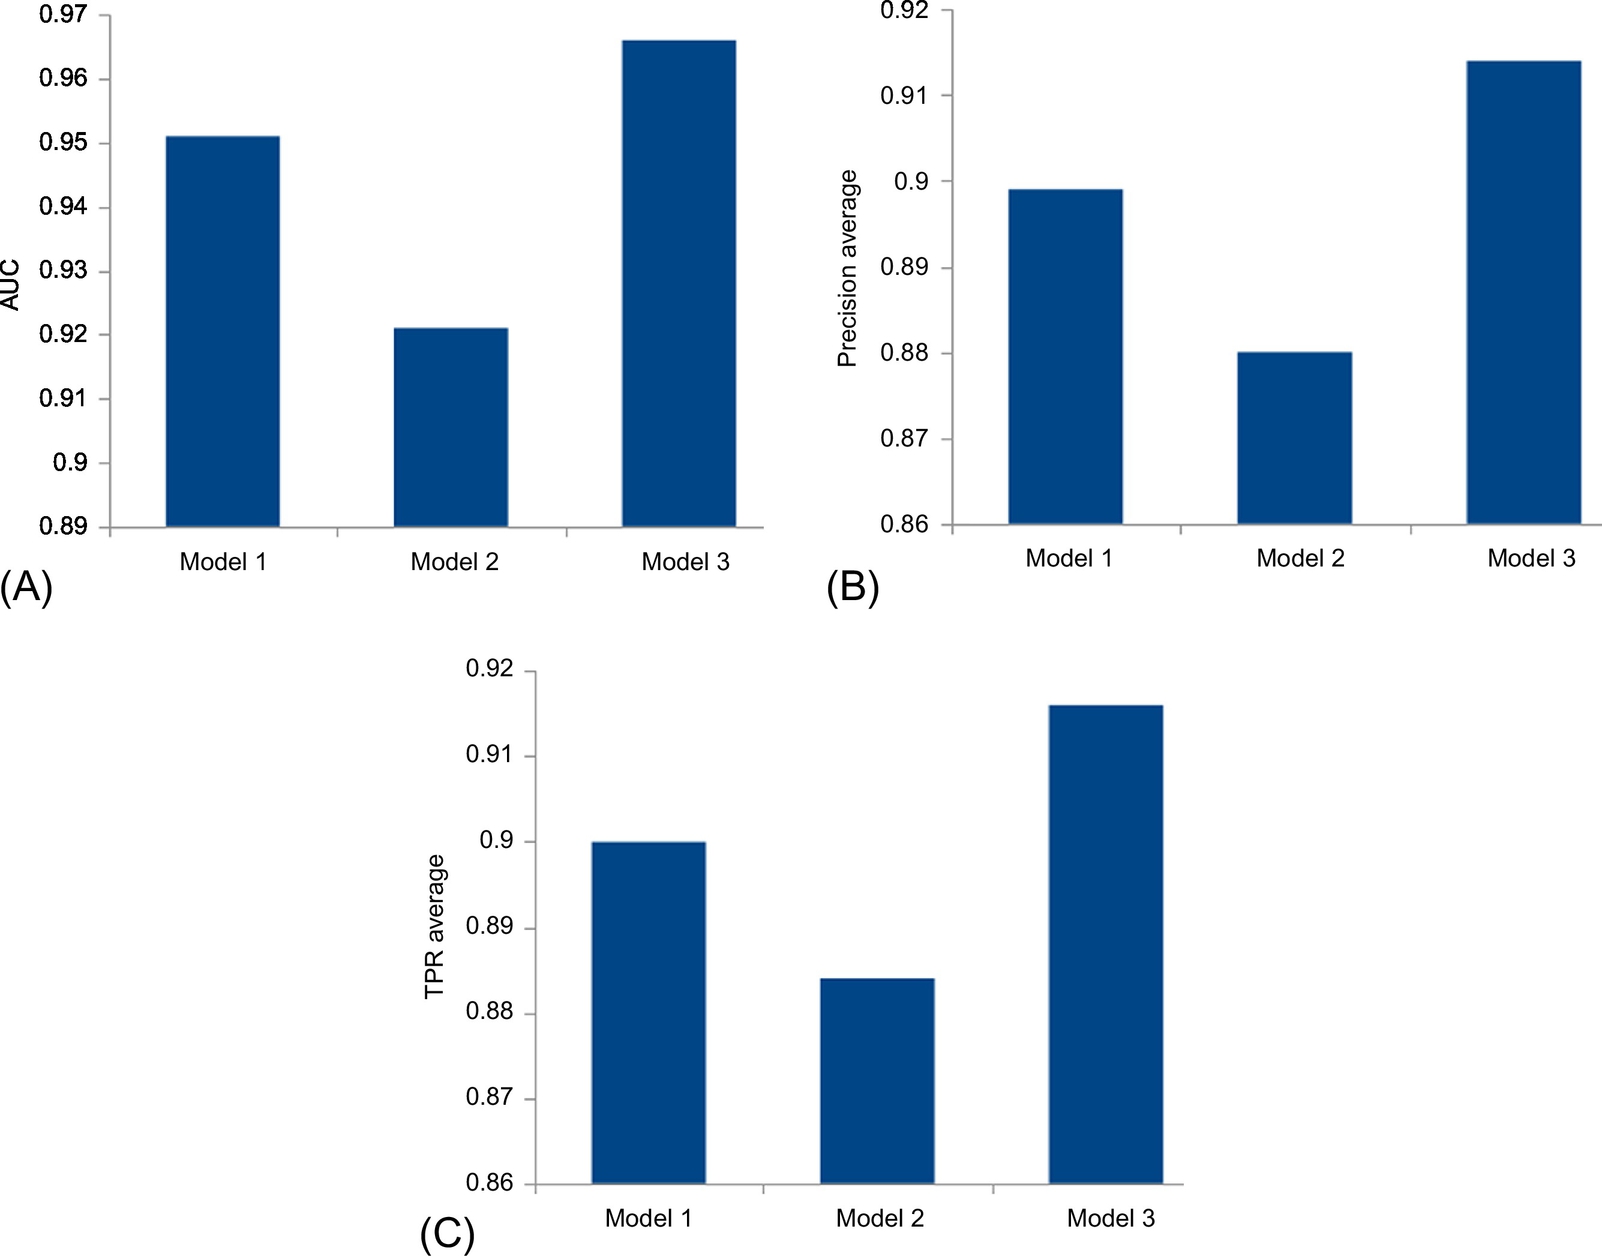
The third model outperforms the two others, according to AUC, precision, and TPR results. We discover however an exception with classifier PART about the precision criteria. It indicates that Model 1 is more precise than the others (Fig. 16).
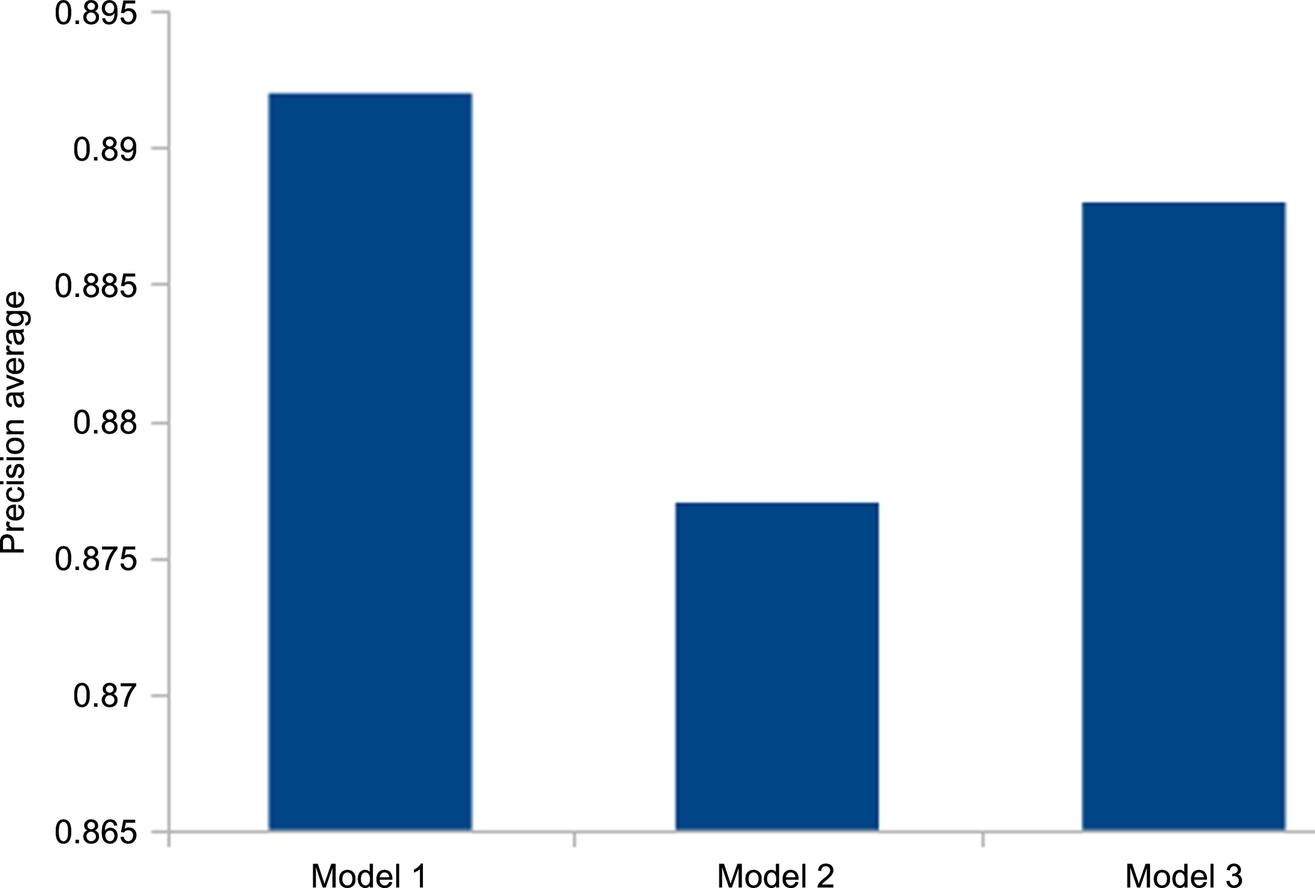
6.3 Detection of Malware Families
A malware family is a group of applications with similar attack techniques. Zhou and Jiang (2012) released 49 malware families in 2012 that reflect always the behavior of nowadays malware (Wang et al., 2014). An important experiment consists therefore to evaluating specifically the performance detection of every sample for the forty-nine families. The family names and the number of samples for each family are listed in Table 11. The detection performance of the whole system for each family is illustrated in Fig. 17. Our classifier is able to reliably detect all families with an average accuracy of 99.20% (1250/1260) at a false positive of 0.79% (10/1260). All families can be perfectly identified at 100%, except three of them: Asroot, Basebridge, and Droiddeluxe. Basebridge shows a detection rate of more than 95.72% (112 correctly detected out of 119), Asroot shows a detection rate of 75% (6 correctly detected out of 8) and Droiddeluxe (with just one sample) cannot be detected. These families commonly rely on the root privilege to function well. They leverage known root exploits (rageagainstthecage, Asroot) without asking the user to grant the root privilege to these samples to escape from the built-in security sandbox. Our system is based on static analysis of requested permissions. Therefore we cannot identify applications exploiting root exploits with no permission requested. Dynamic analysis for mitigation should be associated, to scrutinize the runtime behavior of the installed application. The system rather detects perfectly other families with samples performing privilege escalation and remote control presented in Table 11.
Table 11
Malware Families
| Families(# of Samples) | Detection Our Model/Model Wang et al. (2014) (%) | Privilege Escalation | Remote Control | |
| F1 | ADRD(22) | 100/100 | x | |
| F2 | AnserverBot(187) | 100/100 | x | |
| F3 | Asroot(8) | 75/50 | x | |
| F4 | BaseBridge(122) | 95.72/83.60 | x | x |
| F5 | BeanBot(8) | 100/87.5 | x | |
| F6 | BgServ(9) | 100/100 | x | |
| F7 | CoinPirate(1) | 100/0 | x | |
| F8 | Crusewin(1) | 100/100 | x | |
| F9 | DogWars(1) | 100/0 | x | x |
| F10 | DroidCoupon(1) | 0/100 | x | |
| F11 | DroidDeluxe(1) | 100/0 | x | x |
| F12 | DroidDream(16) | 100/87.5 | x | |
| F13 | DroidDreamLight(46) | 100/93.47 | x | x |
| F14 | DroidKungFu1(34) | 100/100 | x | x |
| F15 | DroidKungFu2(30) | 100/100 | x | x |
| F16 | DroidKungFu3(309) | 100/97.41 | x | |
| F17 | DroidKungFu4(96) | 100/97.91 | x | x |
| F18 | DroidKungFuSapp(3) | 100/100 | ||
| F19 | DroidKungFuUpdate(1) | 100/100 | x | |
| F20 | Endofday(1) | 100/100 | ||
| F21 | FakeNetflix(1) | 100/100 | ||
| F22 | FakePlayer(6) | 100/100 | ||
| F23 | GamblerSMS(1) | 100/100 | x | |
| F24 | Geinimi(69) | 100/100 | ||
| F25 | GGTracker(1) | 100/100 | x | x |
| F26 | GingerMaster(4) | 100/100 | x | |
| F27 | GoldDream(47) | 100/100 | ||
| F28 | Gone60(9) | 100/100 | ||
| F29 | GPSSMSSpy(6) | 100/100 | ||
| F30 | HippoSMS(4) | 100/100 | ||
| F31 | Jifake(1) | 100/0 | x | |
| F32 | jSMSHider(16) | 100/37.5 | x | |
| F33 | KMin(52) | 100/100 | ||
| F34 | LoveTrap(1) | 100/100 | ||
| F35 | NickyBot(1) | 100/100 | x | |
| F36 | NickySpy(2) | 100/100 | x | |
| F37 | Pjapps(58) | 100/100 | x | |
| F38 | Plankton(11) | 100/63.63 | x | |
| F39 | RogueLemon(2) | 100/100 | ||
| F40 | RogueSPPush(2) | 100/100 | ||
| F41 | SMSReplicator(1) | 100/0 | ||
| F42 | SndApps(10) | 100/80 | x | |
| F43 | Spitmo(1) | 100/100 | ||
| F44 | TapSnake(2) | 100/50 | ||
| F45 | Walkinwat(1) | 100/0 | x | |
| F46 | YZHC(22) | 100/100 | x | |
| F47 | Zhash(11) | 100/100 | x | |
| F48 | Zitmo(1) | 100/100 | ||
| F49 | Zsone(12) | 100/91.66 |
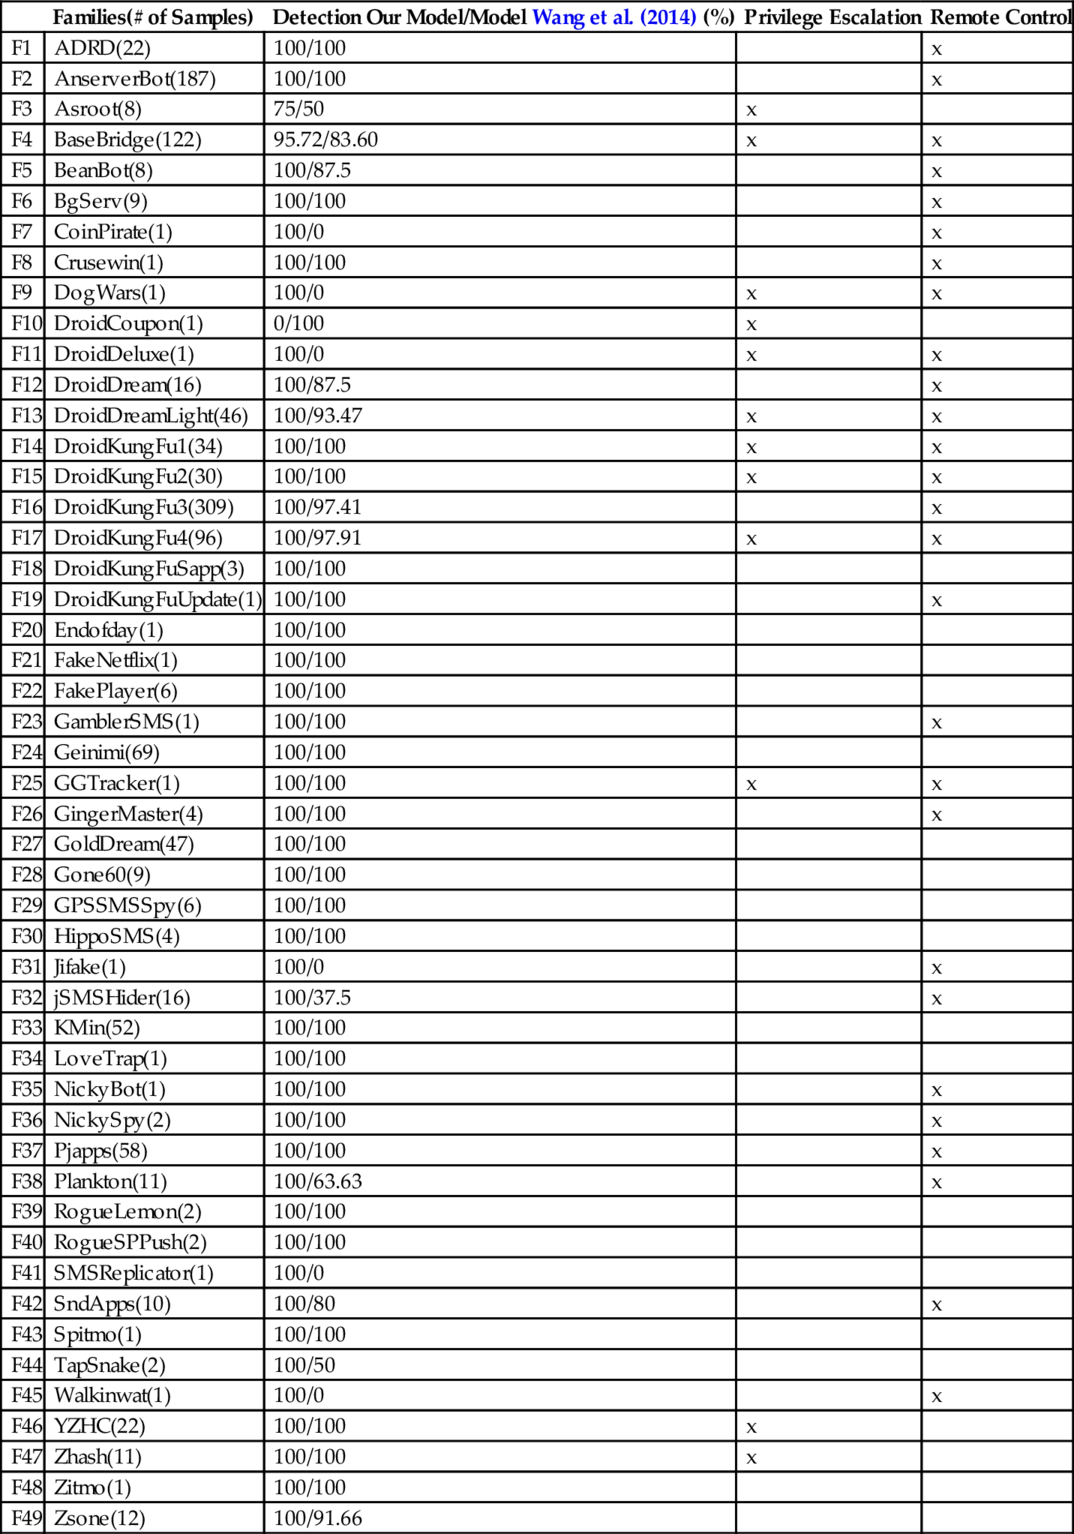
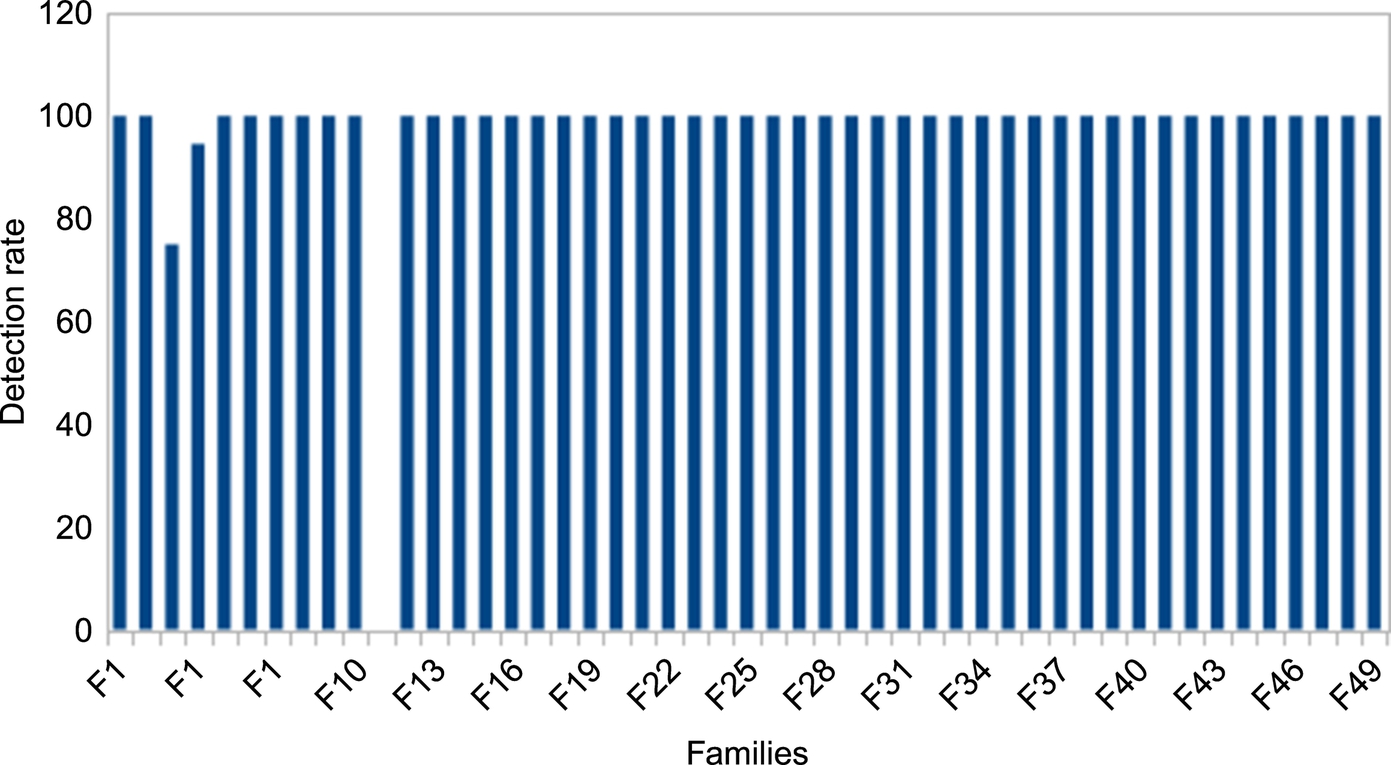
Fig. 17 summarizes the detection performance of malware families.
Drebin authors (Arp et al., 2014; Wang et al., 2014) investigated similarly the detection of malware families. The first work focuses only on 20 families whereas the second focuses on all the families. The following point has been drawn in a conjoint comparison:
• Our system perfectly detects the Kmin family like Drebin.
• Our system outperforms Drebin in the detection of other families with 100% of the detection rate. Drebin stands with average 90% detection of those families.
• Wang et al. (2014) detect 94.92% (119) of malware family samples whereas ours detects about 99.20%. The second column of Table 12 presents details of both detection by our model and Wang et al. (2014). Most of the case, we outperforms their detection. The exception appears only with the family Droidcoupon with one sample.
Table 12
Detection Results on Unknown Malware
| No | AVG | Avast | F-Secure | LaReDAMoid | ||||
| MP | SP | FPr | NP | |||||
| 1 | ING Bank N.V. | × | ✓ | ● | ✓ | |||
| 2 | AlfSafe | × | ✓ | ● | ✓ | |||
| 3 | Android System | × | ✓ | ● | ✓ | |||
| 4 | Awesome Jokes | ✓ | ✓ | ● | ✓ | |||
| 5 | BaDoink | × | ✓ | ● | ✓ | |||
| 6 | BaseApp | × | ✓ | ● | ✓ | |||
| 7 | Battery Doctor | × | ✓ | ● | ✓ | |||
| 8 | Battery Improve | × | ✓ | ● | ✓ | |||
| 9 | Black Market Alpha | × | ✓ | ● | ✓ | |||
| 10 | Business Calendar Pro | ✓ | ✓ | ● | ✓ | |||
| 11 | Chibi Fighter | × | × | ● | ✓ | |||
| 12 | com.android.tools.system | × | ✓ | ● | ✓ | |||
| 13 | Dendroid | × | ✓ | ● | ✓ | |||
| 14 | Détecteur de Carrier IQ | × | ✓ | ● | ✓ | |||
| 15 | FlvPlayer | × | ✓ | ● | ✓ | |||
| 16 | Install | × | ✓ | ● | ✓ | |||
| 17 | Jelly Matching | × | ✓ | ● | ✓ | |||
| 18 | Mobile Security | × | ✓ | ● | ✓ | |||
| 19 | o5android | × | ✓ | ● | ✓ | |||
| 20 | PronEnabler | ✓ | ✓ | ● | ✓ | |||
| 21 | Radardroid Pro | × | ✓ | ● | ✓ | |||
| 22 | SberSafe | × | ✓ | ● | ✓ | |||
| 23 | Se-Cure Mobile AV | × | ✓ | ● | ✓ | |||
| 24 | SoundHound | × | ✓ | ● | ✓ | |||
| 25 | SPL Meter FREE | × | ✓ | ● | ✓ | |||
| 26 | System Service | × | ✓ | ● | ✓ | |||
| 27 | VkSafe | × | ✓ | ● | ✓ | |||
| 28 | 41CA3EFD | × | ✓ | ● | ✓ | |||
| 29 | sb.apk | × | ✓ | ● | ✓ | |||
| 30 | ThreatJapan_D09 | × | ✓ | ● | ✓ | |||
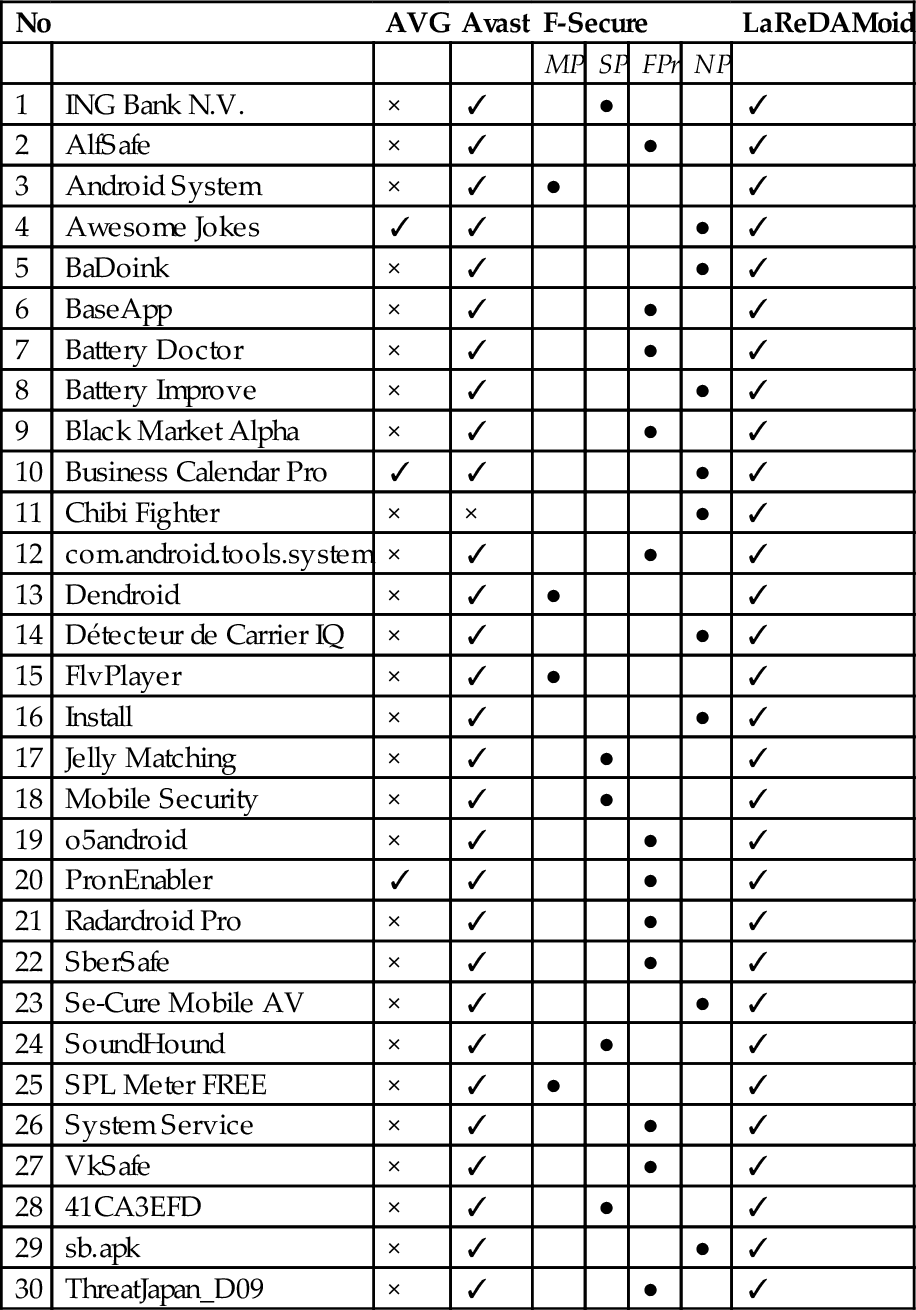
×, misclassified; ✓, correctly classified.
6.4 Antivirus Scanners
We have compared our model to three renown antiviruses: AVG, Avast, and F-Secure. The reason is that thay scan applications based on permissions. This experiment uses the testing dataset (Section 6.1.1) with 30 unknown samples of malware and 30 unknown normal applications collected for validation. Table 12 presents the detection results for LaReDAMoid and antiviruses.
Table 13 reveals that the system correctly detects 30 samples of malware whereas AVG only alerts to three samples: Awesome Jokes, Business Calendar Pro, and PronEnabler. AVG provides therefore a TP of three, a TN of 33, a FN of 27 and a FP of null. Avast detects 29 malware samples and fails to detect the Chibi Fighter malware. Avast gets therefore a TP of 29, a TN of 33, a FN of one and FP of null. The applications are classified in four categories: many privacy issues (MP), some privacy issues (SP), few privacy issues (FPr), and no privacy issues (NP) concerning F-Secure. Only four malware samples are correctly classified. Five samples are detected as applications with some privacy issues and 12 are classified as applications with few issues. F-Secure incorrectly classifies nine samples as applications with NP. F-Secure Mobile Security has TP of nine (we consider MP and SP as malicious classes), a TN of 24 (NP), FP of nine (normal applications belonging to MP, SP, and FPr), and a FN of nine (malware belonging to NP).
Table 13
Detection Results
| TP | FN | FP | TN | TPR | FPR | Accuracy | |
| AVG | 3 | 27 | 0 | 33 | 10.00% | 0.00% | 57.14 % |
| Avast | 29 | 1 | 0 | 33 | 96.66% | 0.00% | 98.41% |
| F-Secure | 9 | 21 | 9 | 24 | 30.00% | 27.00% | 52.38 % |
| LaReDAMoid | 30 | 0 | 8 | 25 | 100.00% | 24.24 % | 88.00% |
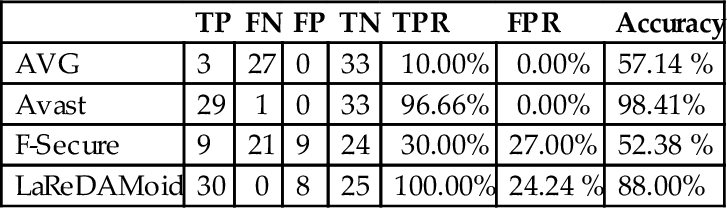
Our scheme is the best in determining malware with 100% of TPR, followed by Avast, which fails to determine just one malware sample. The accuracy indicates that LaReDAMoid records the best performance after Avast. LaReDAMoid is therefore considered as reliable compared to existing antiviruses.
Zhou and Jiang experienced that the best antivirus (Lookout) detects 79.6% of 1260 samples from the 49 malware families. We have also taken from this work on other antiviruses (Norton, Trend Micro and Avg). Table 14 shows that LaReDAMoid outperforms Lookout and the others on this dataset.
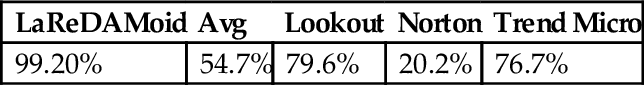
6.5 Related Works
We compare the performance of the detection system with three well-known approaches in the literature, based on requested permissions as features Kirin (Enck et al., 2009), RCP+RPCP (Rare Critical Permissions and Rare Pair Critical Permission) (Sarma et al., 2012) and PermissionWatcher (Struse et al., 2012). Kirin identifies nine permission rules for applications to be considered potential malicious. RCP+RPCP measures the permission risks by evaluating the popularity of permissions within applications of the same category. The performance of RCP+RPCP is generated with the rule #RCP(2)+#RPCP(1) ≥ θ, the best performing one. PermissionWatcher classifies an application based on 16 rules of combination of permissions.
Table 15 presents the performance results in terms of TPR, FPR, Precision, Accuracy, and AUC, after applying these methods to the learning dataset defined in Section 5.1.
Table 15
Detection Performance
| TP | FN | FP | TN | TPR | FPR | Precision | Accuracy | AUC | |
| Kirin | 4076 | 2707 | 271 | 1722 | 60.09 % | 13.5 % | 93.76 % | 57.52 % | 66.9 % |
| #RCP(2)+#RPCP(1) ≥ θ | 5657 | 1126 | 177 | 1816 | 83.39 % | 8.88 % | 96.96 % | 85.15 % | 58.5 % |
| PermissionWatcher | 5342 | 1141 | 502 | 1491 | 76.39 | 25.18 | 91.40 | 77.86 | 85.4% |
| Our scheme | 6580 | 203 | 251 | 1742 | 97.00% | 12.6 % | 96.32 % | 94.82 % | 99.00% |
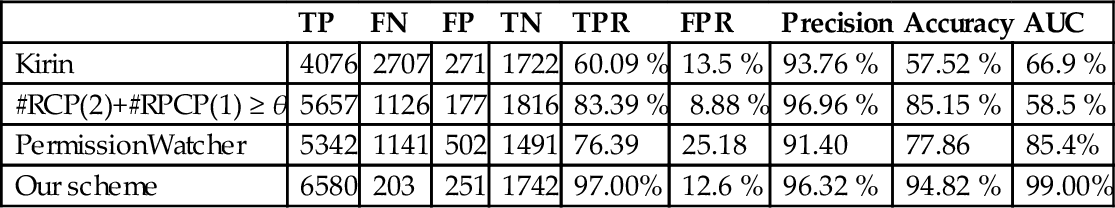
We can observe from Table 16 that our method has better performance than the other methods. Kirin only has nine manually defined security rules, not enough to distinguish malicious applications from benign applications. #RCP(2)+#RPCP(1) uses arbitrary 26 critical permissions to generate the risk signal for an application. This approach does not consider other permissions, which could generate maliciousness. The consequence is the low positive rate. PermissionWatcher includes permission combinations of Kirin and those not sufficient to profile applications. Our method uses ML and captures the permissions patterns of both benign and malicious applications. We consider security risks related to sensitive resources besides the requested permissions. We have better performance with this combination. #RCP(2)+#RPCP(1) however detects 74 normal applications more than the detection system. These two methods are similarly precise, although LaReDAMoid outperforms the three other methods concerning the accuracy and the AUC, given the capacity to predict unknown samples. We notice that the important prerequisite for a good detection is the precise determination of features. The semantics of features must reflect the sample profiles, and features contribute significantly to classification.
Table 16
Risk Determination
| Risks | Weight | |||||||
| No | Resources | Cij | Permissions and Combinations | R1 | R2 | R3 | R4 | Wij |
| 1 | Messages | C1, 1 | SEND_SMS | 1 | 0 | 1 | 1 | 3 |
| C2, 1 | RECEIVE_SMS | 1 | 0 | 0 | 0 | 1 | ||
| C3, 1 | RECEIVE_MMS | 1 | 0 | 0 | 0 | 1 | ||
| C4, 1 | READ_SMS | 1 | 0 | 0 | 0 | 1 | ||
| C5, 1 | WRITE_SMS | 0 | 1 | 0 | 0 | 1 | ||
| C6, 1 | SEND_SMS, RECEIVE_SMS | 1 | 0 | 1 | 1 | 3 | ||
| C7, 1 | SEND_SMS, READ_SMS | 1 | 0 | 1 | 1 | 3 | ||
| C8, 1 | SEND_SMS, WRITE_SMS | 0 | 1 | 1 | 1 | 3 | ||
| C9, 1 | RECEIVE_SMS, READ_SMS | 1 | 0 | 0 | 0 | 1 | ||
| C10, 1 | RECEIVE_SMS, WRITE_SMS | 1 | 1 | 0 | 0 | 2 | ||
| C11, 1 | READ_SMS, WRITE_SMS | 1 | 1 | 0 | 1 | 3 | ||
| C12, 1 | SEND_SMS, RECEIVE_SMS, READ_SMS | 1 | 0 | 1 | 1 | 3 | ||
| C13, 1 | SEND_SMS, RECEIVE_SMS, WRITE_SMS | 1 | 1 | 1 | 1 | 4 | ||
| C14, 1 | SEND_SMS, READ_SMS, WRITE_SMS | 1 | 1 | 1 | 1 | 4 | ||
| C15, 1 | WRITE_SMS, READ_SMS, RECEIVE_SMS | 1 | 1 | 0 | 0 | 2 | ||
| C16, 1 | READ_SMS, SEND_SMS, RECEIVE_SMS, WRITE_SMS | 1 | 1 | 1 | 1 | 4 | ||
| 2 | Contacts | C1, 2 | READ_CONTACTS | 1 | 0 | 0 | 0 | 1 |
| C2, 2 | WRITE_CONTACTS | 0 | 1 | 0 | 0 | 1 | ||
| C3, 2 | MANAGE_ACCOUNTS | 1 | 1 | 0 | 0 | 2 | ||
| C4, 2 | READ_CONTACTS, WRITE_CONTACTS | 1 | 1 | 0 | 0 | 2 | ||
| C5, 2 | READ_CONTACTS, MANAGE_ACCOUNTS | 1 | 1 | 0 | 0 | 2 | ||
| C6, 2 | MANAGE_ACCOUNTS, WRITE_CONTACTS | 1 | 1 | 0 | 0 | 2 | ||
| C7, 2 | READ_CONTACTS, WRITE_CONTACTS, MANAGE_ACCOUNTS | 1 | 1 | 1 | 0 | 3 | ||
| C2, 3 | READ_CALL_LOG | 1 | 0 | 0 | 0 | 1 | ||
| C3, 3 | WRITE_CALL_LOG | 0 | 1 | 1 | 0 | 2 | ||
| C4, 3 | CALL_PHONE | 1 | 0 | 1 | 1 | 3 | ||
| C5, 3 | CALL_PRIVILEGED | 1 | 0 | 1 | 1 | 3 | ||
| C6, 3 | PROCESS_OUTGOING_CALLS, READ_CALL_LOG | 1 | 0 | 1 | 1 | 3 | ||
| C7, 3 | PROCESS_OUTGOING_CALLS, WRITE_CALL_LOG | 1 | 1 | 1 | 1 | 4 | ||
| C8, 3 | PROCESS_OUTGOING_CALLS, CALL_PHONE | 1 | 0 | 1 | 1 | 3 | ||
| C9, 3 | PROCESS_OUTGOING_CALLS, CALL_PRIVILEGED | 1 | 0 | 1 | 1 | 3 | ||
| C10, 3 | READ_CALL_LOG, WRITE_CALL_LOG | 1 | 1 | 0 | 0 | 2 | ||
| C11, 3 | READ_CALL_LOG, CALL_PHONE | 1 | 0 | 1 | 1 | 3 | ||
| C12, 3 | READ_CALL_LOG, CALL_PRIVILEGED | 1 | 0 | 1 | 1 | 3 | ||
| C13, 3 | WRITE_CALL_LOG, CALL_PHONE | 1 | 1 | 1 | 1 | 4 | ||
| C14, 3 | WRITE_CALL_LOG, CALL_PRIVILEGED | 1 | 1 | 1 | 1 | 4 | ||
| C15, 3 | CALL_PHONE, CALL_PRIVILEGED | 1 | 0 | 1 | 1 | 3 | ||
| C16, 3 | PROCESS_OUTGOING_CALLS, READ_CALL_LOG, WRITE_CALL_LOG | 1 | 1 | 1 | 1 | 4 | ||
| C17, 3 | PROCESS_OUTGOING_CALLS, READ_CALL_LOG, CALL_PHONE | 1 | 0 | 1 | 1 | 3 | ||
| C18, 3 | PROCESS_OUTGOING_CALLS, READ_CALL_LOG, CALL_PRIVILEGED | 1 | 0 | 1 | 1 | 3 | ||
| C19, 3 | PROCESS_OUTGOING_CALLS, WRITE_CALL_LOG, CALL_PHONE | 1 | 1 | 1 | 1 | 4 | ||
| C20, 3 | PROCESS_OUTGOING_CALLS, WRITE_CALL_LOG, CALL_PRIVILEGED | 1 | 1 | 1 | 1 | 4 | ||
| C21, 3 | PROCESS_OUTGOING_CALLS, CALL_PHONE, CALL_PRIVILEGED | 1 | 1 | 1 | 1 | 4 | ||
| C22, 3 | READ_CALL_LOG, WRITE_CALL_LOG, CALL_PRIVILEGED | 1 | 1 | 1 | 1 | 4 | ||
| C23, 3 | READ_CALL_LOG, CALL_PHONE, CALL_PRIVILEGED | 1 | 0 | 1 | 1 | 3 | ||
| C24, 3 | WRITE_CALL_LOG, CALL_PHONE, CALL_PRIVILEGED | 1 | 1 | 1 | 1 | 4 | ||
| C27, 3 | PROCESS_OUTGOING_CALLS, READ_CALL_LOG, WRITE_CALL_LOG, CALL_PHONE | 1 | 1 | 1 | 1 | 4 | ||
| C28, 3 | PROCESS_OUTGOING_CALLS, READ_CALL_LOG, WRITE_CALL_LOG, CALL_PRIVILEGED | 1 | 1 | 1 | 1 | 4 | ||
| C29, 3 | PROCESS_OUTGOING_CALLS, READ_CALL_LOG, CALL_PHONE, CALL_PRIVILEGED | 1 | 0 | 1 | 1 | 3 | ||
| C30, 3 | PROCESS_OUTGOING_CALLS, WRITE_CALL_LOG, CALL_PHONE, CALL_PRIVILEGED | 0 | 1 | 1 | 1 | 3 | ||
| C31, 3 | READ_CALL_LOG, WRITE_CALL_LOG, CALL_PHONE, CALL_PRIVILEGED | 1 | 1 | 1 | 1 | 4 | ||
| C32, 3 | PROCESS_OUTGOING_CALLS, READ_CALL_LOG, WRITE_CALL_LOG, CALL_PHONE, CALL_PRIVILEGED | 1 | 1 | 1 | 1 | 4 | ||
| 4 | Calendar | C1, 4 | READ_CALENDAR | 1 | 0 | 0 | 0 | 1 |
| C2, 4 | WRITE_CALENDAR | 0 | 1 | 1 | 0 | 2 | ||
| C3, 4 | READ_CALENDAR, WRITE_CALENDAR | 1 | 1 | 1 | 0 | 3 | ||
| C2, 5 | ACCESS_COARSE_LOCATION | 1 | 0 | 1 | 0 | 2 | ||
| C3, 5 | INSTALL_LOCATION_PROVIDER | 1 | 0 | 1 | 0 | 2 | ||
| C4, 5 | LOCATION_HARDWARE | 1 | 0 | 1 | 0 | 2 | ||
| C5, 5 | ACCESS_FINE_LOCATION, ACCESS_COARSE_LOCATION | 1 | 0 | 0 | 0 | 1 | ||
| C6, 5 | ACCESS_FINE_LOCATION, INSTALL_LOCATION_PROVIDER | 1 | 0 | 0 | 0 | 1 | ||
| C7, 5 | ACCESS_FINE_LOCATION, LOCATION_HARDWARE | 1 | 0 | 0 | 0 | 1 | ||
| C8, 5 | ACCESS_COARSE_LOCATION, INSTALL_LOCATION_PROVIDER | 1 | 0 | 0 | 0 | 1 | ||
| C9, 5 | ACCESS_COARSE_LOCATION, LOCATION_HARDWARE | 1 | 0 | 0 | 0 | 1 | ||
| C10, 5 | INSTALL_LOCATION_PROVIDER, LOCATION_HARDWARE | 1 | 0 | 0 | 0 | 1 | ||
| C11, 5 | ACCESS_FINE_LOCATION, ACCESS_COARSE_LOCATION, INSTALL_LOCATION_PROVIDER | 1 | 0 | 0 | 0 | 1 | ||
| C12, 5 | ACCESS_FINE_LOCATION, ACCESS_COARSE_LOCATION, LOCATION_HARDWARE | 1 | 0 | 0 | 0 | 1 | ||
| C13, 5 | ACCESS_FINE_LOCATION, INSTALL_LOCATION_PROVIDER, LOCATION_HARDWARE | 1 | 0 | 0 | 0 | 1 | ||
| C14, 5 | ACCESS_COARSE_LOCATION, INSTALL_LOCATION_PROVIDER, LOCATION_HARDWARE | 1 | 0 | 0 | 0 | 1 | ||
| C15, 5 | ACCESS_FINE_LOCATION, ACCESS_COARSE_LOCATION, INSTALL_LOCATION_PROVIDER, LOCATION_HARDWARE | 1 | 0 | 0 | 0 | 1 | ||
| 6 | Wifi | C1, 6 | ACCESS_WIFI_STATE | 1 | 0 | 0 | 0 | 1 |
| C2, 6 | CHANGE_WIFI_STATE | 0 | 1 | 0 | 0 | 1 | ||
| C3, 6 | CHANGE_WIFI_MULTICAST_STATE | 0 | 1 | 0 | 0 | 1 | ||
| C4, 6 | ACCESS_WIFI_STATE, CHANGE_WIFI_STATE | 1 | 1 | 0 | 0 | 2 | ||
| C5, 6 | ACCESS_WIFI_STATE, CHANGE_WIFI_MULTICAST_STATE | 1 | 1 | 0 | 0 | 2 | ||
| C6, 6 | CHANGE_WIFI_STATE, CHANGE_WIFI_MULTICAST_STATE | 0 | 1 | 0 | 0 | 1 | ||
| C7, 6 | ACCESS_WIFI_STATE, CHANGE_WIFI_STATE, CHANGE_WIFI_MULTICAST_STATE | 1 | 1 | 0 | 0 | 2 | ||
| 7 | Bluetooth | C1, 7 | BLUETOOTH | 1 | 1 | 1 | 0 | 3 |
| C2, 7 | BLUETOOTH_ADMIN | 1 | 1 | 1 | 0 | 3 | ||
| C3, 7 | BLUETOOTH, BLUETOOTH_ADMIN | 1 | 1 | 1 | 0 | 3 | ||
| 8 | Network | C1, 8 | INTERNET | 1 | 0 | 1 | 0 | 2 |
| C2, 8 | ACCESS_NETWORK_STATE | 1 | 0 | 0 | 0 | 1 | ||
| C3, 8 | CHANGE_NETWORK_STATE | 0 | 1 | 0 | 0 | 1 | ||
| C4, 8 | INTERNET, ACCESS_NETWORK_STATE | 1 | 1 | 1 | 0 | 3 | ||
| C5, 8 | INTERNET, CHANGE_NETWORK_STATE | 1 | 1 | 1 | 0 | 3 | ||
| C6, 8 | ACCESS_NETWORK_STATE, CHANGE_NETWORK_STATE | 1 | 1 | 0 | 0 | 2 | ||
| C7, 8 | INTERNET, ACCESS_NETWORK_STATE, CHANGE_NETWORK_STATE | 1 | 1 | 1 | 0 | 3 | ||
| 9 | Telephony | C1, 9 | MODIFY_PHONE_STATE | 0 | 1 | 0 | 0 | 1 |
| C2, 9 | READ_PHONE_STATE | 1 | 0 | 0 | 0 | 1 | ||
| C3, 9 | READ_PHONE_STATE, MODIFY_PHONE_STATE | 1 | 1 | 0 | 0 | 2 | ||
| 10 | Web traces | C1, 10 | WRITE_HISTORY_BOOKMARKS | 0 | 1 | 0 | 0 | 1 |
| C2, 10 | READ_HISTORY_BOOKMARKS | 1 | 0 | 0 | 0 | 1 | ||
| C3, 10 | READ_HISTORY_BOOKMARKS, WRITE_HISTORY_BOOKMARKS | 1 | 1 | 0 | 0 | 2 | ||
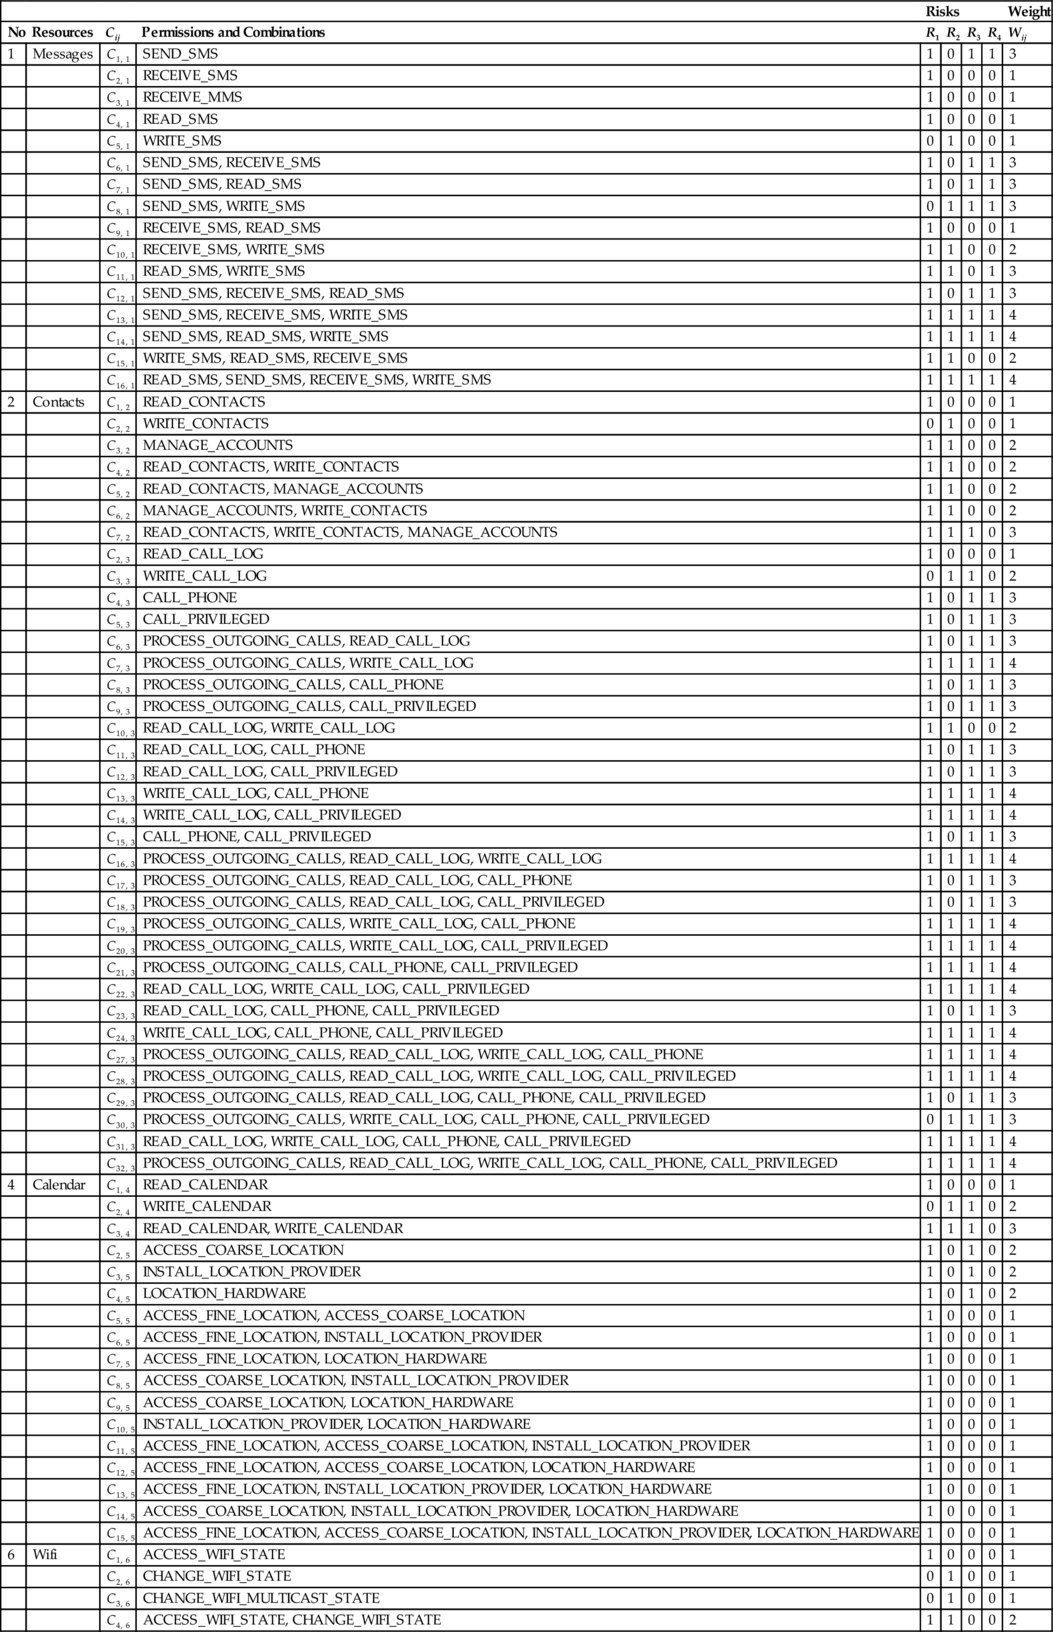
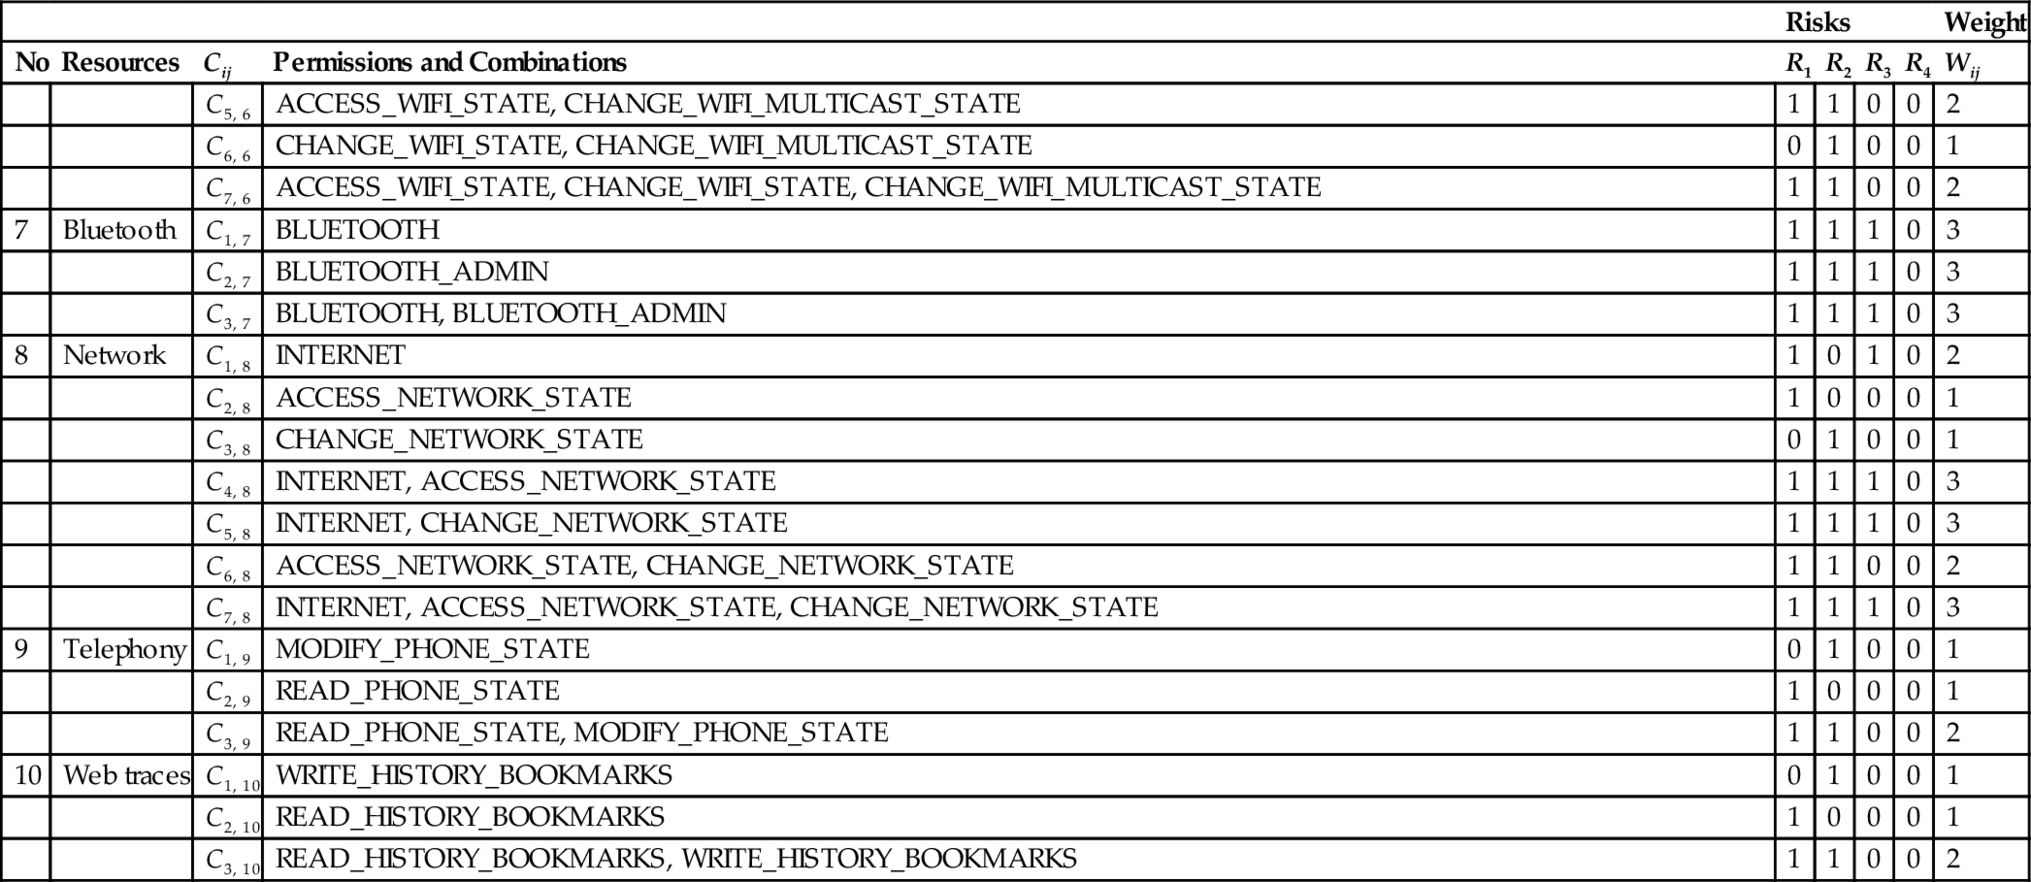
6.6 Limitations
The previous evaluation demonstrates the efficiency of the system in the detection of recent malware. The system uses machine learning techniques to learn malware profiles.
The system, however, lacks the capabilities of a run-time analysis. Some strains of malware make use of obfuscation or load code dynamically, which hinders any static inspection.
The system is less accurate in the detection of normal applications. This is justified by the fact that we focus only on permissions. Applications such as Avg, which require more than 30 permissions, will be considered as malware by our system because they access several resources; therefore the calculated risk in the second layer is higher.
A number of malware samples exactly the same permissions that are requested by normal applications. This gives negative impact on the detection accuracy by the first layer (Wang et al., 2014).
Some malware does not need to request any permissions (Lineberry et al., 2015). In this case, relying on only permissions is not feasible for the detection of malware pieces. The developers may request overprivileged permission requests that are never actually used in the application. This leads to false positives if only the permission information is used for the detection.
Another limitation is that detection performance critically depends on the availability of representative malicious and benign applications.
7 Conclusion and Perspectives
In this work, we provide a flexible machine learning-based mechanism to effectively detect Android malware based only on requested permissions. For that, we first described the Android ecosystem for a better understanding of the Android security limitations. Then we presented important aspects of the malware landscape. Next, we explored machine learning techniques used to learn and train application profiles, to detect and to predict application status: malicious or normal. Then we explored how to determine detection performance. Next we presented our model and its implementation. Finally, we evaluated and discussed the system with renowned antiviruses and related works.
Our system is built of three layers. The first layer is supported by a model, which aims to characterize applications based on proportion of permission requests. The second layer uses a model, which relies on security risks related to granting permissions. For that, we defined 10 resource categories including related permissions and distinct combination of these permissions. The last layer uses a model, which characterizes an application based on an association of vectors derived from the two first layers. We apply supervised learning with several learning algorithms, namely, NaiveBayes, LibSVM, IBk, AdaBoostM1, PART, J48, and RandomForest, on a collection of 6783 cases of malware and 1993 normal applications, which have been tested and validated. Then we determined detection rules to profile applications. Additionally, our system requires the user to specify sensitive resources to protect and takes it in account during the process of characterization of applications.
Our framework is good in detecting around 98% accuracy and in predicting with around 96% of the true positive rate. This means that it is capable to discriminate almost all cases of malware in detection and prediction. The AUC is between 97% and 99%, which confers the property of the outstanding model according to Hosmer and Lemeshow (2000).
Some limitations exist because the system only considers the permissions as features. The first one is that normal applications with several permissions are likely considered as malware since they seem to be accessing several resources. The second one is that they are normal applications, which requests the same permission as a normal application. In this case, the detection will fail. The last case is that the system is not able to scrutinize an application with no permission.
For future work, we plan to associate runtime analysis and other static features to strengthen the system.
Appendix A Different Combinations of Permissions and Determination of Risks
Table 16 shows data for different combinations of permissions and determination of risks.
Appendix B Normal Applications for Testing
AVG, McAfee Security, Safety Care, Who’s Calling, Fsecure Mobile Security, Avast Mobile Security, CSipSimple, German, Talking Ben, 100% Anglais, Alphabets & Numbers Writing, Apk Extractor, AppPermissionWatcher, AppPermissions, Baby Ninja Dance, Candy Crush Saga, LaReDAMoid, File Manager, Important Dates, Kids Songs, Learn Numbers in French Lang, Malware Tracker, My Permissions, Noms Abc, Permission Friendly Apps, Permission Monitor Free, Polaris Viewer 4, Pregnancy Tracker, Screenshot Easy, Smartworld, Test, Malware Tracker.