
Chapter 1
Foreign Exchange Market Structure, Players, and Evolution
It would be hard to overstate the importance of exchange rates for the world economy. They affect output and employment through real exchange rates. They affect inflation through the cost of imports and commodity prices. They affect international capital flows through the risks and returns of different assets. Exchange rates are justifiably a major focus for policymakers, the public, and, of course, the media.
To understand exchange rates, it is essential to know how these prices are determined. This chapter describes the FX market and presents new evidence on recent trends, thereby setting the stage for the rest of the handbook. It presents stylized facts on the market's size and composition. It then describes more closely the motives, incentives, and constraints of the major players. Trading is a search problem, and the constraints and costs related to this search are affected by the structure of the market. Our starting point is that the exchange rates are primarily driven by new information about economic fundamentals. In this light, we review which agents bring information to the market and exactly how their information becomes embedded in the market price.
The chapter describes the momentous changes in trading practices and market structure which have taken place over the recent decades. It concludes by presenting new evidence on some of the most recent technological advances. Twenty-five years ago, most FX trading involved the telephone and all trading involved institutions: individuals were essentially shut out. Trading was opaque, there was a sharp division between interdealer trading and dealer–customer trading, and market concentration among dealers was low.
Today, only the least liquid corners of the FX market can still be described this way. In the liquid markets, telephones are obsolete. New electronic trading platforms have streamlined trade processing and settlement, reduced operational risks, and lowered trading costs. Lower trading costs have enabled the participation of retail traders and the adoption of new strategies such as high frequency trading—a form of computer-automated trading that relies on high execution speeds to make profits from small price movements. Since streaming real-time prices are now available to virtually all participants, these markets are now regarded as transparent. On some of the new platforms, any trader can provide liquidity, so the division between dealers and their most sophisticated customers is, at times, ambiguous. To remain competitive, the major dealing banks have made heavy investments in software and hardware, which has led to sharply higher concentration among market makers.
Given the pervasive influence of exchange rates, it is no surprise that the dollar value of trading activity in spot and forward FX market dwarfs most other economic measures (BIS, 2010). With daily average turnover estimated at $2.0 trillion, the market is 36 times larger than the combined exports and imports for the world's 35 largest economies, 16 times their combined GDP, and roughly 10 times exchange-traded equity turnover.
FX trading volume has exploded reflecting an electronic revolution that has lowered trading costs, attracted new groups of market participants, and enabled aggressive new trading strategies. Between 1998 and 2010, turnover in the FX market grew by over 250% (BIS, 2010). The associated 8.4% average annual growth rate far exceeds the contemporary 5.5% annual expansion of global real GDP (Table 1.1).
Table 1.1 FX Turnover and Growth: Comparison with Trade, GDP, and Equity Trading Volume
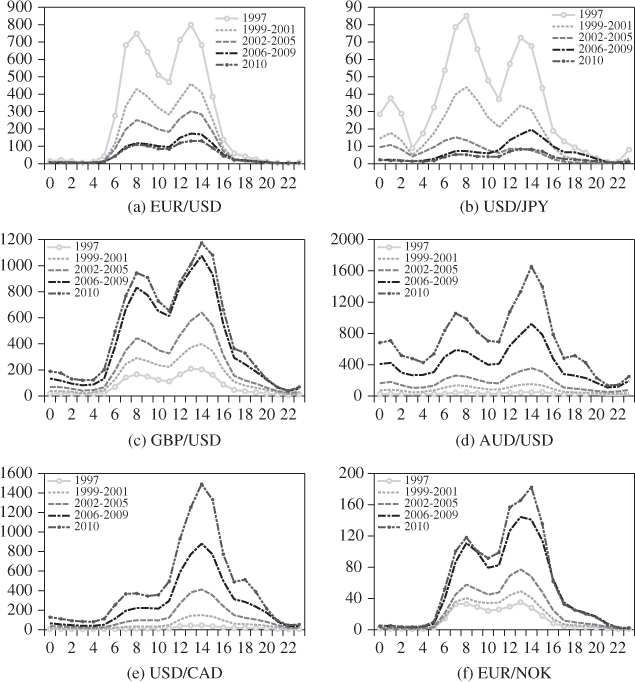
Many aspects of the FX market remain constant despite the electronic revolution. As has been true for decades, the markets remain decentralized with high liquidity and continuous trading (Lyons, 2001; Rime, 2003; Osler, 2009). As ever, the trading day begins when dealers arrive for work in Australia and Asia. Activity then moves to Europe when markets open in Frankfurt, London, and Paris, and finishes late in the afternoon in New York. As always, there is no time during the day when the market formally closes, although there is a brief lull in activity between about 19:00 and 22:00 GMT, when most New York traders have gone home and most Sydney traders are still on their way to work (Figure 1.1). As ever, overall market liquidity is deepest when both London and New York are open, though liquidity for most individual currencies tends to be deepest during their local trading hours.
Figure 1.1 Average daily interdealer trading activity by the hour across different currencies. Note: The horizontal axis shows hour of the day (GMT) and the vertical axis shows the average number of trades. The five lines are for 1997, 4-year averages for 1998–2001, 2002–2005, and 2006–2009, respectively, and 2010. From example GBP/USD (c), we see the growth in number of trades since 1997. The exchange rates EUR/USD and USD/JPY are now primarily traded on the competing platform EBS, hence the decrease in number of trades from 1997 to 2010 for these two exchange rates. Source: Thomson Reuters Matching.
FX trading remains heavily concentrated in London, which captures over one-third of global trading, and New York, which captures almost one-fifth of trading (Table 1.2). London's traditional dominance in FX grew out of the United Kingdom's worldwide economic dominance in the nineteenth century. It remains secure at the beginning of the twenty-first century because of its geographic location: London's morning session overlaps with Asian trading and its afternoon session overlaps with New York's trading. Trading in the Asia-Pacific region, which in aggregate accounts for about one-quarter of global trading, is dispersed among Tokyo, Hong Kong, Singapore, and Sydney. Latin America, Africa, and the Middle East each account for less than 1% of global turnover.
Table 1.2 Geographical Distribution of Global Foreign Exchange Market Turnover (%)
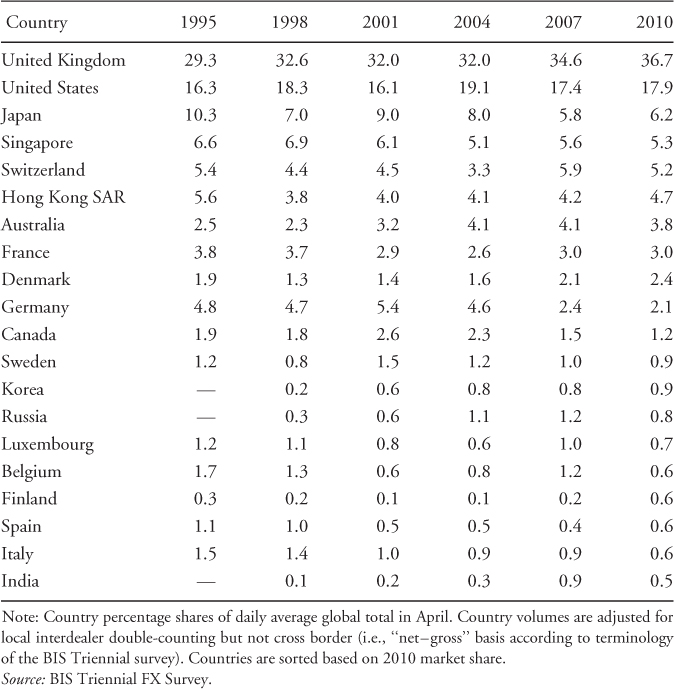
Despite the continued dominance of London and New York, there have been some subtle shifts in the global distribution of currency trading. The advent of the euro (EUR) brought a decline in the share of European trading outside of London. Meanwhile, rapid economic growth in Asia has supported a surge in trading in the Asian regional centers. Hong Kong and Singapore now vie in importance with traditional European centers such as Switzerland and France.
Another unchanging aspect of the FX market is the dominance of the US dollar (USD), which is still involved on one side of roughly three-quarters of all spot transactions (Table 1.3).1 The dollar's dominance reflects the market's practice of trading minor currencies via a major currency (called the vehicle currency). A trade from Mexican pesos (MXP) to Australian dollars (AUD), for example, would typically involve two trades, one from MXP to USD and the second from USD to AUD. This “vehicle” trading through the major crosses concentrates liquidity in a narrower range of currency pairs, reducing overall transaction costs.
Table 1.3 Currency Distribution of Spot Turnover (%)
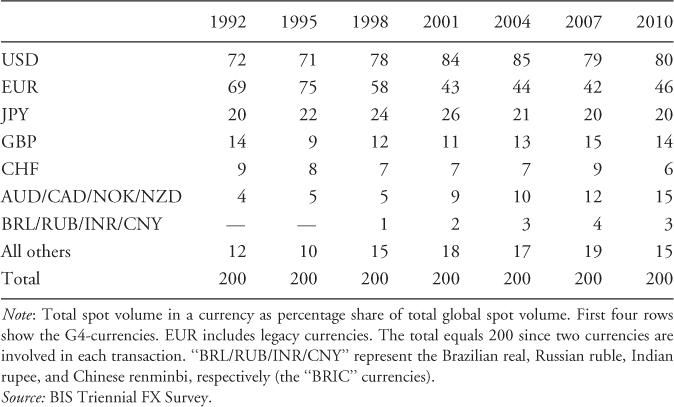
The EUR is involved in 46% of trades, in part because it serves as the vehicle currency within the eurozone.2 The next most actively traded currencies are the JPY (20%) and the UK pound (GBP, 14%). Together, these four currencies are known as “the majors” (or G4).3
The next tier below the majors comprises the AUD (7.5%), the Swiss franc (CHF, 6.2%), and the Canadian dollar (CAD, 5.2%). A notable recent shift is the rising share of the so-called commodity currencies, specifically the AUD, CAD, NOK, and the New Zealand dollar (NZD). These currencies' combined share rose from 7% in 1998 to 16% in 2010.
The share of emerging-market currencies rose sharply in the 1990s but has been fairly stable around 18% since then. Nonetheless, currencies from the most advanced emerging markets, such as the South Korean won (KRW) and Hong Kong dollar (HKD), have more than doubled their market share since 1998 and now rival the Swedish krona (SEK). Turnover in more recently emerging countries, such as Turkey, Thailand, Brazil, and India, has grown even faster.
The conventions governing the quotation of different currency pairs have also been fairly stable over time. Most exchange rates are expressed as units of a given currency required to purchase 1 USD. The exceptions are the EUR, the GBP, the AUD, and the NZD, which are quoted as the base currency (i.e., EUR/USD = USD per EUR). Most exchange rates are quoted to five significant digits, with the final (or smallest) digit known as a “pip.”4
The dominance of spot FX trading is another area of relative stability.5 Daily spot turnover in 2010 was $1.5 trillion while turnover in outright forwards was far lower, at $0.5 trillion (BIS, 2010). A number of other currency-related instruments—FX futures, currency options, FX swaps, and currency swaps—swell total daily turnover in FX market beyond $4.0 trillion (Table 1.4).6 These assets are traded entirely separately from spot and forward contracts and for entirely different purposes, so they generally have little influence on exchange rates and are not discussed in this chapter.
Table 1.4 Instruments Traded in Global FX Market
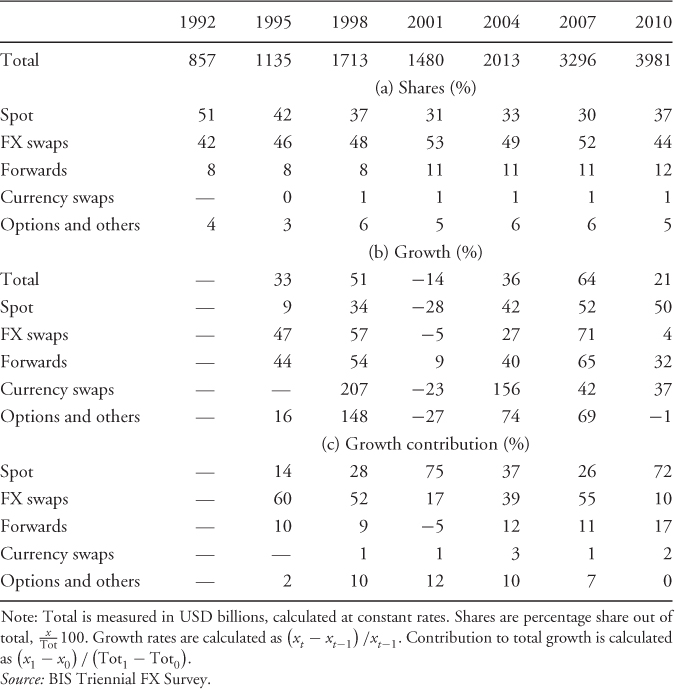
FX swaps deserve some discussion, however, because of their immense average daily turnover of $1.8 trillion. Like repos in the fixed income markets, FX swaps are primarily used for overnight position management by banks. Collapsing swap volumes following the Lehman Brothers bankruptcy in late 2008 triggered a rapid expansion of central bank swap activity, as authorities tried to stabilize the world banking system (Baba and Packer, 2009; Melvin and Taylor, 2009). In 2010, FX swap trading activity remained below its previous peak.
The vast majority of FX trading is essentially unregulated, in striking contrast to the extensive regulations in most equity and bond markets.7 Governments have learned through experience that dealers will simply move elsewhere if they are regulated. In the 1960s, for example, bond dealers moved offshore when the US government attempted to regulate the foreign issuance of USD denominated bonds in the domestic market.
Some well-known regulations in other asset markets are missing in FX market. Their absence is not a problem because of unique features of the FX market. Short-sales restrictions, for example, though severe in most developed equity and bond markets, cannot even be defined in this asset class because the sale of one currency is simply the purchase of another. Other practices that are illegal on most organized exchanges are discouraged in FX by market conventions and best practices. For example, front running of customer orders is widely considered bad practice even though it is not illegal.8 Fortunately, the FX market is sufficiently liquid that significant manipulation by any single actor is all but impossible during active trading hours for the major currencies.
Since FX market are subject to minimal regulation, they are also subject to minimal reporting requirements, which explains the scarcity of aggregate data on FX trading. Although equity trading volume is a staple on the evening news on any given day, no one knows how much was traded in FX market—not the regulators, not the monetary authorities, and not even the major FX dealers. The only comprehensive information source is the Triennial Central Bank Survey of FX Market Activity, a joint effort of central banks around the world, coordinated every third year in April by the Bank for International Settlements (BIS).9 In the absence of official sources of high frequency data, most research on currency trading relies on proprietary data from banks and brokers.
A key goal of exchange rate economics is to understand currency returns. Exchange rates, like asset prices, more generally, move in response to new information about their fundamental value. Over the past decade, microstructure research has revealed that this “price discovery” process involves different categories of market participants. Each participant's distinct role is determined by (i) whether the agent is a liquidity maker or taker and (ii) the extent to which the agent is informed.
The original FX market participants were traders in goods and services. Currencies came into existence because they solved the problem of the coincidence of wants with respect to goods. Most countries have their own currencies, so international trade in goods requires trade in currencies. The motives for currency exchange have expanded over the centuries to include speculation, hedging, and arbitrage, with the list of key players expanding accordingly. Beyond importers and exporters, the major categories of market participants now include asset managers, dealers, central banks, small individual (retail) traders, and, most recently, high frequency traders.
“Dealers” or “market makers” emerged naturally to fulfill the search function among trading counterparties. Dealers stand ready to trade with anyone needing FX at a moment's notice. To initiate an FX trade, an agent calls a dealer indicating the currency and quantity she/he wishes to trade and asking for the price. The dealer states a price at which she/he is willing to buy (the “bid”) and a price at which she/he is willing to sell (the “ask”). Finally, the customer decides whether to buy, sell, or pass. The dealer is compensated for the burdens of liquidity provision, such as bearing inventory risk and screening agents for credit quality, by a favorable gap between the quoted buy and sell prices, the “bid–ask spread.” Markets of this structure, known as “over-the-counter” (or OTC) markets, have arisen naturally in contexts including municipal and corporate bonds, derivatives, and equities. Although OTC dealers are under no formal obligation to provide liquidity, they tend to be reliable because otherwise their reputation—and potentially their market share—will suffer.
Existing theory indicates that information is brought to the market by liquidity takers rather than market makers. Among liquidity takers in FX, the evidence indicates that information relevant to short horizons comes from financial customers, especially leveraged investors. Information does not come from firms involved in international trade, small individual traders, or governments/central banks (Bjønnes et al., 2005, 2011; Evans and Lyons, 2006; Nolte and Nolte, 2009; Osler and Vandrovych, 2009; King et al., 2010). To identify whether some category of participant is typically informed, it is standard to examine whether their trades anticipate FX returns. If an agent consistently tends to buy (sell) before prices rise (fall) and the subsequent price change tends to be at least partially permanent, researchers infer that the agent was trading based on information about the asset's fundamental value. Academic studies have long indicated that FX dealers are informed. But, until recently, both theory and practice assumed that this information originated entirely with end-customers (Evans and Lyons, 2002). It is now recognized that dealers bring their own independent information to the market (Bjønnes et al., 2011; Moore and Payne, 2011).
Traditionally, the end-customers routinely needing FX liquidity were non-dealer financial institutions on one hand, and corporations and governments on the other. Over the last decade, the set of active FX end-users has been augmented by retail investors and by computer-automated traders known as algorithmic traders.
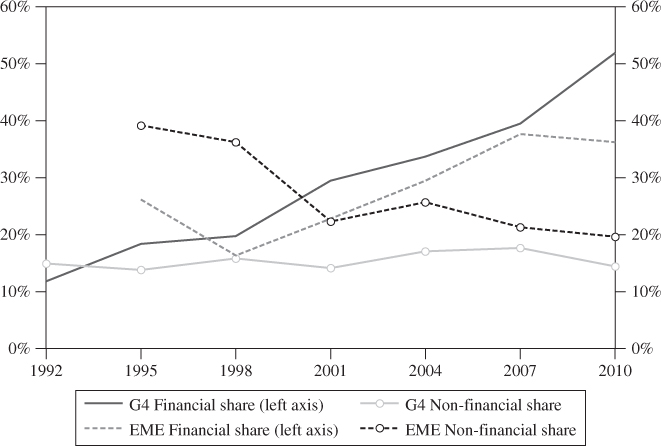
Until the mid-1980s, non-dealer financial institutions, corporations, and governments each traded roughly equal amounts with their FX dealers. Since then trading by corporate customers and governments has maintained an overall market share of 17% on an average, though this share naturally rises and falls with economic activity. During the recessions of 2001 and 2010, for example, their share of activity fell to 15%. The share of financial trading in total trading, by contrast, rose steadily from 20% in 1998 to over 50% in 2010 (Figure 1.2). This trend partly reflects the rapid growth of trading on retail trading platforms,10 which reached an estimated $125 to 150 billion per day in 2010, equivalent to 8–10% of global spot turnover (King and Rime, 2010). It also reflects rapid growth in algorithmic trading, especially, high frequency trading. Although data on the extent of algorithmic trading are limited, the survey reported in Section 1.1 suggest that it now accounts for between one-third and one-half of trading in the most liquid currencies.
Figure 1.2 Rising share of financial turnover. Note: Figure shows the share of financial customers (left axis) and non-financial customers (right axis, dot symbols) out of total spot trading. Third group not shown in graph is dealers. G4-currencies (solid lines) are USD, EUR (DEM before 1999), JPY, and GBP; emerging-market currencies (dashed lines) are MXN, KRW, RUB, PLN, TRL, TWD, INR, HUF, ZAR, and BRL.
Financial institutions are a diverse category that includes hedge funds and other asset managers, regional and local banks, broker–dealers, and central banks. Relative to corporate customers, financial institutions trade larger amounts and hold FX positions for far longer. Financial institutions tend to be better informed than other end-users, because they have strong incentives to invest in information acquisition. Since financial institutions use currencies primarily as a store of value, they gain or lose according to changes in the currency's value.
Among financial institutions, leveraged institutional investors—meaning mostly hedge funds and their close cousins the commodity trading advisors (CTAs)—appear to be best informed. This finding seems logical since leveraged institutional investors face particularly intense incentives to acquire information. Hedge-fund managers are often paid 2% of underlying assets as a flat annual fee and 20% of investment returns. Leveraged currency funds, which grew dramatically during the late 1990s, are known to favor well-defined speculative strategies focused on four factors: fundamentals, interest differentials (i.e., the carry trade), momentum, and volatility.
Unleveraged asset managers (“real-money investors”) include mutual funds, pension funds, endowments, and insurance firms. Perhaps surprisingly, such funds often pay little attention to the exchange rate component of returns when choosing asset allocations (Taylor and Farstrup, 2006). Instead, they concentrate on maximizing expected returns to foreign assets measured in the asset's home currency. This approach may be rational given ample evidence that major exchange rates are well approximated by a random walk. Some real-money investors outsource the management of FX exposures to currency overlay managers, who focus on risk reduction, return maximization, or some combination of the two.
FX hedging has become more important among portfolio managers since the financial crisis (Melvin and Prins, 2010). Market participants report that it is common to adopt a 50% hedge ratio, with the hedge reset periodically (e.g., once a month). A 50% ratio minimizes “embarrassment risk,” meaning the risk that a firm incurs either an absolute loss (when the rate moves adversely on an unhedged position) or an opportunity loss (when the rate moves favorably on a fully hedged position).
Private financial institutions dominate financial trading on a day-to-day basis, but central banks are noteworthy participants nonetheless. When these public sector institutions intervene to influence exchange rates, their trades are considered informed. Major dealing banks ensure that they know of such trades by cultivating their relationships with central banks. For example, dealers may share market intelligence on a daily basis with these valued clients. Central banks also trade FX as part of the regular procurement process for military and other government functions. Such trades are not considered informative, and central banks often ensure that such trades are not confused with intervention by announcing them in advance.11
Corporate customers use FX market to support treasury operations associated with their core business activities such as mining, shipping, and manufacturing. As such, corporations primarily use foreign currencies as a medium of exchange, trade relatively small amounts, and hold these positions only briefly. Most corporate customers choose not to engage in speculative FX trading; indeed some firms explicitly prohibit it. Given their institutional goals, this restriction seems logical. FX forecasting is not among a corporation's “core competencies,” so cultivating in-house speculative expertise can be ill-advised (Goodhart, 1988). Further, creating a trading operation is expensive. Not only it is costly to hire currency analysts and traders but also it is expensive to hire the extra staff required to protect against “rogue trader risk,” meaning the risk that a single trader brings down the firm (Osler, 2009).12 Even corporate firms that hedge their foreign cash flows pay little attention to future exchange rate movements. A survey by Bodnar et al. (1998) finds that among corporations that hedge their exposures—as most do—they typically choose hedge ratios between 40% and 50% and favor maturities below 6 months. They also review their currency hedge ratios at most a few times each year. Since corporate customers generally choose not to engage in speculative trading, it is not surprising that their trades do not anticipate short-term returns and are, therefore, not considered informative.
Corporations typically only use the FX market for one side of each exposure. A US multinational needing EUR to pay taxes in Germany, for example, sells its USD to buy the EUR in the FX market but then delivers the currency directly to the German government, bypassing the FX market entirely. Similarly, a Japanese exporter of manufactured goods to the United States receives USD from the American importer and then sells those USD in the FX market.
Historically, few private individuals have had sufficient net worth to qualify for a credit line at a FX dealing bank. This barrier to entry effectively made the FX market an entirely wholesale market. Trading by small investors was also discouraged by the relatively high bid–ask spreads on small trades, meaning those below $1 million. Retail investors gained access to FX market around the year 2000 with the arrival of internet-based trading platforms tailored to their unique needs, so-called “retail aggregators” (RAs, described below).
Retail investors primarily trade FX spot in the major currency pairs, although the number of emerging-market currencies offered is growing. These individuals or small institutions tend to focus on just one or two currencies and to hold positions for very short time horizons, typically under a day. According to a recent survey (CitiFX Pro, 2010), these traders find the FX market attractive in part because of its low correlation with other markets, its high liquidity, and its 24-h market.
Retail traders should have strong incentives to be informed, since they trade for speculative purposes and employ substantial leverage. The evidence indicates, however, that retail trades are not informed. Their trades do not generally anticipate exchange rate returns (Nolte and Nolte, 2009) and the retail traders themselves are generally unprofitable (Heimer and Simon, 2011). In 2011, Oanda.com claimed that 48% of their retail customers were profitable. A systematic lack of trading acumen also appears to characterize retail traders in equities (Barber and Odean, 2000, 2002; Linnainmaa, 2010). Well-documented forces that might drive traders to stay active even when losing money include wishful thinking and overconfidence (Oberlechner and Osler, 2012).
Algorithmic trading is a form of electronic trading where a computer algorithm (or program) determines an order-submission strategy and executes trades without human intervention (Chaboud et al., 2009). Human involvement is limited to designing the algorithm (or algo), monitoring it, and occasionally adjusting the trading parameters. Some algorithms simply automate existing strategies—for example, they break up large trades to minimize transaction costs—while others take advantage of superior execution speeds such as high frequency trading.
High frequency trading relies on a technological advantage to exploit small price discrepancies across different online trading platforms. The time to execute a high frequency trade is measured in milliseconds (where it takes 100 ms to blink). Speed is so essential that high frequency traders co-locate their computer servers as geographically close to the pricing engines of leading electronic trading platforms as possible. Popular high frequency strategies include triangular arbitrage and covered interest rate arbitrage. More commonly, high frequency traders simply pick off dealers' posted quotes that are briefly out of line with the market due to slight time delays between trade instructions and execution (known as price-latency arbitrage).
Historically, liquidity in currency markets was provided exclusively by the bigger commercial and investment banks. Over the past decade the spectrum of formal liquidity providers has expanded to include global custodial banks, retail aggregators, and high frequency traders. The rest of this section discusses each agent type in detail.
As they have for decades, FX dealers earn income by taking speculative positions and by providing liquidity to customers. Speculation is typically the responsibility of interbank traders, whose positions are only held open a few minutes or hours, and proprietary traders, whose positions are held open for longer periods (Bjønnes and Rime, 2005). Salespeople, who are responsible for maintaining good relationships with customers, are the third major group on a trading floor. To align the interests of FX dealers with those of bank shareholders, dealers receive bonuses tied to their individual profits and the profits of the entire trading floor while their individual risk-taking is constrained by position and loss limits.
Historically, the largest dealing banks earned substantial revenue from both speculative trading and liquidity provision for customers; the smaller dealing banks, by contrast, primarily earned income from customer service (Mende and Menkhoff, 2006). Since the 2007–2009 global financial crisis, proprietary FX trading activity has shrunk dramatically, discouraged by intensified regulatory scrutiny and a smaller appetite for risk. A few top dealers now report that liquidity provision for customers is their biggest source of FX revenue.
When not servicing customers, dealers have historically preferred to trade on the fast and inexpensive interdealer market. In the 1980s and early 1990s, interdealer trading represented over 60% of spot FX trades. In recent years, this fraction (the residual of the two shares presented in Figure 1.2) has declined steadily, and it was most recently estimated at only 35% (BIS, 2010). Reasons for this decline are discussed at length in Section 1.3 and include greater market transparency and heightened efficiency in matching trades electronically.
Interdealer trading can be carried out either directly in the OTC market or indirectly via FX limit-order markets run by FX brokers (Lyons, 1995). In OTC markets, all trades take place through designated market makers. In limit-order markets, no agents are specifically tasked with providing liquidity. Every agent can either supply (“make”) liquidity by placing a limit order or demand (“take”) liquidity by entering a market order. Limit orders indicate the prices at which an agent is willing to buy (bid) or sell (offer/ask) a specific quantity. The set of outstanding limit orders, which represents the existing liquidity supply, is known as the limit-order book. Orders remain in the limit-order book until executed or cancelled. The best bid or ask prices are known as the quotes, and the quantity available at the quotes is the market's “depth.” Trades occur when another dealer indicates that she/he wishes to trade immediately by placing a “market order.” Market orders are executed against limit orders in the book, beginning with the best-priced limit order and, for large quantities, moving to limit orders with successively less attractive prices.
Interdealer bid–ask spreads in the major currencies are typically 0.5–2.0 pips; those on less liquid currencies, particularly those with exchange controls, can reach 40 pip (Osler et al., 2011). These spreads, like spreads in equity and bond markets, are influenced by inventory risk, as indicated by the positive cross-sectional relation between average spreads and average market volatility (Bollerslev and Melvin, 1994). Nonetheless, the forces that drive FX interdealer spreads vary in striking ways from those that drive equity and bond spreads. FX interdealer spreads are highest during the short overnight period when trading is light and volatility is low. By contrast, spreads in equity and bond markets are typically highest at the market open, when trading and volatility are highest. This difference has been traced to the absence of regulation—and specifically the absence of formal opening and closing hours—in FX (Osler and Yusim, 2009).
Historically, dealers preferred to have zero inventories, so after trading with a customer, the dealer typically passed any accumulated inventory quickly onto other dealers (Lyons, 1995; Bjønnes and Rime, 2005). On the basis of pre-2000 data, estimated inventory half-lives range from a minute for dealers at large banks (Bjønnes and Rime, 2005) to 12 minutes for dealers at small banks (Osler et al., 2011). In recent years, these speeds have come down sharply because of the advancement in electronic trading technologies. If a dealer passed inventory to another dealer, that second dealer typically laid the position off on yet another dealer in a process known as hot-potato trading (Lyons, 1997). In other words, the position continued to move until some dealer laid the risk off onto its own customers. In this respect, the FX market differed from some other OTC markets, such as the US municipal bond market or the European government bond market, where dealers “warehouse the risk” and eliminate the inventory via later customer trades, shading their quoted prices to attract trades in their preferred direction (Dunne et al., 2008).
Dealers are perhaps the best-informed agents in FX market. Not only does their order flow anticipate returns (Rime et al., 2010) but it does so better than the trades of any individual group, including leveraged investors (Osler and Vandrovych, 2009). This advantage is thought to reflect, at least in part, the dealers' extensive networks of financial customers. If so, then larger dealers should be better informed than smaller dealers, a prediction that is supported by evidence (Bjønnes et al., 2011).
To increase the amount of customer information coming their way, dealers have historically quoted narrower spreads for larger trades and for financial-customer trades (Ding, 2009; Osler et al., 2011). This pattern is the opposite of that observed in prominent equity markets such as the NYSE. As discussed in Osler et al. (2011), these dealer choices could also be influenced by fixed operating costs and the dealers' stronger bargaining power relative to their least informed customers.
Recent evidence suggests that dealers generate some market-relevant information independently of their customers (Bjønnes et al., 2011). Consistent with this, Moore and Payne (2011) find that dealers specializing in liquid dollar rates can forecast both order flow, which is known to drive returns, and the component of returns that is uncorrelated with flow.
Large asset managers typically hire administrators or “custodians” who track their assets, calculate portfolio values, process dividend and interest payments, buy and sell assets, and settle trades. When they need to trade foreign currencies, real-money investors typically do not contact the major banks. Instead, they trade with their custodian, motivated largely by administrative efficiency (DuCharme, 2007).
Consistent with standard practice in the broader FX market, custodial FX trades are handled on a principal basis. Global custodians thus provide a second layer of FX market-making services. The custodian provides liquidity to its clients and, in turn, counts on receiving liquidity from its regular dealing banks. The custodian charges its clients a mark-up over the prices it pays in the interbank market.
Bid–ask spreads on custodial FX trades average a striking 30–40 basis points more than interbank spreads (Osler et al., 2011). This has been traced to the relative opacity of these trades. Typically, when a fund manager instructs its “fund accountant” at the custodian to buy or sell a foreign asset, the order includes instructions to carry out any required FX transactions. As a consequence, the custodian's client gets very little information about the trade; it learns the price actually paid with a delay of days or even weeks and it learns no information at all about the time of the trade or the effective bid–ask spread. This opacity makes it difficult for the fund to monitor execution quality.
In recent years, institutional investors have focused much more on the costs of their FX trades. Transaction cost analysis (TCA) is a growing business and increasingly a requirement for pension funds and other fiduciaries.
Research has not yet examined whether the interbank trades of global custodians are informed, but this could well vary across custodians. Small and mid-sized custodians typically focus exclusively on customer service and their customer trades may not be highly informative since they serve few leveraged investors (Osler et al., 2011). The custodial business has become increasingly concentrated, however, and some large custodians intentionally gather market-relevant information from customers to support speculative position-taking (Ramadorai, 2008).
In recent years, the emergence of retail FX trading was enabled by the development of a new type of financial intermediary, the retail aggregator (RA). Retail aggregators exclusively operate over internet-trading platforms, bundling small retail trades into larger trades that can be conveniently handled by dealing banks. Some retail aggregators act purely as FX brokers, matching retail trades with quotes from banks. Other retail aggregators combine a broker model with a dealer model; they match some trades but strategically act as the counterparty for others. Retail aggregators typically provide their customers with leverage, which can range up to 200%. They protect themselves against default by insisting that each retail customer posts an initial cash deposit (“margin”). When a trade is executed, the retail aggregator settles it against the margin in the customer's account. When the margin in the retail customer's account is exhausted, the retail aggregator liquidates the retail customer's positions and closes the account immediately. This behavior allows retail aggregators to avoid taking on credit risk from their customers, who must therefore monitor their own trading activity closely.
For exchange rate modeling, it is important to know not only just which agents bring information to the market but also how their information becomes embedded in the market price. In FX market, this process appears to have at least three steps. First, end-customers reveal their information to market makers indirectly by trading with them. Second, the information becomes embedded in interdealer prices. Third, the information is disseminated widely as quotes in the customer segment of the FX market are adjusted to reflect the new interdealer prices.
The process through which dealers learn information from their customers has already been described. To examine the next step in this process, consider how a dealer adjusts her position after providing liquidity to a customer. As discussed earlier, a dealer who has bought currency from a customer then sells that currency in the interdealer market. The dealer will be especially anxious to trade quickly and aggressively after trading with informed customers (Bjønnes et al., 2011; Osler et al., 2011). An informed customer's purchase implies that the price is likely to rise. If the dealer is short the appreciating currency as a result of the trade, the inventory position represents a bad risk. If the customer is uninformed, however, the dealer has no strong reason for trading aggressively, as there is a 50–50 chance that the associated inventory position will be a winner.
Consistent with this hypothetical dealer behavior, Osler et al. (2011) provide evidence that, after customer trades, dealers are more likely to trade aggressively and in the same direction as the customer if the customer is informed. Similarly, Bjønnes et al. (2011) provide evidence that dealers with larger networks of financial customers tend to trade more aggressively, on average. By contrast, the average aggressiveness of dealer trades is not influenced by the extent of their trading with corporations or governments.
To connect this dealer behavior to price discovery, note that when a dealer sells aggressively, she trades at the lower, less attractive bid price. The downward movement of the interdealer price is consistent with the information implied by the initial informed-customer sale that the price is likely to decline. The interdealer price thus naturally moves to embed the information brought to the market by end-customers. The price shift can be sustained, because other dealers move their own quotes in parallel when they observe the interdealer trade (Goodhart et al., 1996). The interdealer price shift will immediately influence the prices quoted to customers, because these are typically set as a mark-up relative to the interdealer price.
The contemporaneous relationship between daily FX returns and order flow provides evidence consistent with this view of price discovery. (Order flow is defined as the net of aggressive buy trades and aggressive sell trades.) This relationship is positive for financial customers, as one would expect since their individual buy (sell) trades are typically followed by price rises (declines). Dealer order flow also has a positive contemporaneous relationship with daily FX returns.
Since corporate customers are generally uninformed, the price discovery process just described should imply that FX returns are unrelated to corporate order flow. But the contemporaneous relationship between FX returns and corporate order flow is actually negative. That is, on days when corporate customers are net buyers (sellers) of a currency, FX returns are negative (positive) (Bjønnes et al., 2005; Evans and Lyons, 2006; Lyons, 2001; Marsh and O′Rourke, 2005).
The intraday response of corporate customers to changing currency values explains the negative contemporaneous relationship with daily FX returns. Corporate customers are motivated to buy imports inexpensively or to sell exports lucratively. Once a currency has declined in value, imports are less expensive; after a currency gains in value, the effective mark-up on exports is higher. Thus, changes in exchange rates elicit trading responses from corporate customers. Corporate customers can respond nimbly, even though they do not normally monitor the market closely, by using “take-profit” orders, effectively hiring the dealer to monitor the market for them (Osler, 2003, 2005).13
Because of their different trading motivations, financial and corporate customers appear to play different roles in exchange rate determination. Sager and Taylor (2006) use a “push-pull” metaphor. When push agents sell a currency to FX dealers, the currency typically depreciates. The depreciation serves to “pull” other agents into the market as buyers. This process has a similar flavor to the model suggested by Evans and Lyons (2002), though their “push” agents are uninformed financial customers and their “pull” agents are risk-averse investors. The evidence suggests, instead, that the push agents tend to be informed financial customers and the pull agents tend to be non-speculative traders.
Corporate customers can also be viewed as unintentional providers of “overnight liquidity” to the market. Dealers provide “immediate liquidity,” trading with customers on the assumption that the associated inventory can be off-loaded within the day. But since FX dealers typically end the day with zero inventory, if some end-customers are net buyers on a given day, other end-customers must be net sellers, and vice versa. This second group of customers effectively provides overnight liquidity. The evidence reported above suggests that financial customers tend to demand overnight liquidity and corporate customers tend to supply it.
This analysis of liquidity provision has two key implications for the design of exchange rate models. First, models must include non-financial agents and speculative agents (“investors”). Second, models cannot focus on stock holdings of currencies. It has long been thought that models based on stock positions are equivalent to models based on flows, since flows are simply the first difference of stocks. However, not all flows matter for exchange rate determination. Exchange rates are only influenced by the flows that pass through the currency markets. As noted earlier, currency-market flows include only half of the currency flows generated by corporate customers: when such agents open and then close a FX position, only one leg of the round trip involves the FX market. In short, the first difference of currency holdings are not equivalent to the flows that drive exchange rates, so stock equilibrium models do not conform to critical aspects of the exchange-rate determination process.
The electronic trading revolution in FX has transformed the market's structure while improving market quality in terms of transparency and transaction costs. This section describes this transformation, which proceeded in two stages. In the first, electronic trading platforms essentially replaced the telephone. In the second stage, market participants developed previously unanticipated ways to exploit the new technology.
To help clarify the structures, Figure 1.3 provides a stylized depiction of the FX market structure at different points in time. In each frame, the interdealer market is represented by the shaded box and the customer market is the area outside the shaded box. Channels for transacting FX are numbered arrows. Solid lines represent voice channels for trading over the telephone; dotted lines represent electronic execution methods.
Figure 1.3 Evolution of FX market structure. Note: D, dealer; C, client; VB, voice broker; EB, electronic broker; PB, prime broker; MBT, multibank trading system; SBT, single-bank trading system; RA, retail aggregator. Solid lines represent voice execution methods. Dashed lines represent electronic execution methods.
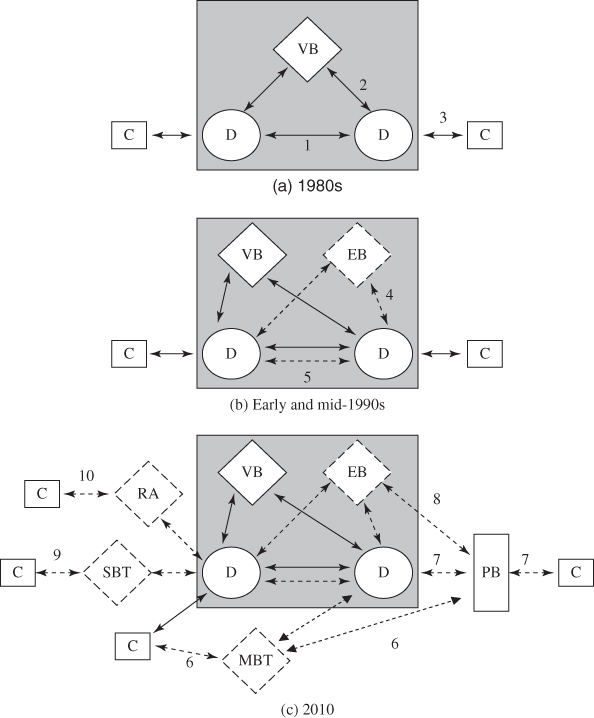
Currency trading was a sleepy business before exchange rates began floating in the early 1970s. As the business took off, FX trading in the OTC market was handled via telephone lines. Figure 1.3(a) provides a stylized depiction of the market during this period. A customer (C) wishing to trade would call an FX dealer (D) and ask for his current bid and ask quotes. On the basis of the quotes the customer would decide whether to buy the base currency, sell it, or “pass” without trading. Confirmation involved the physical exchange of paperwork between the two back offices. This back-office processing was cumbersome and prone to human error.
In the interdealer market, dealers could call each other directly (line 1) or they could remain anonymous by placing an order with a voice broker (VB) (line 2). The VBs shouted the best available bid and ask prices into open multi-party phone lines that ended in small speakers known as squawk boxes on the desks of each dealer. Some emerging-market currencies that are relatively illiquid are still traded this way.
The FX market were fairly opaque during this period, since information about FX trades was proprietary to the two counterparties. The only market-wide source of information was the ongoing announcement of quotes by the voice brokers. Major banks had small networks with implicit agreements to quote tight bid–ask spreads, while smaller banks paid wider spreads. To gather information, dealers often called each other asking for quotes, a practice that required them sometimes to trade. Dealers would also do hot-potato trading as described earlier. For these and other reasons, interdealer trading exceeded half of all trading.
Electronic trading platforms first transformed the interdealer market during the late 1980s and then reached the customer market in the 1990s. Most of these early computer systems merely replaced the telephone, leaving the dealer–customer relationship largely intact.
In 1987, Reuters launched a system for bilateral trades between dealers now known as Thomson Reuters Dealing (line 5). Although, in principle, it merely replaced telephone conversations with typed messages, it was speedier and more efficient for the dealers and it enhanced operating efficiency by creating electronic trading records. It quickly became the dominant tool for interdealer trading (Rime, 2003).
Transparency in the interdealer market was enhanced by a roughly contemporary Reuters product, the “FXFX” page. This computer page was essentially a screen that provided dealers' indicative quotes for liquid currencies in real time. It thus served as a one-stop-shop for up-to-date price information from many dealers. For roughly a decade, FXFX was the dealers' main source of FX price information for the most liquid currencies.
In 1992, Reuters introduced the first electronic limit-order market to FX, now known as Thomson Reuters Matching. Other banks, worried that Reuters might monopolize interdealer trading, formed a consortium and introduced another such platform a year later, the Electronic Broking Service (EBS). With the launch of these competing electronic brokers (EBs), dealers could now trade anonymously and electronically, as shown by line 4 in Figure 1.3(b). Dealers preferred the anonymity of these platforms to direct interdealer trading because it allowed them to work off positions without tipping off their competitors. A trader at, say, Deutsche Bank, would see the EBS screen but would not know the identity of the banks placing the limit orders (say, Citibank and RBS).14 Dealers also preferred these trading platforms to the voice brokers because they were faster and more operationally efficient.
By the end of the 1990s, the electronic brokers dominated interdealer trading in the liquid currencies. Owing to network externalities, liquidity naturally gravitated to just one platform for each currency. EBS has long dominated interbank trading for the EUR, JPY, and CHF, while Reuters dominates the GBP, AUD, CAD, and the Scandinavian currencies. Voice brokers remain important for less liquid currencies—which are not traded over electronic brokers—so in 2010, they still accounted for 10% of global spot FX trading.
The introduction of interdealer limit-order markets reduced trading costs for small banks, since the anonymous trading environment did not permit price discrimination. The electronic brokers also enhanced market transparency because limit-order prices are “firm,” so the brokers' best bid and ask quotes provided a more reliable signal of “the market” than the indicative quotes of the FXFX page. Post trade transparency was enhanced because the electronic brokers also reported trades more efficiently than voice brokers. However, the effect of electronic brokers on trading volume has been ambiguous. Electronic brokers match counterparties more efficiently and may have reduced passing of unwanted inventories among dealers (so-called hot-potato trading). On the other hand, by lowering execution costs, the electronic brokers may have encouraged more speculative trading.
The electronic revolution in FX encompasses trade processing and trading itself. In the late 1990s, the market came to recognize the dangerously high level of settlement risk, the most important operational risk in FX. For the largest FX dealing banks, exposure to even a single counterparty can exceed bank capital. Given the interconnected nature of the financial system, a failure to settle a large FX trade could trigger a string of defaults. Settlement risk arises because traditionally the transfer of the currency across borders occurs during the normal working hours of its home central bank. If one leg of a FX transaction settles before the other, the party still waiting for settlement faces the risk of counterparty default (Lindley, 2008). This risk was realized in 1974 when Germany's Herstatt Bank failed after markets closed in Europe but before their USD funds had been transferred to other banks. FX settlement risk is, therefore, commonly known as Herstatt risk.
Around 1997, a consortium of 74 banks began designing a new electronic settlement system that would address settlement risk. In 2002, “Continuous Linked Settlement” (CLS) Bank began operation (Galati, 2002). CLS Bank reduces Herstatt risk by settling both legs of every trade simultaneously. It also nets payments across member banks before transferring funds, a process known as multilateral netting. As a result, only 4% of the aggregate value traded must actually be transferred to complete settlement. CLS Bank has become an integral part of today's FX market. In 2010, it settled roughly 43% of spot FX transactions and it continues to expand the number of currencies it settles and its institutional membership.15 The success of CLS Bank in minimizing settlement risk was demonstrated by the smooth handling of FX trades following the bankruptcy of Lehman Brothers—a leading FX dealing bank—in September 2008.16
By the middle of the 1990s, bid–ask spreads on FX trades had narrowed in the interbank market but they remained unchanged for end-customers, enabling dealers to reap enhanced profits. This profitability spurred intensified competition for customer business and an explosion of new electronic trading platforms targeting customers. With the launch of these electronic trading platforms, the telephone became largely irrelevant to anyone trading liquid currencies. At the same time, the FX market's structure became complex and multilayered, defying easy classification.
As depicted in Figure 1.3(c), trading is now fragmented across many venues. The strict separation between the two tiers of the FX market—interdealer and customer—has broken down with the advent of multibank trading(MBT) systems (line 6) and FX prime brokerage (PB) (line 7). Prime brokerage is a dealer–customer arrangement that allows end-customers such as hedge funds to transact in the interdealer market, either directly (line 7) or via electronic brokers (line 8). Customers increasingly trade with dealers on proprietary trading systems, known as single-bank trading systems (SBT) (line 9). Meanwhile, retail aggregators are a new class of agents that allow retail customers to trade FX economically (line 10).
Electronic trading for end-customers began around 1996 when the global custodian State Street launched its proprietary electronic platform, FX Connect. This system simply replaced the telephone with an electronic connection and thus had no effect on either transparency or bid–ask spreads in the FX market. Nonetheless, it allowed State Street and its customers to handle trades more efficiently and with lower operational risk.
Around 1999, as the US dot-com boom was reaching its peak, a number of independent (non-bank) firms began a more momentous shift in FX market by launching electronic trading platforms for FX that targeted end-customers. These multibank trading systems allowed customers to directly trade with a range of dealers over proprietary computer networks (line 6). The first such platform, Currenex launched in 1999, extended the existing FX market in a natural direction. Instead of calling individual banks in sequence to find the best quote, customers could send a “request-for-quote” (RFQ) to many FX dealers simultaneously. Dealers were required to respond within a few seconds, and end-customers would then trade with the dealer of their choice. In 2000, State Street made FX Connect available to end-users beyond its own customer base, effectively turning it into a multibank trading system. Table 1.5 provides an overview of the leading multibank trading systems for FX.
Table 1.5 Overview of Largest Multibank Trading Systems for Customers
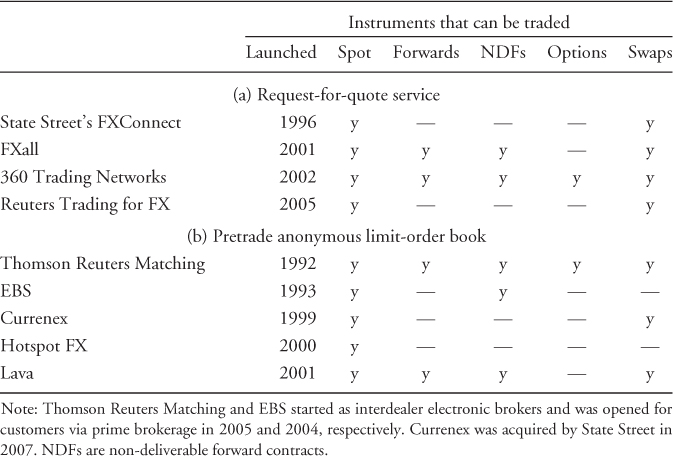
Other new entrants, such as Hotspot FX (launched in 2000) and Lava (launched in 2001), introduced electronic limit-order platforms directed at the customer markets, allowing end-customers to trade anonymously. These platforms permit end-customers to make liquidity—by placing limit orders—as well as to take it. Since the supply of liquidity from customers could potentially dry up at times, these platforms contract with dealers to stream continuous quotes.
The major banks responded to competition from these new entrants in a number of ways. First, dealers banded together to create their own competitive entrants. A consortium of banks created FXall, a major multibank request for quote system, in 2001. Second, existing platforms have acquired some of the independent platforms. Currenex, for example, was acquired by State Street in 2007 while Lava was acquired by FXall.
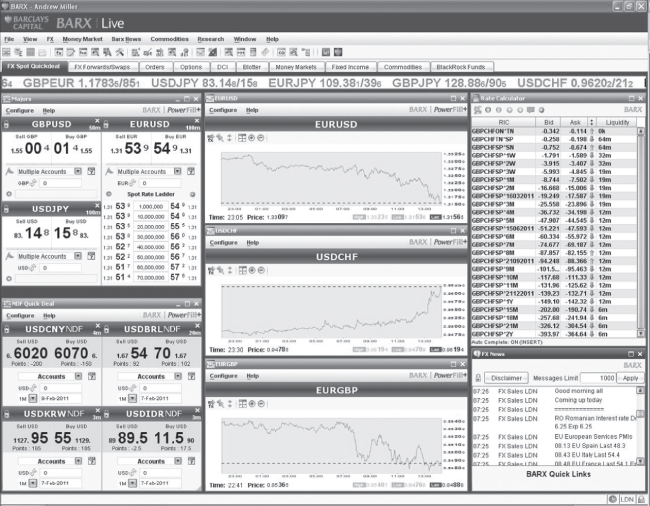
Most importantly, the major banks invested heavily in developing proprietary electronic trading platforms for their customers, known as single bank trading systems (SBT). UBS launched FX Trader in 2000, followed by Barclays' BARX in 2001. Deutsche Bank's Autobahn, developed in 1996 to allow real-time trading of US treasury securities, added FX trading in 2002. Goldman Sachs launched its offering in 2003. Citigroup was a relatively late arrival, launching Velocity in 2006. Some single bank trading systems allow customers to enter orders at the daily fixing price or for delayed dealing. On other systems, dealers provide “streaming prices” based on interbank quotes and their proprietary customer trades. Customers can tailor trades to their specific needs with just a few key strokes and buy spot FX at the click of a mouse. Figure 1.4 shows a screen print of Barclay's BARX, illustrating what customers typically see on such platforms.
Figure 1.4 Screenshot of the BarX platform of Barclays Capital. Note: From the “Sheet-bar” at top, we see all the instruments configured for trading in this particular screen. The upper left panel shows a window for spot trading, where we notice that the GBP/USD and the EUR/USD is quoted with five decimals, while USD/JPY is quoted with three decimals. Earlier, it was customary to quote with four and two decimals, respectively.
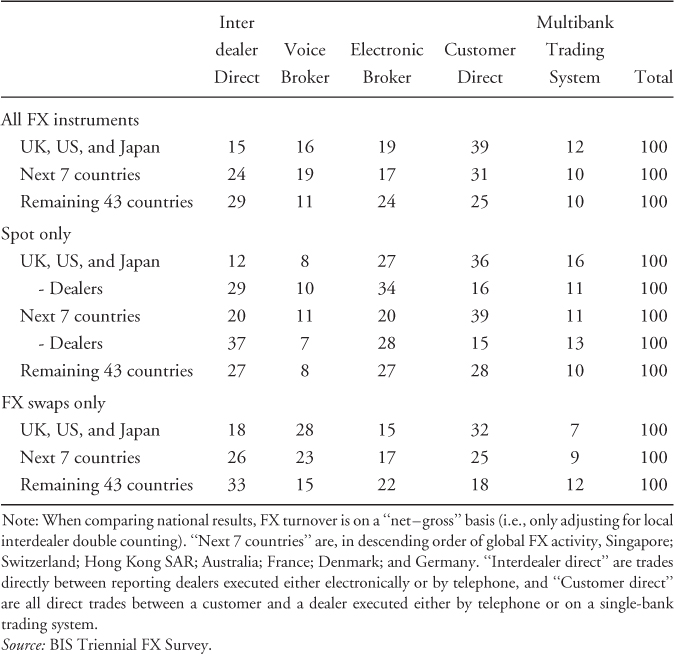
The advent of customer-focused electronic trading has brought a significant dispersal of trading across platforms, as shown in Table 1.6. In the 1980s, only three out of the five listed platform types were available; in the 1990s, electronic brokers became available for the interbank market, while today both dealers and customers trade side-by-side on several platforms.
Table 1.6 Execution Methods for FX Trading (% Shares)
The advent of electronic trading for end-customers has had welcome effects on most measures of market quality while simultaneously bringing a perhaps worrying increase in market concentration among dealers. We conclude this section by reviewing these consequences.
Pre-trade transparency is greater now that single bank trading and multibank trading systems stream prices continuously. Customers can now monitor developments in FX market directly rather than relying on their dealers. Pre-trade transparency has also been enhanced by the extensive real-time information about limit-order books available on some of the anonymous platforms. Hotspot FX, for example, presents prices and depth at every available level.
Most electronic systems permit customers to record market prices at the time of trade execution and the price impact of their trades. As a result, they can begin to carry out transaction cost analysis, a practice in which agents statistically examine their transaction costs to identify potential sources of efficiency. Transaction cost analysis is already common in equity markets, where it is generally considered essential to responsible asset management. In FX, this practice has not yet been widely embraced because it was infeasible until recently.
Electronic trading enables “straight-through processing” (STP), whereby trades entered electronically can likewise be cleared and settled electronically. Because straight-through processing involves no paperwork and little human intervention, it is almost error free and thus dramatically lowers operational costs and risk.
The introduction of electronic trading for end-customers quickly brought narrower spreads for them. In the 1980s and 1990s, when the FX market was opaque, the spreads paid by corporate customers on small trades were reportedly as large as 20 times interdealer spreads (Bjønnes and Rime, 2005; Goodhart et al., 2002). Even in 2001, corporate spreads on small trades were still three times interdealer spreads or more (Osler et al., 2011). By now, this difference in bid–ask spreads between the two FX market segments has almost disappeared.
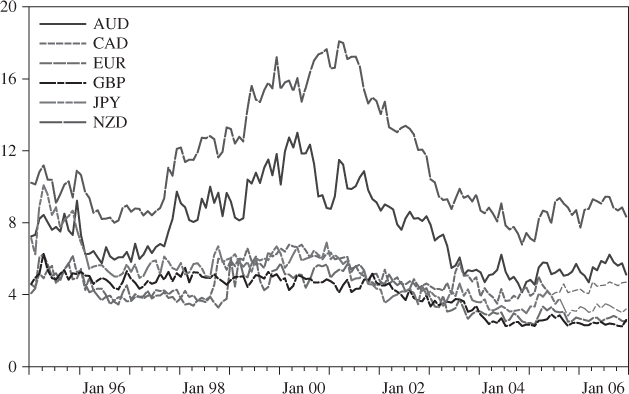
Customer electronic trading platforms have pushed down bid–ask spreads in the interdealer market, as well, by lowering dealers' operating costs. Lower operating costs, in turn, have meant that certain cross rates can now be traded directly at tight bid–ask spreads (e.g., EUR/AUD and AUD/JPY). As shown in Figure 1.5, interdealer spreads were on the order of 4-10 basis points in the mid-1990s, but within a decade, they had narrowed to roughly 2 pips (or $200 for a round trip transaction of EUR $1 million, which remains as the minimum trade size on electronic brokers). In some of the most liquid markets, such as EUR/USD, bid–ask spreads during active trading are often narrower than 1 pip. In 2011, one of the major interdealer brokers, EBS, moved to fractional-pip pricing but its competitor Thomson Reuters did not. While EBS is appealing to algorithmic traders, Thomson Reuters is responding to objections from its manual-trading customers, who prefer to see a greater depth of book on their screens.
Figure 1.5 Relative bid–ask spread by currency: January 1995–December 2006. Note: Bid–ask spread in basis points of midquote for several currencies against the USD. All relative spreads shown exhibit negative correlation with a time trend. Source: Olsen and Associates.
Bid–ask spreads in the custodial segment have, until recently, resisted the tendency to decline. Beginning in October 2009, a number of lawsuits were filed claiming that global custodian banks had overcharged clients on FX trades. The costs of non-negotiated FX trades by global custodians reportedly dropped by 63% in 2010 relative to earlier years (Diamond, 2011).
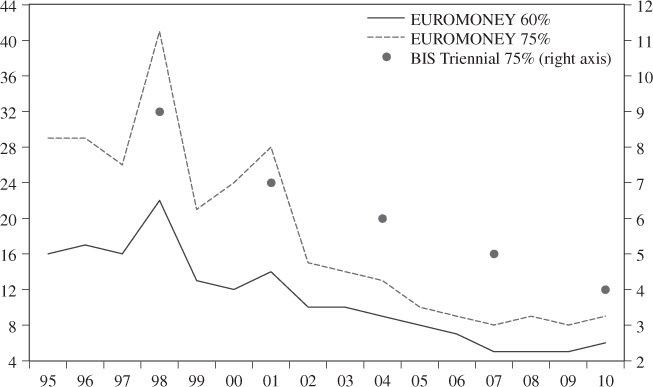
Customer electronic trading has prompted a striking increase in concentration among FX dealers (Figure 1.6). Because banks have been forced to invest heavily in trading technology even while quoting tighter bid–ask spreads, small banks now find it unprofitable to make markets in the major currencies. Between 1998 and 2010, the top three banks' share of FX trading rose from 19% to 40% as reported in the annual Euromoney survey. Despite this increasing concentration, small and regional banks continue to make markets in their local currencies, profiting from their local expertise and comparative advantage in the provision of credit to customers.
Figure 1.6 Market concentration. Number of banks covering x% market share. Note: Dots, measured on right axis, represents number of banks covering 75% of the market according to the BIS Triennial Survey. The dots are weighted average of a selection of 14 countries, where share of the total volume of these 14 countries is used as weight. Lines, on left axis, measure the number of banks covering 60% and 75% of the market using the annual survey by the Euromoney.
Once the telephone had been replaced by electronic connections, traders began to identify creative new ways to exploit the potential of electronic trading. Large banks have aggressively moved to internalize trades and to profile their customers. They also provide hedge fund customers with prime brokerage services and regional-bank customers with white labeling of their proprietary trading platforms. Meanwhile, independent proprietary trading firms have developed innovative ways of trading on electronic platforms, such as algorithmic trading.
Although many small banks have withdrawn from market making in the most liquid currencies, they ensure their customers have access to liquidity by providing the single bank trading platforms of major banks under their own name. This practice, called white labeling, has numerous advantages for the major banks. First, it lets them view the small banks' trading flows—and to extract any relevant information—without the expense of evaluating each counterparty's creditworthiness. It also provides major banks with a new revenue stream, supporting the investments required to develop their single bank trading systems. The extent of white labeling is indicated in Table 1.7, which shows that the combined market share of the three largest single bank trading platforms, at roughly 70%, is double the overall market share of the three largest banks, at roughly 35%.
Table 1.7 Average Market Share and Years with Top-10 Ranking for Single-Bank Platforms
| Share (%) | # Top 10 | |
| Deutsche Bank (Autobahn) | 36 | 7 |
| UBS (FX Trader) | 22 | 7 |
| Barclays Capital (BARX) | 12 | 7 |
| Citi (Velocity) | 6 | 7 |
| JPMorgan (MorganDirect) | 3 | 3 |
| Goldman Sachs (REDI) | 3 | 5 |
| RBS (SmartPrime) | 3 | 6 |
| HSBC (HSBCnet FXHub) | 2 | 7 |
| Credit Suisse (PrimeTrade FX) | 2 | 3 |
| Morgan Stanley (Passport) | 2 | 2 |
aNote: The table shows the average market share (in percentage points) since 2004 up to 2010. The column “#Top 10” states how many years, out of the 7 possible years, that a bank's single-bank platform has ranked top 10.
Source: Euromoney FX Survey.
Given the rising market share of the largest dealers, they now have sufficient flow to systematically internalize customer trades. If customer A calls to sell a quantity of JPY, the bank will hold those JPY in inventory until customers B and C call to buy JPY, rather than unloading the position in the interdealer market. Electronic trades can be especially profitable to internalize because algorithms allow banks to capture the bid–ask spread with less market risk. Any trades that cannot be matched internally are passed to the dealer's trading desk, where the inventory risk can be managed as before in interdealer markets. In 2007, fewer than 25% of trades were internalized in this way. Today, the top FX dealers are reportedly matching 80% or more of customer trades on their own books. Internalization is another factor contributing to the declining share of interdealer trading in overall trading.
Banks have begun to exploit their new digital trading records to profile the trades of each customer. Dealers examine these data statistically to distinguish three types of trades: (i) directional flows, (ii) non-directional flows, and (iii) predatory high frequency trades. Directional flows are customer trades that are typically associated with subsequent movements in exchange rates and are therefore considered informed. Dealers can use the information embedded in these informed trades either to reduce inventory risk or to guide their speculative position-taking. Non-directional (or uninformed) flows refer to client transactions that are not associated with any predictable price movements. Dealers can safely hold trades with uninformed customers in their inventory and then cross them against other end-customer trades, allowing the dealers to earn the full bid–ask spread. Predatory flows are discussed in greater detail below.
Leveraged investors have begun trading directly in the interbank markets via prime brokerage arrangements with the biggest dealers. Prime brokerage clients trade with other dealers in the prime broker's name using the prime broker's existing credit lines (Figure 1.3(c), line 7), a privilege for which they pay a fee based on trading volume. Any trades executed with FX dealers other than the prime broker are “given up” to the prime broker, who becomes the counterparty to both legs of the trade. Hedge-fund Z, for example, might pay Bank of America to be its prime broker, thereby gaining access to the EBS and Thomson Reuters trading platforms. After Z buys AUD from, say, HSBC, Bank of America becomes the seller of AUD to Z and the buyer of AUD from HSBC.
For the large banks, prime brokerage arrangements generate new, fee-based revenue that leverages their technology and operating infrastructure. The benefits to end-customers are more varied. End-customers gain leverage, consolidated settlement, clearing, and reporting services.17 Since many hedge funds have a limited credit history, prime brokerage arrangements provide access to new counterparties and new trading platforms. Prime brokerage also permits a more efficient use of their collateral for margin relationships, since positions can be netted, replacing operational and settlement risk. Finally, prime brokerage provides customers with anonymity, as their counterparties often do not know the identity behind a prime brokerage trade. By contrast, hedge funds do not enjoy anonymity when they trade directly with their banks. Historically, some major hedge funds have been concerned that banks would either front run their trades or share information about their activity with others in the market.18
Prime brokerage, like many innovations in FX, initially took root in equity and bond markets, which may help explain why the growth of FX prime brokerage has been startlingly rapid. Close to 30% of spot transactions in London were executed via a prime brokerage relationship in April 2010, up from just 15% in 2008.19
Algorithmic (or algo) trading, described in Section 1.2, emerged naturally once end-customers had access to sophisticated electronic trading systems. A key turning point came in 2003 when the electronic broker EBS provided an automated interface (AI) to banks, allowing banks to receive streaming price quotes electronically. This innovation opened the door to algorithmic trading in interdealer markets. A few years later, in response to competition from multibank trading systems, EBS and Reuters extended this service to banks' major customers. This development gave hedge funds and other proprietary traders access to interdealer markets for the first time. As shown in Figure 1.7, the share of algorithmic trading on the interdealer brokers has grown rapidly and now exceeds 50%.
Figure 1.7 Share of algorithmic trading on EBS and Thomson Reuters Dealing. Note: Moving average of share of trades involving at least one machine using gross volumes. (a) Fifty-day moving average of machine-share on EBS for EUR/USD, USD/JPY, and EUR/JPY. (b) Seven-week moving average of machine-share on Reuters D3000 for EUR/NOK. The shaded area marks where the two graphs have overlapping observations. Source: Chaboud et al. (2009).
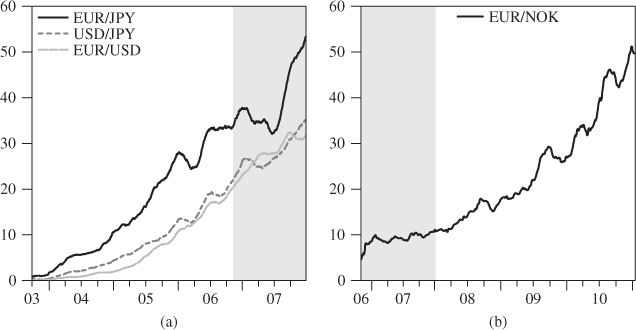
As discussed in Section 1.2, algorithmic trading has spawned a new form of trading called high frequency trading. High frequency trading involves capturing frequent but tiny profits associated with slight transitory price differences across platforms. King and Rime (2010) estimate that high frequency trading now accounts for roughly one-quarter of spot FX turnover. The rise of high frequency trading explains the concentration of trading growth in spot markets, the concentration of that growth in USD and EUR, and the concentration of reported activity in London and the United States. It can also explain why spot trade sizes have been falling while trade numbers have been rising as well as the doubling of exchange-traded contracts on the Chicago Mercantile Exchange (CME) since 2007. By 2010, high frequency traders were active on some single bank trading systems and algorithmic trading was even a dominating feature of smaller currencies such as the NOK (Figure 1.7).
Dealers have mixed reactions toward high frequency trading on their proprietary systems. The high frequency traders' profit is a dealer's loss. As a result, some banks screen out such “predatory” trading using computer algorithms that profile customers based on trading activity. Other banks, however, encourage high frequency trading on in-house systems; they see indirect gains, since the additional liquidity allows them to populate internal pricing engines.
Dealers are generally happy to sponsor high frequency trading firms on multibank platforms through prime brokerage relationships and charge them for using the bank's credit. Nonetheless, FX dealers recognize that they themselves can be “scalped” by price-latency arbitrage, so some post quotes on these platforms only when they proactively want to trade. In addition, most banks have invested heavily in their own high frequency trading capacity. Unsurprisingly, the expansion of high frequency trading has diminished the profitability of this strategy. With high frequency trading less profitable and fewer banks making markets, a number of top high frequency trading firms have begun providing liquidity—and in effect making markets—on anonymous multibank trading platforms as a profitable trading strategy.
A key question that FX market face is whether liquidity provided by high frequency traders is a “mirage” that will dry up in a crisis when it is needed most. High frequency traders engage in market making because it is profitable, but are under no obligation to offer liquidity. Most banks, by contrast, will make markets for their customers even during times of stress, in order to maintain their reputation and to win other more lucrative business. The evidence from the 2007–2009 global financial crisis is inconclusive. Following the collapse of Lehman Brothers, the spot markets—where high frequency traders are most active—remained liquid, though spreads widened considerably (Baba and Packer, 2009; Melvin and Taylor, 2009).
With electronic trading, small trades can automatically be aggregated into larger trades and laid off in the liquid interdealer market. With the advent of such retail aggregators, described in Section 1.2, individuals with modest wealth—an entirely new class of agents—began trading FX. Retail trading has been one of the fastest growing segments of the market. Such trading, which was negligible in 2001, had reached an estimated $125–150 billion per day, or 8–10% of global spot turnover, by 2010 (King and Rime, 2010).20 Japanese retail investors are believed to be the most active, representing perhaps 30% or more of spot JPY trading (or more than $20 billion per day). Most of this Japanese trading takes place through margin accounts on the Tokyo Financial Exchange (Terada et al., 2008).
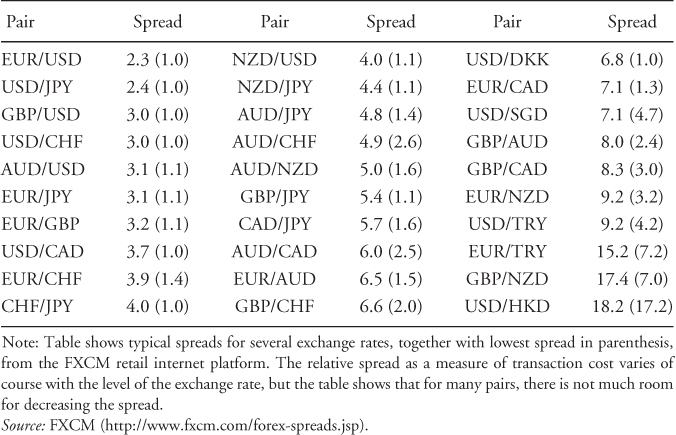
Dealers are happy to provide liquidity to retail aggregators at attractive prices because retail trades are not on average informed, as noted earlier, so there is no adverse-selection risk. Dealers can safely hold retail flows in inventory to cross against future transactions. Table 1.8 shows that retail customers trading over the internet for amounts of $50,000 or less may pay bid–ask spreads as low as 1 pip for the most liquid currency pairs, similar to spreads available to dealers a decade ago.
Table 1.8 Bid–Ask Spreads Available From A Retail FX Platform (in Pips)
The rapid growth of retail FX trading has led to increased regulation. Online FX dealers must now be registered and capital requirements have been raised. Further, the United States and Japan have lowered the cap on retail leverage from 100 : 1 to 50 : 1 for major currencies, and in Japan the cap fell further, to 25 : 1, in January 2012. Since there are currently no limits on leverage and limited regulation in the United Kingdom and continental Europe, there is potential for regulatory arbitrage.
Greater regulation has brought industry consolidation. The number of US retail platforms shrank from 47 in 2007 to 11 in 2011; the number of Japanese platforms fell from over 500 in 2005 to around 70 in 2011.
With trading dispersed across competing electronic platforms, liquidity could have become fragmented and the markets inefficient. Natural market forces, however, have provided a solution with the development of “liquidity aggregators”. Liquidity aggregators are electronic tools that collect streaming price quotes from different sources such as FX dealers, electronic brokers, and multibank trading systems. By aggregating quotes into one executable stream, dealers and end-customers can access the best prices from many platforms simultaneously. Hedge funds have been using these algorithms for several years, and they are now being adopted by large banks.
One more operational innovation may yet take hold in FX market, specifically the introduction of central counterparties (CCPs), which are designed to mitigate counterparty credit risk (i.e., default risk). Although most FX instruments generate little counterparty credit risk, exposures generated by longer-dated FX forwards and options can be substantial. This risk is typically managed in FX using counterparty risk limits set bilaterally and master netting agreements that specify the conditions and procedures associated with default (FXC, NY, 2010).
During the 2008 financial crisis, standard counterparty protections in OTC markets proved inadequate or were questioned for many asset classes. To address this weakness, regulators in the United States and Europe began considering whether to mandate centralized clearing via a central counterparty. The central counterparty reduces counterparty credit risk by stepping into the middle of every trade, becoming the buyer to every seller and the seller to every buyer. The central counterparty requires both parties to post collateral, with a safety margin maintained while any position remains open (Cecchetti et al., 2009). If one party defaults, the central counterparty uses that party's margin to close out the transaction with the other counterparty.
In FX market, central counterparties have been operating for exchange-traded products for some time but have been absent in OTC markets. While the US Treasury has exempted spot and forward FX market from the requirement under the Dodd–Frank Act to use a central counterparty, other FX instruments will be required to adopt this new structure. European authorities are expected to follow the US' lead on this issue.
A 2006 joint attempt by CME and Reuters to launch a central counterparty with the OTC sector, called FX MarketSpace, failed in 2008. As of 2010, the CME—which operates the largest central counterparty for exchange-traded FX products—is again planning to launch a central counterparty for OTC derivatives including FX. Unlike the 2006 venture, the planned offering will be operated as a stand-alone, open entity that may prove more popular with market participants.
To better understand FX activity on multibank trading systems and electronic brokers, the authors conducted a survey of 15 institutional and retail platforms. Table 1.9 shows the results from the authors' survey. The 10 institutional platforms that participated represent as much as 30% of spot FX trading globally and 22% of FX swaps.21 The five retail platforms surveyed captured another 5% of global spot FX turnover. Activity on multibank platforms has grown strongly over the past three years, with weighted-average daily turnover rising by 20% for the institutional platforms and by over 300% for the retail platforms. The average trade size is $2 million on institutional platforms and around $60,000 on retail platforms, with the latter handling many more transactions on a typical day.
Table 1.9 Survey of 15 Multibank Platforms for FX
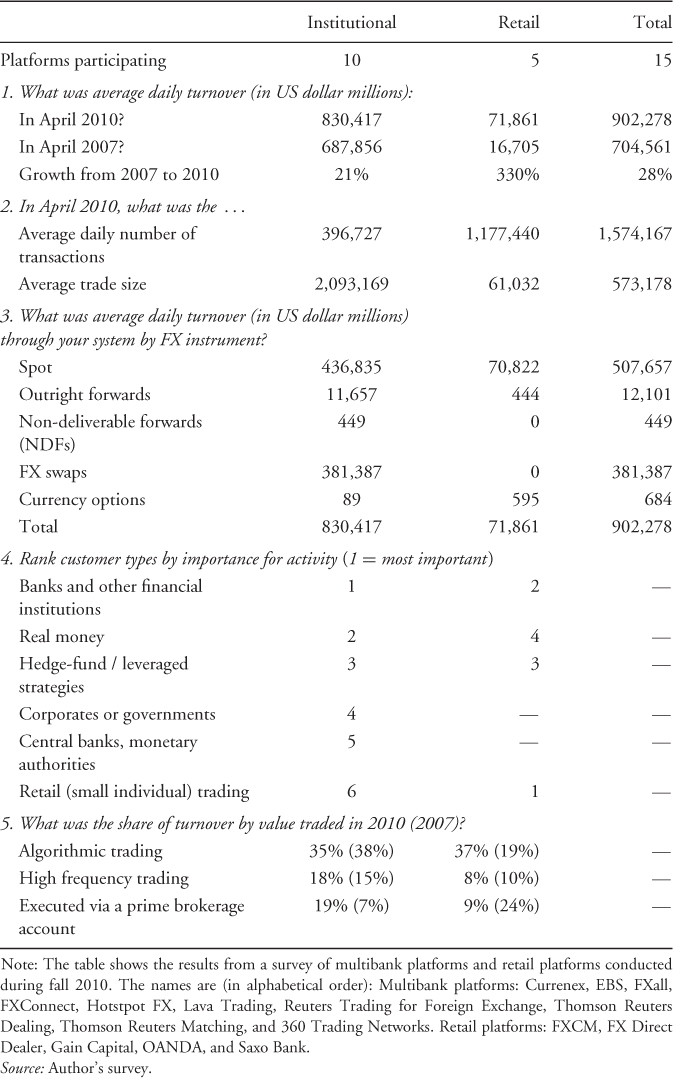
The most active participants on institutional platforms (in order of importance) are banks, real-money investors, and leveraged investors. Trading on institutional platforms is even more concentrated in spot (53%) and FX swaps (46%) than it is in the rest of the market.
The client base and nature of trading varies considerably across platforms. EBS and Thomson Reuters serve the interbank market, with significant activity by algorithmic and high frequency traders who gain access via prime brokerage relationships. In the case of EBS, there is now almost a 50/50 split between algorithmic traders and manual traders with a keypad. To satisfy both customer types, EBS slowed down execution on its platform by introducing a minimum quote life of 250 ms to prevent flash orders and to level the playing field between computers and humans.
Algorithmic and high frequency trading are also important on other anonymous platforms such as Currenex, Hotspot FX, and Lava. On Hotspot FX, for example, reportedly over 75% of the platform's turnover in 2011 is algorithmic. Across all institutional platforms, the share of algorithmic trading has been stable over the past 3 years at around 35% of activity. High frequency trading represented 18% of turnover in 2010, with all of this activity transacted through prime brokerage relationships.
Real-money investors and corporate customers are most active on request for quote platforms such as FXall, FXConnext, 360Trading Networks, and Reuters Trading for FX. Algo trading on request for quote platforms is a negligible share of activity.
On retail-oriented platforms, activity is concentrated in spot trades in the major bilateral pairs (i.e., EUR/USD, GBP/USD, USD/JPY) or in popular carry trade combinations (AUD/USD, GBP/JPY, EUR/JPY). Carry trade activity has declined over the past 2 years, however, as interest rates have fallen and a number of leveraged investors suffered large losses on their trades.
Four out of the five retail platforms surveyed are US based, but they attract customers globally. Asia represents the fastest growing market, with particular growth in Japan, Taiwan, and Korea. More than a third of retail investors use computer algorithms. This statistic reflects the wide availability of popular software trading packages such as MetaTrader that offer charting and other technical tools and allow users to program their own trading strategies.
While much of retail trading is reportedly intraday, a significant portion involves buy-and-hold investors who trade on fundamentals. A recent survey by CitiFX Pro found that more than half of traders employ a combination of fundamental and technical analysis, with 36% saying they only use technical analysis. Leverage is important, with the most common range between 50 and 100 times capital. As the regulatory limits on leverage described earlier take hold, these fractions will likely decline.
This chapter examines the state of play in the global FX market, which reflects both stability and rapid technological change. As ever, currency trading still takes place on a decentralized market in which most customers rely on professional dealers to provide liquidity. Currencies are still traded to facilitate international trade, hedge risk, earn speculative returns, and to profit from market making. The USD, JPY, and EUR remain the dominant currencies and trading is still concentrated in London and New York. The best-informed agents in the market continue to be financial institutions, especially hedge funds. Corporate customers continue to eschew speculative trading in spot markets and provide liquidity.
In the early 1980s, all FX trading was done by phone, transparency was low, and customer transaction costs were high. The lack of transparency resulted in high levels of interdealer trading relative to end-customer trading. In the early 1990s, the introduction of electronic brokers to the interdealer market brought a huge increase in transparency, and the share of interbank trading began to fall even while trading volumes rose.
The electronic revolution finally reached end-customers around 2000, when single-bank platforms and multibank platforms allowed institutional customers to trade electronically with their dealers and with each other. Market transparency rose further, trade processing costs fell due to straight-through processing, and customer bid–ask spreads fell rapidly. Electronic trading has also created access to the market from previously excluded groups, specifically retail trading by individuals and small institutions. Retail trading was made possible by the development of a new type of internet-based trading platform, the retail aggregator. Ongoing attempts to regulate retail trading may bring further market changes in the future.
Innovative trading strategies employed in FX market include white labeling, prime brokerage, algorithmic trading, and high frequency trading. These innovations have complicated the strategic calculus of market making and could potentially undermine liquidity provision in a crisis.
The increasing sophistication of FX trading software and the associated growth of algorithmic and high frequency trading have brought a number of important structural changes to global FX market.
Algorithmic trading Automated transactions where a computer algorithm decides the order-submission strategy. See also “High frequency trading.”
Bid–ask spread Difference between the price for buying (the dealer's ask) and for selling (the dealer's bid), which measures the transaction costs for executing a trade; often used as an indicator of market liquidity.
Broker A financial intermediary who matches counterparties to a transaction without being a party to the trade. The broker can operate electronically (electronic broker) or by telephone (voice broker).
Carry trade A trading strategy where low yielding currencies are sold to finance the purchase of higher-yielding currencies.
Central counterparty (CCP) An independent legal entity that interposes itself between the buyer and the seller of a security, and requires a margin deposit from both sides.
Counterparty credit risk The risk that a counterparty will not settle an obligation in full value, either when due or at any time thereafter.
Counterparty risk limit An institution's maximum aggregate market exposure to an individual counterparty across all uncollateralized trading positions. Established by a dealer's risk managers before agreeing to trade with a given counterparty.
Credit support annex (CSA) Document specifying the rules governing the mutual posting of collateral between two counterparties.
Currency (or FX) futures Similar to outright forward, a transaction involving the exchange of two currencies at a rate agreed on the date of the contract for value or delivery (cash settlement) at some time in the future (more than 2 business days or later). Unlike outright forward, currency futures are exchange-traded instruments with standardized characteristics such as contract size and maturity. Four contracts are available with settlement in March, June, September, and December. The biggest currency futures exchange is the CME, followed by the London Futures Exchange. Futures are mainly available for the most liquid currency pairs.
Currency (or FX) options A derivative security giving the holder the right (but not the obligation) to buy or sell a currency at an agreed exchange rate during a specified period. This category includes exotic currency options such as average rate options and barrier options. Currency options are sold in both OTC markets and on exchanges.
Currency swaps A contract committing two counterparties to exchange streams of interest payments denominated in different currencies for an agreed period of time. They typically require an exchange of principal amounts denominated in different currencies at a preagreed exchange rate at inception and at maturity of the contract. Interest payments are then on a fixed, floating, or zero coupon basis. In effect, a currency swap allows a borrower or lender to swap a loan (or bond) in one currency for a loan in another without incurring currency risk if the swap is held until maturity. Currency swaps are directly analogous to interest-rate swaps and do not influence exchange rate dynamics.
Dealer (or market-maker) A financial institution whose primary business is entering into transactions on both sides of markets and seeking profits by taking risks in these markets.
FX swap The currency equivalent of a repurchase transaction (or repo): a single transaction with a single counterparty that involves two currency transactions—one purchase and one sale—for two different value dates. The exchange rate for both transactions is agreed at the outset. The typical FX swap combines a spot FX transaction that is offset with an outright forward at a later date, but it is also possible to have two outright forwards.
High frequency trading (HFT) An algorithmic trading strategy that profits from incremental price movements with frequent, small trades executed in milliseconds for investment horizons of typically less than 1 day. See also “Algorithmic trading.”
Interdealer market The market where FX dealers trade with each other, either bilaterally or through brokers. Also called the interbank market, due to the dominance of banks as FX dealers.
Liquidity aggregators Electronic tools that receive streaming price quotes from different sources, such as FX dealers, electronic brokers, and multibank trading systems, and consolidate them into one stream, allowing traders to access the best prices from many platforms simultaneously.
Margin account An account that allows customers to buy securities with money borrowed from a financial intermediary. The customer's cash deposit in the account is called the margin.
Market liquidity A characteristic of the market where transactions have a limited impact on prices (“price impact”) and can be completed quickly (“immediacy”).
Master netting agreement Document specifying various events of default between counterparties and a methodology for closing out positions in such events. It forms part of a master agreement that sets out the responsibilities of trading parties toward each other.
Multibank trading system (MBT) An electronic trading system that aggregates and distributes quotes from multiple FX dealers.
Outright forward An agreement between two counterparties to exchange two currencies at a rate agreed on the date of the contract for cash settlement on an agreed future date, which is more or less than two business days later. Non-deliverable forwards do not require physical delivery of a non-convertible currency; instead, the counterparty that loses on the contract simply pays the losses directly to the other counterparty.
Prime brokerage (PB) A service offered by banks that allows a client to source funding and market liquidity from a variety of executing dealers while maintaining a credit relationship, placing collateral, and settling with a single entity.
Reporting dealer A bank that is active in FX market, both for its own account and to meet customer demand, and participates in the Triennial Survey.
Settlement risk The risk that a counterparty to a transaction does not deliver payment.
Single-bank trading system (SBT) A proprietary electronic trading system operated by an FX dealer for the exclusive use of its customers.
Spot FX A single outright transaction involving the exchange of two currencies at a rate agreed on the date of the contract for cash settlement, which is typically in two business days.
The authors would like to thank the editors, an anonymous referee, Geir Bjønnes, Alain Chaboud, Alex Heath, Colin Lambert, Michael Melvin, Michael Moore, Richard Olsen, and James Whitelaw for their helpful comments and suggestions on the final text. We also thank many anonymous market participants for their discussions and insights. Any remaining errors are our own. The views expressed in this chapter are those of the authors and do not necessarily represent those of the Norges Bank.
1Every currency has a three-letter currency code, such as CAD for the Canadian dollar. These codes have been developed by the International Organization for Standardization (www.iso.org). In labeling currency pairs, market practice is to express the base currency first, as in “dollar–yen” or USD/JPY, which should be read as Japanese yen (JPY) per USD. Major exchange rates have nicknames: USD/CHF is “swissie” and NZD/USD is “kiwi.” GBP/USD is “cable” in reference to the first trans-Atlantic telegraph cable that connected FX traders in London and New York.
2As an example, in interdealer spot trading, the volumes traded in EUR/ NOK (Norwegian krone) are 10 times larger than the sum of those in USD/NOK, GBP/NOK, and NOK/JPY.
3The most actively traded currency pairs have USD or EUR on one side.
4A pip is short form for Price Increment Point. In EUR/USD, a one-pip change is, for example, from 1.2345 to 1.2346. In most major currency pairs, one pip is roughly one basis point.
5With a spot contract, the exchange rate and the quantity to exchange are agreed initially, and the funds actually change hands (“settle”) 2 business days later (1 day later for USD/CAD). A forward contract is similar in structure, but settlement generally happens more than 2 business days later. For “inside forwards,” settlement is less than 2 days later.
6Currency futures, like forwards, involve an agreement today to exchange two currencies in the future. Future contracts are exchange traded so their characteristics, such as contract size and maturity, are standardized. In contrast, a FX (or currency) option gives the owner the right but not the obligation to buy or sell a currency at an agreed exchange rate during a specified period. Standardized FX option contracts are traded on organized exchanges, while tailor-made contracts are available through individual FX dealers. Currency swaps are the currency equivalent of interest-rate swaps; they essentially allow someone to swap a loan (or bond) in one currency for a loan in another without incurring currency risk if the swap is held until maturity.
7Exchange-traded FX instruments fall under the relevant securities regulation in their respective countries. The Chicago Mercantile Exchange, for example, is regulated by the National Futures Association and Commodity Futures Trading Commission.
8A front-running dealer would buy in the interdealer market for his own account, driving up the price, before filling a customer buy order. Such activity, if suspected, would lead customers to boycott or punish this FX dealer.
9King and Mallo (2010) provide a user's guide to the Triennial survey. Since the mid-1990s, the Triennial Survey has been complemented by more frequent regional surveys conducted in Australia, Canada, Hong Kong, London, New York, Singapore, and Tokyo.
10Retail trading platforms, so-called “retail aggregators” (RAs), are reported as financial institutions in the BIS Triennial Survey. See more on retail aggregators below.
11As an example, the Norges Bank trades on behalf of the Norges Bank Investment Management (NBIM), which is Norway's sovereign wealth fund. These trades are announced in advance online (see http://www.norges-bank.no/en/price-stability/foreign-exchange-purchases-for-gpfg/).
12A few multinational corporations had FX trading desks as part of their treasury functions before the 2008–2009 financial crisis. Many of these has been closed afterwards.
13A take-profit order instructs a dealer to buy (sell) a specified amount if the price falls (rises) to a certain level.
14To ensure that dealers only trade with creditworthy counterparties, FX brokers screen every quote, comparing the existing exposure of a quoting bank (Citi) to its existing credit line with the potentially observing bank (Deutsche).
15This figure emerges from comparing CLS Bank data with the 2010 Triennial Survey.
16On September 17, 2008, CLS Bank handled more than 1.5 million payment instructions with a gross value of $8.6 trillion—a new record–with no market disruption.
17For more details on FX prime brokerage, see www.ny.frb.org/fxc/2005/fxc051219a.pdf.
18Soros's Quantum Funds has required banks with which it trades to sign special confidentiality agreements.
19See the survey of the London FXJSC at http://www.bankofengland.co.uk/markets/forex/fxjsc/index.htm.
20Activity via retail aggregators is reported as “Other financial institutions” in the Triennial Central Bank Survey.
21The data collected from multibank platforms are not adjusted for interdealer double-counting, so these estimates of their coverage are biased upwards.
Baba N, Packer F. From turmoil to crisis: dislocations in the FX swap market before and after the failure of Lehman Brothers. BIS Working Papers 285, Bank for International Settlements; 2009.
Barber BM, Odean T. Trading is hazardous to your wealth: the common stock investment performance of individual investors. J Finance 2000; 55(2): 773–806.
Barber BM, Odean T. Online investors: do the slow die first? Rev Financ Stud 2002; 15(2): 455–488.
BIS. Triennial Central Bank Survey of Foreign Exchange and Derivatives Market Activity in 2010. Bank for International Settlements; Basel, Switzerland, 2010.
Bjønnes GH, Osler CL, Rime D. Sources of information advantage in the foreign exchange market. typescript, Norges Bank; 2011.
Bjønnes GH, Rime D. Dealer behavior and trading systems in foreign exchange markets. J Financ Econ 2005; 75(3): 571–605.
Bjønnes GH, Rime D, Solheim HAa. Liquidity provision in the overnight foreign exchange market. J Int Money Finance 2005; 24(2): 177–198.
Bodnar G, Hayt G, Marston R. 1998 Wharton survey of financial risk management by US non-financial firms. Financ Manage 1998; 27(4): 70–91.
Bollerslev T, Melvin M. Bid-ask spreads and volatility in the foreign exchange market: an empirical analysis. J Int Econ 1994; 36: 355–372.
Cecchetti SG, Gyntelberg J, Hollanders M. Central counterparties for over-the-counter derivatives. BIS Q Rev 2009;(3): 45–58.
Chaboud A, Chiquoine B, Hjalmarsson E, Vega C. Rise of the Machines: Algorithmic Trading in the Foreign Exchange Market. International Finance Discussion Papers 980, Federal Reserve Board; 2009.
CitiFX Pro. Forex Traders' Survey 2010 Results. Web-document, Citi Research Team; 2010.
Diamond R. Banks' profits could take hit in fight over forex fees. Pensions and Investments; 2011 Apr 4.
Ding L. Bid-ask spread and order size in the foreign exchange market: an empirical investigation. Int J Finance Econ 2009; 14(1): 98–105.
DuCharme M. First steps in foreign exchange transaction cost analysis. J Perform Meas 2007; 19–27.
Dunne P, Hau H, Moore M. A Tale of Two Platforms: Dealer Intermediation in the European Sovereign Bond Market. Discussion Paper 6969, CEPR; 2008.
Evans MDD, Lyons RK. Order flow and exchange rate dynamics. J Pol Econ 2002; 110(1): 170–180.
Evans MDD, Lyons RK. Understanding order flow. Int J Finance Econ 2006; 11(1): 3–23.
FXC, NY. Tools for Mitigating Credit Risk in Foreign Exchange Transactions. Web-document Nov., New York Foreign Exchange Committee. Available at http://www.newyorkfed.org/fxc/2010/creditrisktools.pdf. 2010.
Galati G. Settlement risk in foreign exchange markets and CLS Bank. BIS Q Rev 2002;(4): 55–65.
Goodhart CAE. The foreign exchange market: a random walk with a dragging anchor. Economica 1988; 55(220): 437–460.
Goodhart CAE, Ito T, Payne R. One Day in June 1993: a study of the working of the reuters 2000-2 electronic foreign exchange trading system. In: Frankel JA, Galli G, Giovannini A, editors. The microstructure of foreign exchange markets. Chicago: University of Chicago Press; 1996. pp. 107–79.
Goodhart CAE, Love R, Payne R, Rime D. Analysis of spreads in the Dollar/Euro and Deutschemark/Dollar foreign exchange markets. Econ Policy 2002; 17(35): 537–552.
Heimer RZ, Simon D. The Dedicated and the Dabblers: A Social Network for Forex Traders. typescript, Brandeis University; 2011.
King MR, Mallo C. A user's guide to the Triennial Central Bank Survey of foreign exchange market activity. BIS Q Rev 2010;(4): 71–83.
King MR, Rime D. The $4 trillion question: what explains foreign exchange growth since the 2007 survey? BIS Q Rev 2010;(4): 27–42.
King M, Sarno L, Sojli E. Timing exchange rates using order flow: the case of the Loonie. J Bank Finan 2010; 34(12): 2917–2928.
Lindley R. Reducing foreign exchange settlement risk. BIS Q Rev 2008;(3): 53–65.
Linnainmaa JT. Do limit orders alter inferences about investor performance and behavior? J Finance 2010; 65(4): 1473–1506.
Lyons RK. Tests of microstructural hypothesis in the foreign exchange market. J Financ Econ 1995; 39 321–351.
Lyons RK. A simultaneous trade model of the foreign exchange hot potato. J Int Econ 1997; 42 275–298.
Lyons RK. The microstructure approach to exchange rates. Cambridge (MA): MIT Press; 2001.
Marsh IW, O'Rourke C. Customer Order Flow and Exchange Rate Movements: Is There Really Information Content? Working paper, Cass Business School; 2005.
Melvin M, Prins J. The equity hedging channel of exchange rate adjustment. typescript, Blackrock; 2010.
Melvin M, Taylor MP. The crisis in the foreign exchange market. J Int Money Finance 2009; 28(8): 1317–1330.
Mende A, Menkhoff L. Profits and speculation in intra-day foreign exchange trading. J Financ Mark 2006; 9(3): 223–245.
Moore MJ, Payne R. On the sources of private information in FX markets. J Bank Finance 2011; 35(5): 1250–1262.
Nolte I, Nolte S. Customer Trading in the Foreign Exchange Market. Empirical Evidence from an Internet Trading Platform. Working Paper 09-01, FERC; 2009.
Oberlechner T, Osler CL. Survival of overconfidence in currency markets. J Financ Quant Anal 2012. Forthcoming.
Osler CL. Currency orders and exchange-rate dynamics: explaining the success of technical analysis. J Finance 2003; 58(5): 1791–1819.
Osler CL. Stop-loss orders and price cascades in currency markets. J Int Money Finance 2005; 24(2): 219–241.
Osler CL. Market microstructure, foreign exchange. In: Meyers RA, editor. Encyclopedia of Complexity and System Science. New York (NY): Springer; 2009. pp. 5404–5438.
Osler CL, Mende A, Menkhoff L. Price discovery in currency markets. J Int Money Finance 2011; 30(8): 1696–1718.
Osler CL, Vandrovych V. Hedge funds and the origins of private information in currency markets. typescript, Brandeis University; 2009.
Osler CL, Yusim R. Intraday dynamics of foreign-exchange spreads. typescript, Brandeis University; 2009.
Ramadorai T. What determines transaction costs in foreign exchange markets? Int J Finance Econ 2008; 13(1): 14–25.
Rime D. New electronic trading systems in the foreign exchange markets. In: Jones DC, editor. Volume 21, New economy handbook. San Diego (CA): Academic Press; 2003. pp. 471–504.
Rime D, Sarno L, Sojli E. Exchange rate forecasting, order flow and macroeconomic information. J Int Econ 2010; 80(1): 72–88.
Sager MJ, Taylor MP. Under the microscope: the structure of the foreign exchange market. Int J Finance Econ 2006; 11(1): 81–95.
Taylor A, Farstrup A. Active currency management: arguments, considerations, and performance for institutional investors. Darien (CT): CRA RogersCasey International Equity Research; 2006.
Terada T, Higashio N, Iwasaki J. Recent trends in Japanese foreign exchange margin trading. Bank Japan Rev 2008; (3).