Chapter 7
Mathematics and Computer Science
Some of the coolest, most interesting jobs being created in today’s economy are in fields related to mathematics and computer science. You might have a hard time convincing some people of that fact, but it certainly is true. Professionals with math and computer training are changing the way business is done and life is lived. They’re working with data, gleaning all the intelligence they can from figures in spreadsheets and data files. Some of them are creating secret codes and encrypting data, while others (such as military and security experts) are busy honing their code-breaking skills. Some math and computer science professionals help create and oversee the systems that power the economy, moving dollars and other currencies around the globe, and calculating the probabilities of various events occurring. In addition to being among the most intellectually stimulating of all career fields, jobs involving mathematics and science tend to be among the highest paid. If the activities in this chapter stimulate your child’s interest, he or she might be naturally cut out for a career related to math or computer science.
ACTIVITY: Designing Wallpaper Using Percentages
This simple activity is fun for artistic kids, especially those with a flair for design. It also offers them an easy way to visualize percentages.
Materials Needed:
- 100-square grid
- A set of fine-tip colored markers
You can design your own 100-square grid on blank paper using a straight edge, or you can find a grid online to print out. Just do a search for “Blank 100 Grid.” If you download a grid from an online source, be sure it actually has 100 blank squares (count 10 columns across the top and 10 rows across the side).
The Setup
For this activity, tell your child that her task is to create a design for some new wallpaper on the 100-square grid. She can use some artistic license in the design, but there are some requirements for the new wallpaper:
Wallpaper Design Specs:
- 30 percent of the squares must contain stars
- 20 percent of the squares must contain half-moons
- 25 percent of the squares must be shaded blue
- 15 percent of the squares must be shaded gray, silver, or purple
- 10 percent of the squares must be kept blank
Percentage Basics
After your child has completed her design, use it as a basis for discussing percentages. Percent simply means per hundred. Fifty percent, or half, of the squares in the wallpaper design have shapes inside them (i.e., stars or moons). Twenty-five percent (or a quarter) of the squares are shaded blue.
Decimals can easily be converted into percentages. Simply multiply the decimal number by 100 and place the % symbol after the resulting number. For example, 0.25 can be converted into a percentage by multiplying it by 100 and placing % after the number. So 0.25 × 100 = 25%.
STEM Q&A
Q: Does it matter whether you use decimals or percentages?
A: Decimals and percentages both represent parts of a whole. Technically speaking, since one can easily be converted into the other, it doesn’t matter whether you use decimals or percentages. However, decimals make more sense in certain contexts, and percentages make more sense in others. For instance, survey results are usually given in percentage terms (e.g., 62% of American households include at least one pet). Decimals are more often used in measurements, especially when accuracy is important (e.g., measurements in a scientific lab).
To convert a percentage into a decimal number you simply reverse the procedure. Remove the % symbol and divide the number by 100. For instance, suppose you want to convert 49% into a decimal. After removing the percent sign, you simply divide 49 by 100. So 49% is equivalent to 0.49. Since fractions also represent parts of a whole, they can be converted into percentages. The easiest way to convert a fraction into a percentage is to first convert the fraction into a decimal number by dividing the fraction’s numerator by its denominator. After that’s done, multiply the resulting decimal number by 100 and place the % sign after it.
STEM Career Choices
Mathematician
Some would argue that mathematics is one of the oldest sciences known to man. Most people who work in most STEM fields need some math knowledge. Mathematicians are the real diehards, the ones who eat and breathe proofs and algorithms. Some mathematicians work in theoretical mathematics, meaning that they work to discover new math principles. Because most theoretical mathematicians work at universities as professors, they must earn doctorate degrees in mathematics to enter the field. Other mathematicians work in applied mathematics, meaning that they look for ways to use math principles to solve real-world problems. Universities hire applied mathematicians, and so do government agencies and some private companies. Many applied mathematicians also earn doctorate degrees, but there are jobs available in the field for master’s degree holders. A math major will increase her marketability by also taking some classes in statistics and computer science.
ACTIVITY: Tic-Tac-Toe Math Review
Tic-tac-toe is one of the fastest and easiest games to play. It’s also an easy game to adapt into a math review activity. It can be used for any level of math and for any math concept. Of course, with the math review component, the game will take longer to complete.
Materials Needed:
- Paper
- Pen or pencil
- A supply of math review questions
Game play for the Tic-Tac-Toe Math Review is similar to the way the game is typically played. The difference is that after drawing a three-by-three grid on your paper, you populate the nine squares with math review problems. For longer, more complex problems, you’ll of course need a larger grid with larger squares.
When it’s a player’s turn, he doesn’t just choose a box and fill it with an X or O, as with standard play. First he must successfully complete the math review problem in the box he wishes to claim. If the player finds the correct solution to the problem, he fills in his X or O. If he doesn’t answer correctly, he can attempt another review question in a different box. On his next turn, he may reattempt the problem previously missed, if the other player hasn’t already claimed that box.
STEM Career Choices
Computer Programmer
If it weren’t for computer programmers, we wouldn’t enjoy all the technological tools and toys we do today. We wouldn’t have cell phone apps—or even smartphones! Computer programmers are responsible for all those cool apps and games. They also write programs that help businesses and other organizations function more smoothly. Computer programmers write and test code—not secret spy code, but code that tells computers what to do (and when to do it). Most computer programmers have bachelor’s degrees in computer science, but some find work with an associate’s degree. Most individuals in the field specialize in a few programming languages, such as SQL, Java, C++, Python, etc.
Following are six sets of problems you can use to populate the squares in your tic-tac-toe game. The problems cover six different topic areas (for convenience, answers are provided in parentheses).
Multiplication:
- 10 × 9 (90)
- 7 × 11 (77)
- 5 × 15 (75)
- 6 × 12 (72)
- 8 × 14 (112)
- 7 × 30 (210)
- 3 × 22 (66)
- 2 × 18 (36)
- 10 × 20 (200)
Division:
- 100 ÷ 10 (10)
- 88 ÷ 11 (8)
- 72 ÷ 9 (8)
- 120 ÷ 40 (3)
- 144 ÷ 12 (12)
- 250 ÷ 5 (50)
- 90 ÷ 15 (6)
- 99 ÷ 33 (3)
- 1,000 ÷ 200 (5)
Simplifying Fractions:
- 5⁄10 (1⁄2)
- 4⁄12 (1⁄3)
- 2⁄8 (1⁄4)
- 10⁄25 (2⁄5)
- 9⁄81 (1⁄9)
- 20⁄30 (2⁄3)
- 7⁄7 (1)
- 6⁄8 (3⁄4)
- 100⁄1000 (1⁄10)
Adding and Subtracting Decimals:
- 0.10 + 0.35 (0.45)
- 0.02 + 0.03 (0.05)
- 0.50 – 0.20 (0.30)
- 0.33 – 0.03 (0.30)
- 0.65 – 0.15 (0.50)
- 0.12 + 0.08 (0.20)
- 0.80 + 0.20 (1.00)
- 0.01 + 0.14 (0.15)
- 0.95 – 0.35 (0.60)
Exponents:
- 23 (8)
- 42 (16)
- 54 (625)
- 102 (100)
- 112 (121)
- 33 (27)
- 44 (256)
- 25 (32)
- 28 (256)
STEM Words to Know
exponent
An exponent is shorthand notation for raising a number to a particular power. For example, 43 is 4 raised to the 3rd power, which is like writing 4 × 4 × 4. Note that in that example, the number 4 is known as the base and 3 is the exponent or the power.
Solving for an Unknown:
- 4 + X = 6 (2)
- 7 + X = 10 (3)
- 12 – X = 6 (6)
- 2X = 8 (4)
- 3 / X = 3 (1)
- X – 2 = 9 (11)
- X / 2 = 4 (8)
- 5X = 15 (3)
- X + 9 = 17 (8)
For some of the topics you’ll want to keep plenty of scratch paper on hand. Also encourage your child to create his own math review questions for use in the tic-tac-toe game. Encourage him to create some basic questions and some more challenging ones that he can’t easily answer in his head.
Does the Order of Operations Really Matter?
Order of operations can matter a lot if you’re solving a problem involving more than one mathematical operation. Consider the problem 5−4 ÷ 2. Without a predetermined order of operations, you could solve the problem by subtracting 4 from 5 and dividing the result by 2, giving you an answer of 1⁄2. Alternatively you could solve the problem by dividing 2 into 4 and subtracting the result from 5, which gives you an answer of 3. Both 1⁄2 and 3 can’t be correct. The rules of math say you should first perform any operations that are inside parentheses. Then you should take care of any exponents or roots. After that, perform any multiplication and division, working from left to right. Lastly, take care of all addition and subtraction, again moving from left to right. Based on the standard order of operations, 3 is the correct answer to the problem.
STEM Career Choices
Computer Systems Analyst
The work computer systems analysts do is different from what computer programmers do. Computer systems analysts focus on improving an organization’s computer systems and procedures so that they operate as efficiently as possible. Because of the nature of their work, computer systems analysts must be good problem solvers. Most systems analysts have at least a bachelor’s degree in computer or information science, but some organizations hire grads from other degree areas who also possess IT (information technology) skills. Over the next decade, the demand for computer systems analysts is expected to grow much faster than the average demand for all occupations in the United States.
ACTIVITY: Algebra Dice
Use this simple dice game to introduce your child to basic algebra. Algebra is a branch of mathematics in which symbols are used to represent numbers in equations or formulas. Typically, the symbols are letters of the alphabet, such as X or Y. Your child may get so caught up in the game that she may not even realize she’s doing algebra.
Materials Needed:
- Pair of standard dice
- Blank sheet of paper
- Pen or marker
- Scratch paper and a pencil
- Watch or timer (optional)
Game Setup
You’ll first design a game board using the blank sheet of paper and the marker or pen. There are several variations of the game you can play. Choose whichever best suits your child’s current math abilities—though don’t be afraid to challenge her to think a little beyond them.
In the simplest version of the game, you’ll set up the board for addition problems. Using a marker or pen, write ____ + X = ____ on the blank sheet of paper. The spaces should each be about 11⁄2"–2" in width.
Game Play
Algebra Dice is super simple to play. Have your child roll the pair of dice. Place the die with the larger value over the blank on the right side, after the equals sign. Place the other die, the one with the smaller value, over the blank on the left. Explain to your child that the X represents an unknown in the equation. Her task is to figure out what number can be put in place of X to make the equation true. Each time you roll the dice, you create a new equation with a new X to solve. The goal of the game is to solve as many Xs as possible in ten minutes. It may be easier for your child to visualize the problem if, after rolling the dice each time, she rewrites the equation on scratch paper using standard numerals in place of the dots on the dice.
A Strategy for Playing the Game
If your child hasn’t yet worked with equations in math class, she can still play the game. You’ll just need to provide her with a strategy for solving the unknown X.
Explain to her that the equation on the game board is like a scale—not a bathroom scale with a digital readout, but an old-time scale like the proverbial scales of justice (show her a picture from the Internet if necessary). Like those old scales, an equation has to balance out. If one side of the equation has a larger total value than the other side, the equation is out of balance.
For example, if you roll a 6 and a 2 on the dice, the equation on the game board will read 2 + X = 6. What number could be put in place of X to make this equation balance out?
The standard way of approaching this type of problem in math is to isolate the unknown X. Since the two sides of the equation need to balance out, whatever operation is done on the left side of the equation must also be done on the right side. To isolate the X in this example, you would need to subtract 2 from the left side of the equation; then the only value remaining on the left side would be X. But when you subtract 2 from the left side, you also need to subtract 2 from the right side: 2 subtracted from 6 leaves a difference of 4. So after subtracting 2 from each side of the equation, what remains is X = 4. And that is the solution for the unknown X. Following this strategy, the unknown becomes known.
STEM Career Choices
Data Architect
There are numerous specialized job functions and titles within the information technology world. Some titles include data architect, cloud architect, and systems engineer, among others. The distinction among these various roles becomes more critical later on in a person’s job selection process. Many of these positions require similar training at the undergraduate level. To give an example of the differences in the roles, consider a data architect versus a database administrator. Just as an architect creates the designs that are used to construct a house, a data architect designs the structure that will house an organization’s data. In contrast, a database administrator maintains the organization’s database on a day-to-day basis (e.g., backing up data and keeping it secure). Data and databases are so important to companies and other organizations that, since the dawn of the information age, several other related occupations have cropped up, including data modeler, data analyst, and data scientist. All would be excellent for a person with IT skills who also happens to be a good problem solver.
Variations of the Game
One way to make Algebra Dice a bit more challenging is to allow for negative values of the unknown X. Instead of rolling the dice at the same time and placing the larger value on the right, roll each die individually and the place the first die rolled on the right and the second one rolled on the left. You will inevitably have outcomes such as 5 + X = 3. This problem can be solved following the same strategy as outlined previously; the value of the X just turns out to be a negative number.
Another way to raise the level of challenge is to create new game boards featuring different math operations. Following are some suggested ways of setting up the game board:
____ − X = ____
X − ____ = ____
____ X = ____ or (____)(X) = ____
____ / X =____
X /____ = ____
Each time you introduce a new operation, you may need to walk your child through the strategy for solving for X. The same basic principle applies: The two sides of the equation should remain in balance, so whatever operation is done on the right side must be done on the left.
For example, suppose the equation that comes up in the game is 3X = 6. The X can be isolated by dividing the left side of the equation by 3: 3X divided by 3 leaves X. The right side of the equation must also be divided by 3: 6 divided by 3 is 2, so in this case X = 2.
ACTIVITY: Calculating the Circumference of a Pie, Bike Wheel, Car Tire, Etc.
How many circular objects can you find around the house? Ask your child to find some circles, and then practice finding the circumference of those objects.
Materials Needed:
- Tape measure
- Various circular objects
- Calculator
Circle Basics
Even a very young child can identify a circle, but not everyone knows what makes a circle a circle, technically speaking. A circle is a plane shape whose outer points are all the same distance from its center. The distance around the edge of a circle is the circumference. A line through the center, or midpoint, of a circle that connects two of the circle’s outer points is called the diameter. If you cut a pie precisely in half, right down the middle, you’re tracing the pie’s diameter. Half of a circle’s diameter is its radius. A radius connects a circle’s center or midpoint with a point on the circle’s border.
STEM Words to Know
chord
A chord is a straight line connecting two points on a circle’s border. The diameter of a circle is a chord, but of course not all chords are the diameter. A circle’s radius is not a chord, because a radius only touches one point on the circle’s border.
Calculating the Circumference
The formula for calculating a circle’s circumference is relatively easy to use. The circumference can be found by multiplying the circle’s diameter by the numerical constant known as pi, denoted by the Greek symbol π. The number pi is represented by the sixteenth letter in the Greek alphabet, π. It is the ratio of a circle’s circumference to its diameter, π = circumference/diameter. The value of π is approximately 3.14159, but the digits go on infinitely without repeating. The formula is written as:
C = π · d
C represents the circle’s circumference and d represents the diameter. Because a circle’s radius is half its diameter, the circumference can also be found using the formula:
C = 2π · r
where r stands for radius.
The Circle Challenge
Help your child master the circumference formula by challenging her to find several circular objects around the house and measuring the circumference of those items. If more than one child is involved, set it up as a little contest to see who can find the biggest circle, who can find the smallest circle, and who can find the most circles. If your child has trouble locating circles, you can steer her toward a few to get her started.
Here are a few ideas:
- Bike tire
- Car tire
- Plate
- Ring
- Compact case
- Butter tub lid
- Round tabletop
- Bottom of a mug
- Circular pattern on a rug or throw
- Drumhead
- Actual pie (frozen or baked)
Encourage your child to try out both versions of the circumference formula, perhaps even on the same object. Have her choose a circle, measure its diameter, and then, using a calculator, multiply the circle’s diameter by 3.14159. Or, alternatively, she can measure the radius, multiply it by 2, and multiply that product by pi. This activity will help your child learn to use a tape measure while reinforcing the basic geometry of circles.
Calculating the Area of a Circle
Consider taking the activity a step further and ask your child to calculate the area of some of the circles she found. The area of a circle is calculated using
A = π · r2
where A represents the circle’s area and r represents the circle’s radius. Note that π also shows up in the formula for the area of a circle. Not only is π a famous number, it’s also very useful in geometry.
STEM Career Choices
Database Administrator
As the job title implies, database administrators are responsible for maintaining the databases of the organizations they work for. They’re responsible for backing up data and keeping the databases secure. Most people with this job have a bachelor’s degree in computer science or some related field. Because data is an integral part of companies’ everyday business activities, the role of database administrators will continue to grow in importance in the future. According to the Bureau of Labor Statistics, the demand for database administrators will grow faster than the average demand for all U.S. occupations in the coming years.
ACTIVITY: The Cartesian Treasure Map
The Cartesian Treasure Map is a fun activity that can be used to reinforce a child’s understanding of the coordinate system. It’s essentially a board game you can make yourself.
Materials Needed:
- Graph paper
- Felt-tip pen
- Ruler or other straight edge
- Crayons or markers
Begin with a clean sheet of graph paper (a number of websites offer downloadable graph paper free of charge). Using a straight edge and a felt-tip pen, draw two lines, dividing the page into four parts or four quadrants. If you want to be exact, you can take measurements to ensure that your lines are precisely centered. These two lines form the axes for your coordinates. Decide which axis will be your x (or horizontal) axis, and which will be your y (or vertical) axis. After you’ve decided, orient your page appropriately.
Number the x and y axes. The point where the two lines intersect is the origin, whose coordinates are 0 on the x axis and 0 and the y axis. (It’s not necessary to label the origin.) From the origin, begin numbering the points to the right along the horizontal axis. As you move the pen rightward from the origin, the numbers increase (i.e., the point on the x axis one place to the right of the origin is 1, the point two places to the right of the origin is 2, and so on). As you move the pen leftward from the origin, the numbers decrease (i.e., the point on the x axis one place to the left of the origin is –1, the point two places to the left of the origin is –2, and so on).
As you set out to number the y or vertical axis, keep in mind that the numbers increase moving up the axis and decrease moving down the axis. The point on the y axis one place above the origin is 1, the point two places above the origin is 2, and so on. The point on the y axis one place below the origin is –1, the point two places below the origin is –2, and so on.
STEM Words to Know
Cartesian plane
The Cartesian plane, also known as the x-y plane, is divided into four quadrants numbered I through IV. In Quadrant I, the upper right-hand quadrant, both the x and y coordinates are positive. In Quadrant II, the upper left-hand quadrant, the x value is negative and the y value is positive. In Quadrant III, the lower left-hand quadrant, both the coordinates are negative. In Quadrant IV, the lower right-hand quadrant, the x value is positive and the y value is negative.
After you’ve numbered your axes, your coordinate system is ready. You could use it just as it is for a learning activity, but your child will probably have more fun if you dress it up a bit. Invite your child to use crayons or markers to transform the page into a pirate treasure map. Keep in mind that pirate treasure maps are typically quite different from the ordinary kind of map you’d find in an automobile glove box. Common features on a pirate treasure map include islands, palm trees, ships, volcanoes, caves, and skulls. Make sure the number lines remain visible as your child decorates the treasure map.
STEM Q&A
Q: Who was Descartes?
A: René Descartes was a French philosopher and mathematician who lived in the sixteenth and seventeenth centuries. Although he made numerous contributions to science and philosophy, Descartes is best known for developing the Cartesian coordinate system (Descartes in Latin is Cartesius—hence the Cartesian coordinate system). His system provided a link between geometry and algebra by allowing the graphical depiction of algebraic equations.
Using the Map
Of course, everyone knows that an X on a pirate map marks the spot where treasure is buried. You could stick with one X per map, but there’s nothing that says you can’t have more than one treasure marked on your map. Mark some Xs on the map, preferably at least one in each quadrant and one on the origin.
Create a little story for use with the activity. Have your child pretend that he’s the pirate captain and he has to direct his crew to the spots on the map where the treasures are located. How will he direct them to the proper locations? Of course he’ll use Cartesian x-y coordinates!
STEM Career Choices
Geospatial Analyst
Geospatial analysts work with geographic data in what are known as geographic information systems (GIS). Some geospatial analysts are involved in geocoding, which is the process of adding geographic data to a database. Such map-based data typically include features about a particular location, such as terrain, roads, population, income level, etc. Geographic information systems are used for many purposes, including transportation and utility planning (e.g., placement of gas and electric lines), market research, and environmental studies. Some college education is typically required for a person to become employed as a geospatial analyst, with a special emphasis on technical training related to GIS hardware and software.
The x-y coordinates are always given in a particular order. The x value is always given first, and the y value second. Together, a pair of x-y coordinates (known as an ordered pair) designates a particular point on a graph—or, in the case of this activity, a particular point on the map. The x value in the ordered pair gives the horizontal distance from the origin, and the y value gives the vertical distance from the origin.
STEM Words to Know
abscissa
The abscissa is another name for the x value in an ordered pair of coordinates. The y value in an ordered pair of coordinates is also called the ordinate.
For example, the pair of coordinates (3, 2) refers to the point that is three places to the right of the origin on the x axis and two places up on the y axis. The pair of coordinates (–5, –10) refers to the point that’s five places to the left of the origin on the x axis and ten places down on the y axis. The pair (6, –4) refers to the point that’s six places to the right of the origin on the x axis and four places down on the y axis. The origin has the coordinates (0, 0).
After your child successfully “locates” all the treasures by assigning them pairs of coordinates, consider rewarding him with a real treasure. Treats work as well as gold doubloons for hungry pirate captains! You might also consider trying other activities that use the Cartesian plane. For example, work with your child to create a map of your neighborhood, and then ask him to identify coordinates for particular points in the neighborhood.
STEM Career Choices
Actuary
Actuaries use math and statistics to help companies assess risk and uncertainty. Most actuaries work for insurance companies. Actuaries are required to take a series of difficult tests, and the failure rate can be high. On the positive side, once an actuary passes her exams she’ll be sitting pretty with a secure job and relatively high pay. In fact, actuarial science is one of the few fields you can enter without a graduate degree and earn a big salary early on in your career. In college most students interested in actuarial science study mathematics, statistics, or business. There are also some colleges that offer specialized programs in actuarial science. The demand for qualified actuaries is greater than the supply, and that demand is expected to grow in the future.
ACTIVITY: The Geometry Scavenger Hunt
Students tend to become more interested in a subject when they can see its relevance to their daily lives. The Geometry Scavenger Hunt is a simple activity you can use to help your child learn to identify geometric shapes while gaining an appreciation for the importance of geometry in everyday life.
Materials Needed:
- List of geometric shapes (see following)
- Pencil or pen
One person can do the Geometry Scavenger Hunt alone, or it can be set up as a challenge involving two or more scavenger hunters. If your child is hunting alone, challenge her to find as many shapes on the list as she can. To increase the intensity level of the hunt you can consider adding a time limit. If more than one hunter is involved, conduct the activity like a standard scavenger hunt—i.e., the hunter who finds the most shapes by the end of the game wins.
Geometry Scavenger Hunt—List of Shapes:
- Right angle—an angle measuring 90 degrees
- Acute angle—an angle measuring between 0 and 90 degrees
- Obtuse angle—an angle measuring between 90 and 180 degrees
- Circle—a plane shape with all of its outer points the same distance from its center
- Polygon—a plane shape with straight sides
- Quadrilateral—a 4-sided polygon with 4 angles
- Parallelogram—a quadrilateral with 2 pairs of parallel sides
- Rhombus—a parallelogram with 4 equal sides
- Rectangle—a parallelogram with 4 sides and 4 right angles
- Square—a rectangle with 4 equal sides
- Pentagon—a 5-sided polygon
- Octagon—an 8-sided polygon
- Decagon—a 10-sided polygon
- Equilateral triangle—a triangle with three equal sides and three equal angles
- Isosceles triangle—a triangle with two equal sides and two equal interior angles
- Scalene triangle—a triangle with no equal sides and no equal angles
- Acute triangle—a triangle whose interior angles are all less than 90 degrees
- Right triangle—a triangle with one 90-degree interior angle
- Obtuse triangle—a triangle with an interior angle that’s greater than 90 degrees
- Cube—a three-dimensional solid object with 6 identical square faces
- Sphere—a three-dimensional (ball-shaped) object whose surface points are all equidistant from the center
- Cylinder—a three-dimensional solid object with two parallel circular or elliptical ends and a curved outer surface
- Cone—a three-dimensional solid object with a flat circular base that tapers to a single point
Be creative in hunting for shapes. The screen on a flat-screen TV is a rectangle. A drink coaster may be circular. A pattern on a rug might include many shapes in the list.
STEM Q&A
Q: Who was Euclid?
A: Euclid was a Greek mathematician who lived around 300 B.C. and taught mathematics in Alexandria, Egypt. Often referred to as the “Father of Geometry,” Euclid wrote the most important work in the field of geometry, Elements. One of the most studied texts in human history, Euclid’s Elements carefully presents the axioms, theorems, constructions, and proofs that have come to be known collectively as Euclidean geometry.
The Geometry Scavenger Hunt for Younger Children
If you have younger children, try a scaled-down version of the Geometry Scavenger Hunt, using the following list.
Geometry Scavenger Hunt—List of Shapes (Short Version):
- Line
- Circle
- Square
- Rectangle
- Triangle
- Star
- Cube
- Sphere
- Cone
Either version of the scavenger hunt can be done at home or at any location where shapes abound. Consider trying it with your children as a driving game the next time you set out on a family road trip.
ACTIVITY: Mean, Median, and Mode
Statisticians are people who work with numbers every day. Statisticians analyze a group of numbers, which is often referred to as a data set, or just data. The numbers in a data set represent counts or measurements from real life. For example, if you look up the win-loss record of your favorite sports team, you’re looking at data. If you count the number of students in your classroom who are wearing short sleeves versus the number who are wearing long sleeves, you’re working with data.
When statisticians work with a set of data, there are certain things they typically want to know about it. For instance, they often want to know where the center of a set of data lies. There are three common methods statisticians use to find the center (i.e., point of central tendency) of a data set. Each method has a different name, and the answers they yield aren’t always the same.
Mean
You’ve probably come across mean before, but it you may have heard it called a different name. Mean is the same as average. Suppose the heights of the five starting players on the Rockaway Blasters basketball team are as follows:
Joe | 10 ft. (yes, that’s really, really tall!) |
Jenny | 6 ft. |
Jordan | 5 ft. |
Jehan | 5 ft. |
J.J. | 4 ft. |
The collection of the players’ heights is a data set with 5 values. You might be able to make a guess about the central point of this data set by just eyeballing it, but there’s no need to guess. The mean, or average, can easily be calculated by summing the 5 values and dividing that sum by the total number of values in the data set.
10 + 6 + 5 + 5 + 4 = 30
30 / 5 = 6
The mean height of a starting player on the Rockaway Blasters basketball team is 6 feet.
STEM Words to Know
arithmetic mean
The mean, or what people often call the average, is technically known as the arithmetic mean. There are actually other means used in mathematics, such as the weighted mean and the geometric mean, but the arithmetic mean is by far the most commonly used mean concept.
Median
After calculating the mean for the data set, you might think your work is done. But if you examine the values in the data set more closely and compare them to the mean, you may realize that 6 feet is not very representative of the typical Rockaway starting player’s height. In fact, three of the players are significantly less than 6 feet tall.
You’ve calculated the mean correctly. The problem lies in the fact that one of the players, Joe, is a lot taller than all the other players. Joe’s height skews the data set such that the mean is not very representative of the typical player’s height. Joe is what statisticians refer to as an outlier, meaning that his height doesn’t fit neatly with the rest of the data.
When a data set has outliers like Joe, the median is usually a better indicator of the data set’s center. The median is the value that falls exactly at the halfway point in a data set. For example, in a data set composed of the values 1, 2, and 3, the point in the middle, or the median, is 2.
The easiest way to find the median is to first arrange the values in a given data set from smallest to largest. Suppose a data set contains the following values: 100, 35, 15, 20, 5.
Arranged from smallest to largest they are:
5, 15, 20, 35, 100
After the values are arranged from smallest to largest, the next step is to cross out the smallest value and the largest value in the set. Neither value is the median.
5, 15, 20, 35, 100
STEM Words to Know
range
Another measure that is sometimes useful when working with data is the range. It’s easy to calculate the range of a set of numbers. Simply subtract the smallest value in the data set from the largest value in the data set. The resulting answer is the range. For example, if the largest value is 100 and the smallest value is 5, the range is 100 – 5 = 95. The range gives you an idea of the scope of the data you’re working with.
Cross out the next smallest value and the next largest value in the set. Those aren’t the median, either.
5, 15, 20, 35, 100
This process of elimination is continued until there’s only one remaining value—the one exactly in the middle. That value is the median. In this last example, the median is 20. But what if a data set contains an even number of values? Consider a data set made up of the following values:
60, 70, 80, 90
When the smallest and largest values are crossed out, there are two values remaining.
60, 70, 80, 90
In a situation where there are two middle values, the median is determined by finding the mean of those two middle values.
70 + 80 = 150
150 / 2 = 75
The data set 60, 70, 80, 90 has a median of 75.
Back to the Rockaway Blasters basketball team and their starting lineup. Again, the heights of the starting players are 10 feet, 6 feet, 5 feet, 5 feet, and 4 feet.
Arranged from smallest to largest, the players’ heights are:
4, 5, 5, 6, 10
Following the procedure already outlined, it should be clear that the median height of the starting players is 5 feet.
4, 5, 5, 6, 10
In the case of the Rockaway Blasters starting lineup, because Joe’s height is so much different from the other players, the median is a better indicator of the data set’s central point than the mean.
Mode
In some situations, the best representation of a typical value in a data set is given by the mode. The mode is simply the value in the data set that repeats most frequently. In the data set containing the heights of the Rockaway Blasters starting basketball team—4, 5, 5, 6, 10—the value 5 occurs twice (i.e., there are two players who are 5 feet tall). The mode of the data set is 5, or 5 feet.
STEM Q&A
Q: Is the mode always a good measure of central tendency?
A: One shortcoming of the mode as a measure of central tendency is the fact that not every data set has a mode. What if the players’ heights were 4 feet, 5 feet, 6 feet, 7 feet, and 10 feet? None of the values repeat, so there’s no mode. It’s also the case that some data sets have more than one mode. What if the heights of the Rockaway starters were 5 feet, 5 feet, 6 feet, 6 feet, and 10 feet? The value 5 feet occurs twice in the data set and so does the value 6 feet. This data set has two modes.
Some Practice with Mean, Median, and Mode
The next time you’re at a gathering of family or friends, have your child ask everyone in attendance their age. Then the two of you can calculate the mean age of those in attendance. Also calculate the median and mode. See if you can identify any obvious outliers (i.e., friends or family members who are significantly younger or older than the others in attendance).
Have your child ask all of her classmates how many TVs are in their home. Find the mean, median, and mode number of TVs.
Keep track of how much money you spend each day for a month. At the end of the month, calculate the mean amount you spent per day. Also calculate the median and mode. The results may surprise you.
STEM Career Choices
Statistician
Statisticians collect, process, and analyze data using various statistical techniques. Some statisticians use data to make predictions about the future. Nearly all statisticians utilize computer programs to help them complete their analyses. Lots of companies in a wide array of industries hire statisticians. These days it would be hard to find an industry in which statistics is not applied in some manner. Government agencies also use statisticians to prepare and analyze government data. A degree in mathematics doesn’t necessarily qualify a person for a career as a statistician. Statisticians need specialized training in statistical principles and methods, along with training in one or more of the prominent statistical analysis software packages. A graduate degree in statistics is, of course, the best training for a person who wishes to pursue a career as a statistician. A bachelor’s degree may be enough to land someone an entry-level job in the field.
ACTIVITY: Pies and Bars
Organizing and presenting data is an important part of statistics. There are several ways data can be displayed visually. Data can be presented in a table, a graph, or a chart. One of the most common graphic forms for data display is the tried-and-true pie chart.
Pie Chart Basics
Everyone who’s flipped through magazines or newspapers has seen pie charts. Popular periodicals such as USA Today frequently use pie charts to present data in an easily digestible manner.
Here’s an example of a pie chart that shows the causes of airline delay.
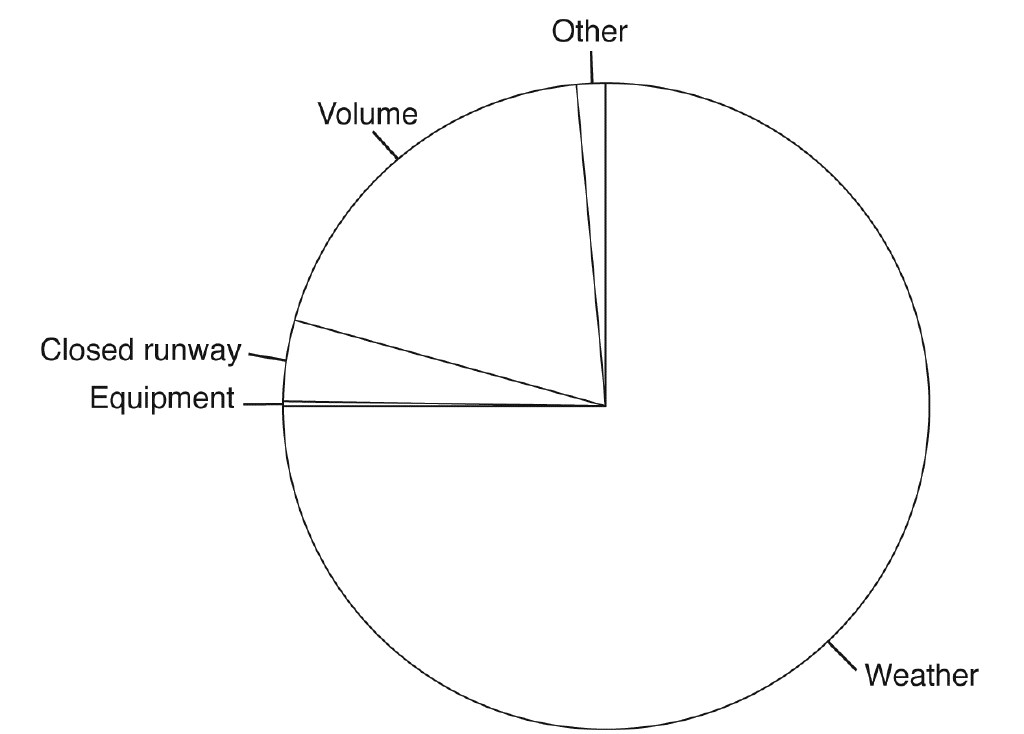
The whole circle or “pie” represents the full universe of reasons why flights might be delayed. Each section, or piece of the pie, represents a particular reason why flights may be delayed. As you might gather from examining the pie chart, the biggest reason for flight delays is weather. The least significant reason for flight delays is equipment failure. The sizes of the sections of the pie chart correspond to the data represented in the chart. Pie charts are easy to interpret when they’re used properly.
Making a Pie Chart by Hand
There are a number of computer programs you can use to generate accurate pie charts. However, if your child goes through the process of creating one by hand, he’ll have a better understanding of the mechanics of pie charts and of how the underlying data fits into the chart. He’ll also get a little practice with some basic geometry concepts.
Materials Needed:
- Blank paper
- Pencil
- Compass
- Protractor
- Set of colored pencils or markers
You’ll want to begin by converting your “raw” data into percentages. An example will help clarify the process. Suppose you have ten people living in your household, and you have your child go around and ask each one his or her favorite flavor of ice cream. Suppose your child discovers from his survey that 5 of the people in your household like chocolate ice cream the best, 3 like vanilla the best, and 2 prefer strawberry. In percentage terms, 5⁄10 or 50% of the members of your household prefer chocolate, 30% prefer vanilla, and 20% like strawberry the best.
STEM Words to Know
raw data
Raw data is data that hasn’t yet been processed—much like raw food is food that hasn’t yet been processed. If you ask three different people their ages and write down their responses, you’ve gathered raw data. If you calculate the average, or mean, of those three ages, then the data has been processed; it’s no longer raw data.
After your child has converted his raw data into percentages, have him pause for a moment to add up the resulting percentages. If they don’t total 100%, he needs to check over his work; the percentages should add up to 100.
The next step involves a little geometry. Keeping in mind that a whole circle is 360 degrees, he’ll want to multiply each of his percentages from the first step by 360. This will give him the angles he needs to create each section of the pie chart.
50% × 360 degrees = 180 degrees
30% × 360 degrees = 108 degrees
20% × 360 degrees = 72 degrees
At this point he may want to pause and check his math again. Be sure the degrees add up to 360. If the math checks out, then he’s ready to begin drawing his pie chart.
He should start by drawing a circle on a blank piece of paper using the compass. Make the circle large so that he can easily divide it into slices. There should be an indentation in the paper, in the circle’s center, where the compass needle rested. From that center, he can draw a straight line to the edge of the circle. Then, using the protractor, he should measure out his first angle and draw the corresponding line on the chart. Returning to the ice cream flavor example, the first angle is 180 degrees. After measuring a 180-degree angle and drawing the line, he will have cut the pie exactly in half.
Next he’ll measure out the remaining angles and draw the corresponding lines, sectioning the circle into the appropriately sized slices. In the ice cream example, there will obviously be three sections or slices.
The sections of a pie chart are typically color-coded to a key. After your child has converted the raw data into percentages and calculated and drawn the angles, he can choose a color to represent each section of the pie and shade in the sections. Lastly, he can create a color key along one side of the page explaining the meaning of each color in the pie chart.
An Additional Pie Chart Activity
After your child successfully creates the pie chart in the example, invite him to try another one from scratch. The extra step of gathering the raw data will help him see the connection between real-world information and two-dimensional charts and graphs.
The same materials are required as those listed in the previous activity. The only difference is that your child will gather his own data. Have him ask ten friends or classmates one of the following questions and carefully record the answers:
- What’s your favorite sport to watch on TV?
- What’s your favorite subject in school?
- What’s your favorite holiday?
- What’s your favorite season?
When he’s gathering the data, it’s important that each person surveyed give only one response. It doesn’t work if someone says he likes Thanksgiving and Halloween equally, unless your child collects responses such as those into a category called “Undecided” or something similar. For the pie chart to make sense, the categories represented by the sections must be mutually exclusive.
STEM Words to Know
mutually exclusive
When categories are mutually exclusive it means that items can only belong to one category at a time. For example, “dead” and “alive” are generally considered to be mutually exclusive categories. A person or an animal can’t be both dead and alive at the same time. The seasons of the year are also mutually exclusive categories. You can’t find a date on the calendar that falls both in the spring and the summer because the seasons have clearly defined beginnings and endings.
After your child gathers the data, guide him through the steps outlined previously. It might be interesting to try creating the pie chart using Excel or another chart generator, and then compare the computer version to the home-grown one.
Bar Chart Basics
The bar chart is another widely used graphical display for certain types of data. A bar chart—also called a bar graph—uses bars to represent data in various categories. The bars’ heights (or lengths) are proportional to the data being presented. The bars on a bar chart can be vertical or horizontal. Note that in Excel a bar chart uses horizontal bars. In Excel, a chart that uses vertical bars is called a column chart.
STEM Career Choices
Market Research Analyst
Businesses are always trying to figure out what customers want. Market research analysts study market conditions and trends to determine whether or not products are meeting consumers’ needs, how products can be improved, and the best ways companies can communicate information about their products to potential consumers. Market research analysts gather data and attempt to spot trends in the data. Sometimes they identify new markets for old products. They also help companies figure out which of their advertising and marketing methods are bringing in the most customers. Market research analysts must have strong analytical skills, so classes in statistics, mathematics, and economics will prove useful, alongside their marketing classes. Most market research analysts will also need to learn the ins and outs of one or more of the prominent software packages used in the field.
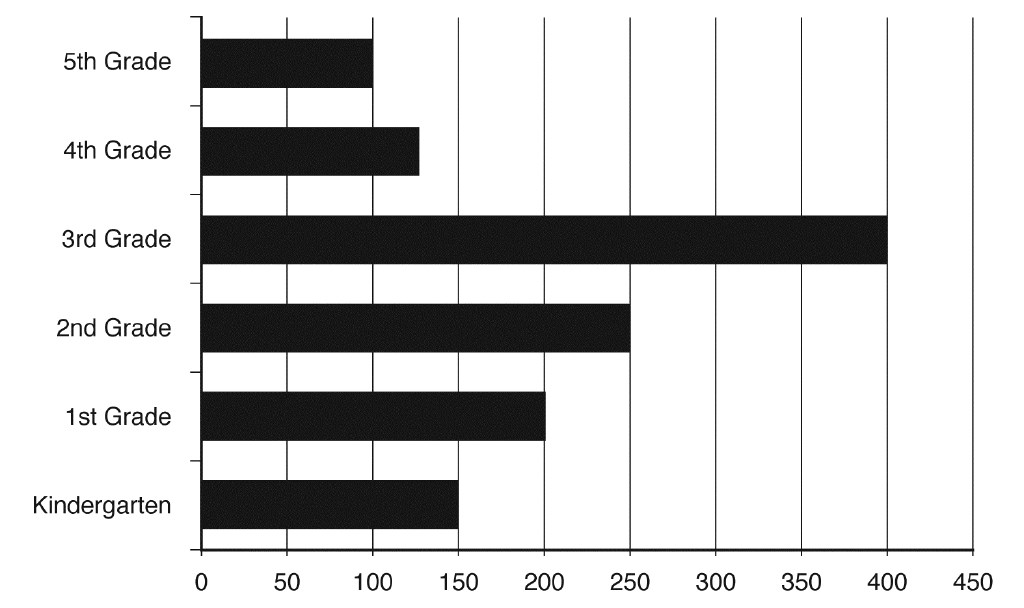
Suppose you and your child want to create a bar chart that shows candy bar consumption by grade for a particular elementary school for a particular month.
Materials Needed:
- Paper
- Pencil or pen
- Ruler
- Set of colored pencils or fine-tip markers
Start by gathering the following data for Greenwood Elementary for the month of October:
| Candy Bars Consumed by Grade—October | |
|---|---|
| Grade | Candy Bars Consumed |
Kindergarten | 150 |
1st Grade | 200 |
2nd Grade | 250 |
3rd Grade | 400 |
4th Grade | 125 |
5th Grade | 100 |
Have your child use the ruler to create a box that will frame your bar chart. Assuming you want to create a horizontal bar chart, have your child write the categories along the left side of the chart, roughly equidistant apart: K, 1st, 2nd, 3rd, 4th, 5th. Remind your child to be sure to leave enough space for the bars, and for spaces between the bars.
Next, using the ruler, your child should create a scale along the bottom of the bar chart. Given the data you’re graphing, you might use a scale such as “1" equals 100 candy bars.” That would make the largest bar in your chart 4" long. The kindergarten bar will be 11⁄2", the 1st grade bar will be 2", and so on. Have your child color the bars different colors to help set them apart from one another visually. If you’d prefer a smaller bar graph, you can easily reduce the scale. Below is a bar graph representing the candy bar data that uses 1⁄2" for every 50 candy bars.
Invite your child to practice creating her own bar chart with other topics as well. She can gather some raw data by asking four or five friends one of the following questions:
- How many states have you visited?
- How many pets have you had in your lifetime?
- How many musical instruments are in your home?
- How many cousins do you have?
- How many times have you flown in an airplane?
- How many plants are in your home?
Each friend will represent a category in your child’s bar chart. Depending on her age and mathematical ability, you may have to help your child create a scale for her chart. Allow her to complete as much of the chart as she can on her own. Remind her to dress up her bar chart by coloring each of the bars a different color.
STEM Words to Know
pictograph
A pictograph is a type of graphical display that is very similar to a bar chart. A pictograph uses images or symbols to represent data. For example, suppose you wanted to create a graphic displaying the numbers of cars in each of three automobile categories: gas, electric, and hybrid. You could present your data using a traditional bar chart, or you could use a pictograph in which the bars are replaced by pictures of little cars (each car symbol in your chart might represent 1,000 actual cars, for instance). Like a bar chart, the symbols in a pictograph can be stacked horizontally or vertically.
ACTIVITY: Learning Probability with Playing Cards and Dice
People frequently tend to miscalculate the likelihood, or probability, of various events occurring. Some of the rules of probability are complex and best suited for a college-level course or an advanced-level high-school course. But some of the basics of probability can be understood by a student in elementary school. The following activities provide an introduction to some basic aspects of probability theory.
Card Probability
Materials Needed:
- Standard deck of playing cards
- Blank sheet of paper
- Pen or pencil
First remove the jokers from the deck so that you have fifty-two total cards. If your child isn’t familiar with cards, show her four suits and the various card denominations. Two of the suits are black (clubs and spades) and the other two are red (hearts and diamonds). There are thirteen cards in each suit: the numbers 2 through 10, the three face cards, and one ace. To learn about probability using the card deck, it’s best to arrange the cards face up on the table in their respective suits. Explain to your child that you’re going to leave the cards face up, but she should imagine that the cards have all been turned face down.
STEM Words to Know
classical probability
Classical probability is one of the more common approaches to calculating probability. The approach applies to situations in which all the outcomes are equally likely. Based on classical probability, the likelihood of a particular event occurring is equal to the number of favorable outcomes divided by the number of total possible outcomes. For instance, if you’re rolling a single die the number of possible outcomes is 6. If you’re interested in the probability of rolling an even number on the die, there would be 3 favorable outcomes. Thus, using the classical approach, the probability of rolling an even number is 3⁄6, or 0.5.
Now ask your child the following questions:
If someone were drawing a card at random (unseen), what is the likelihood that person would choose:
- A heart
- A red card
- A king
- The king of hearts
- A king or a heart
STEM Career Choices
Cryptographer
The field of cryptology (or cryptography) involves creating codes and algorithms for encrypting data, as well as devising techniques for breaking codes designed by others. It may all sound like secret spy stuff, and in fact, many people who work in the field are employed by the military. But many non-military organizations also need encrypted data and secure communications, such as banks, credit card companies, and law enforcement agencies. Many cryptographers have graduate training in advanced mathematics or computer science. It may be possible to attain an entry-level position with a bachelor’s degree in one of those fields. Cryptographers who work for the military must receive a security clearance before working with classified information.
Some Probability Basics
Probability can be expressed as a fraction, in decimal form, or as a percentage. For example, you might hear the weather forecaster say there’s a 40% chance of rain later in the week. The weather forecaster is making a statement about probability.
STEM Q&A
Q: What is the range of probability?
A: The probability of anything occurring is always somewhere between 0 and 1 (0% and 100%), inclusive. An event can never have a 110% probability of occurring. Probability also can’t be negative. There could never be a –15% chance of rain later in the week, for instance.
It should be fairly easy to see that the probability of drawing a heart is 13⁄52, since there are 13 hearts and 52 total cards. That, of course, simplifies to 1⁄4 or 0.25.
The Special Rule of Addition
The probability of drawing a red card will be greater than 1⁄4 since there are more red cards in the deck than hearts. One of the basic rules of probability is the special rule of addition, which says that the probability of A or B occurring is the same as the probability of A occurring plus the probability of B occurring, as long as A and B are mutually exclusive. In this case, A and B are mutually exclusive because a card can’t be both a heart and a diamond—a single card can only belong to one suit. Therefore the probability of drawing a red card is the probability of drawing a heart plus the probability of drawing a diamond, or 1⁄4 + 1⁄4 = 1⁄2.
STEM Words to Know
complement rule
The complement rule is another useful probability rule. Complementary events are events whose probabilities sum to 1. In a standard deck of cards (sans jokers), drawing a red card and drawing a black card are complementary events. Since you know that the probability of drawing a red card is 1⁄2, you instantly know that the probability of drawing a black card is 1⁄2, because the two events are complementary.
The General Rule of Addition
There are 4 kings in the deck, so the probability of drawing a king is 4⁄52, which simplifies to 1⁄13 or 0.077. Likewise, you can see that the probability of drawing the king of hearts is 1⁄52, or 0.01923, since there’s only 1 such card in the deck.
The special rule of addition doesn’t work for calculating the likelihood of drawing a king or a heart. If you’ve followed along with the entire activity so far, you’ve already seen that the probability of drawing a heart is 13⁄52. Following the special rule of addition, the probability of drawing a king plus the probability of drawing a heart would be 4⁄52 + 13⁄52 = 17⁄52. But that answer is not quite correct. With the cards spread out in front of you face up, you can see that there are 13 hearts and 3 kings that aren’t hearts. So the likelihood of drawing a king or a heart is actually 16⁄52.
The reason the special rule of addition doesn’t work in this case is because the category “king” and the category “heart” are not mutually exclusive. There is overlap between the two categories because the king of hearts belongs to both categories. When A and B aren’t mutually exclusive, you have to rely on another probability rule, the general rule of addition.
The general rule of addition says that the probability of A or B occurring is the probability of A occurring plus the probability of B occurring, minus the probability of A and B both occurring. Thus the probability of drawing the king of hearts is equal to the probability of drawing a king plus the probability of drawing a heart, less the probability of drawing the king of hearts, or:
4⁄52 + 13⁄52 – 1⁄52 = 16⁄52
Extending the Activity
There are several ways you can extend the probability playing card activity. Ask your child to calculate the probability for each of the following scenarios.
If someone were drawing a card at random (unseen), what is the likelihood that person would choose:
- A club or spade
- A face card
- An ace
- The ace of spades
- An ace or a spade
Encourage your child to try using the special rule of addition to solve #1 and the general rule of addition to solve #5.
Another way to extend the activity is to choose one of the probabilities related to the card deck and test it out. For example, the probability of drawing a red card is 1⁄2. Invite your child to turn the cards face down, shuffle them, draw a card at random, and record whether it’s a red or black card. Repeat the shuffle and draw twenty times or so, making sure to replace the card after each draw. Consult the record and see if a red card was drawn approximately half the time. Repeat the experiment for another of the card probabilities.
Dice Probability
Games of chance are all about probability. In fact, the first rules of probability were devised because a seventeenth-century French nobleman wanted to gain a better understanding of a particular casino game. His appeal to mathematician Blaise Pascal, and Pascal’s subsequent correspondence with mathematician Pierre de Fermat, led to the birth of probability theory.
Earlier in this chapter, two basic rules of probability—the special rule of addition and the general rule of addition—were introduced using a card activity. Here, another important probability rule is introduced using a simple dice activity.
Materials Needed:
- Pair of dice
- Blank paper
- Pen or pencil
Probability for a Single Throw
Start with a single die. Ask your child what her favorite number is between 1 and 6. Then ask if she can figure out the likelihood of rolling her favorite number on a die. It should be fairly easy for her to see that the probability of rolling any number between 1 and 6 is 1⁄6. This is a simple calculation based on the notion of classical probability.
STEM Words to Know
empirical probability
Classical probability is only one approach that is used to calculate the likelihood of various events occurring. Empirical probability relies on using information from the past to determine probabilities for future events. For example, suppose that you have a mouse that, over the course of a month, appears in your house 3 mornings out of 4. The probability of the mouse appearing on any particular future morning would be 3⁄4, or 0.75, based on the notion of empirical probability.
Probability for Multiple Throws
It’s easy to calculate the likelihood of rolling any particular number on one throw of a die. But what about multiple throws? Suppose your child said her favorite number on a die was 5. The probability of rolling a 5 on a single throw of the die is 1⁄6. What’s the probability of throwing two 5s in a row?
Neither the special rule nor the general rule of addition will help answer that question. Both of those additive rules apply to situations in which you want to find the probability of A or B occurring. Calculating the probability of throwing two 5s on a die is about finding the probability of A and B occurring. Specifically, you want to know the probability of throwing a 5 and then another 5 on a die. For a problem like this, you’ll want to use a basic probability rule known as the special rule of multiplication. The special rule of multiplication is used when you want to find the likelihood of A and B occurring. It’s important to note that the special rule of multiplication only works in cases where A and B are independent events.
STEM Words to Know
independent events
Two events are considered independent events if the occurrence of one has no effect on the probability of the other occurring. For instance, the probability of drawing a black card from a standard 52-card deck is 1⁄2. If you draw a black card and subsequently put it back in the deck, the probability of drawing a black card a second time remains 1⁄2. The first draw and the second draw would be independent events. However, if you draw a black card and keep it out of the deck, the probability of drawing a second black card is no longer 1⁄2. In this case, the first draw and the second draw are not independent because the first draw impacts the probability of the second draw.
The special rule of multiplication is easy to use. It states that if A and B are independent events, the probability of A and B both occurring is equal to the probability of A occurring times the probability of B occurring.
The probability of rolling a 5 on the first roll of a die is 1⁄6. Think of that as event A. The probability of rolling a 5 on the second roll of a die—event B—is also 1⁄6. So the probability of rolling two 5s in a row is (1⁄6) × (1⁄6) = 1⁄36.
With paper, a pen, and a little time, you can prove to yourself that the special rule of multiplication works. Invite your child to write out on a sheet of paper all the possible arrangements of two throws of a die. She can actually draw pictures of dice with dots, if it helps her visualize the problem.
One possible arrangement is a 1 on the first throw of the die, and a 1 on the second throw. Another possible arrangement is a 1 on the first throw and a 2 on the second throw, and so on. When your child finishes drawing out the possibilities, there should be 36 different arrangements depicted on the page. How many of those arrangements include a 5 on the first roll and a 5 on the second roll? Only 1 of them does: 1 out of 36 possible arrangements. But this is a somewhat time-consuming way to solve the problem. The special rule of multiplication yields the answer much more quickly.
Note that when the events are not independent, the calculation of probability becomes more involved. A discussion of probability in those situations is better suited for an advanced-level class in high school or college.
Extending the Activity
Ask your child to calculate the probability of each of the following events. Remind her to use the special rule of multiplication where it’s appropriate.
Find the probability of each of the following events:
- Rolling an even number on a single die
- Rolling two 5s in a row on a die
- Rolling three 5s in a row on a die
- Flipping a coin and having it turn up heads
- Flipping two heads in a row on a coin
The special rule of multiplication works for any number of independent events. The probability of A and B and C occurring can be found using the special rule of multiplication as long as the three events are independent. So the probability of rolling three 5s in a row on a die is (1⁄6) × (1⁄6) × (1⁄6), which equals 1⁄216, or 0.00463.
ACTIVITY: The Birthday Problem
The Birthday Problem is a well-known scenario in statistics that is fun to test out in real life. The problem begins with a simple question: If you have 23 people in a room, what’s the likelihood that 2 of them share the same birthday? When considering the question, ignore February 29, which of course doesn’t come around every year. Also, only consider the month and day of birth, not the year.
You might assume it would be very unlikely for 2 or more individuals in a group of 23 to have the same birthday, but actually the probability is higher than most people would expect. The probability is greater than 50 percent that 2 or more people in a group of 23 will share a birthday. The statistical explanation, which is somewhat advanced, is presented here:
Using the special multiplication rule mentioned previously, you can calculate the probability that 2 people in a group of 23 do not share a birthday as follows:
 ×
×  ×
×  × . . . ×
  = 0.4927
This expression states that the probability of the 2nd person not sharing a birthday with the 1st person is , the likelihood of the 3rd person not sharing a birthday with the 1st or 2nd person is , and so on.
If the probability of 2 people in 23 not sharing a birthday is 0.4927, then the probability of 2 of them sharing a birthday can be calculated as follows:
1 − 0.4927 = 0.5073 or 50.7 percent
The Birthday Problem is a great activity to try out at a gathering of 23 or more people. But it can also be done as a travel game, even if you’re not traveling with 22 other passengers. There are a couple of ways you can approach the Birthday Problem as a travel game. If you have, say, 4 people in the car, you can begin with the birthdays of those 4 individuals. Then if each of the 4 can think of 5 other birthdays of people he or she knows, you’ll have a sample of at least 24 birthdays. Another way you can approach the problem as a travel game is to have someone (not the driver) text people and ask their birthdays. If you repeat this activity several times, asking different subjects for their birthdays, you should have a birthday match on roughly every other trial. Incidentally, if you ask 57 different people their birthdays, there’s a 99 percent likelihood that 2 of the 57 will share a birthday. The Birthday Problem may seem like a paradox, but it has a solid statistical explanation.
STEM Career Choices
Economist
Many people confuse economists with stockbrokers, but the two careers are very different from each other. Economists gather and utilize data to solve economic problems. Lots of economists never deal with stocks or bonds as part of their work. An economist may work with a company to help it set prices for a new line of products. An economist might help a local government determine the optimal, or best, tax rate for a new hotel tax. Economists are employed in a wide array of industries, with a large number concentrated in the banking and finance industries. Economists also work for universities, and in all levels of government. Most professional economists earn graduate degrees in economics, but some entry-level jobs are available for individuals with bachelor’s degrees in economics.
ACTIVITY: How Many Zeros Are in a Quadrillion?
The zero is undoubtedly one of the greatest inventions in the history of mankind. If you doubt that statement, just take a moment to think about what our number system would be like without it. Instead of having ten digits—0, 1, 2, 3, 4, 5, 6, 7, 8, and 9—we would need a unique digit for every number used. If you counted 100 of something, you couldn’t write it as a 1 followed by two zeros. You would have to write it using unique symbols. Can you image how complicated our number system would be without the zero? When most people think of a number with a whole bunch of zeros, they immediately think of money. The information in this section pertains to zeros whether they’re part of a monetary figure or not.
The Importance of Place Value
The number system most commonly used today is known as the decimal or base 10 system. The value of a particular digit depends on its place value, or where it lies in the number. The place to the immediate left of the decimal is the ones place. Immediately left of that is the tens place. Left of that is the hundreds place, then the thousands place, then the ten thousands place, and so on.
To the immediate right of the decimal is the tenths place. To the right of that is the hundredths place. Right of that is the thousandths place, then the ten thousandths place, and so on. Of course, when it comes to dollar amounts, the number is usually rounded to the hundredths decimal place.
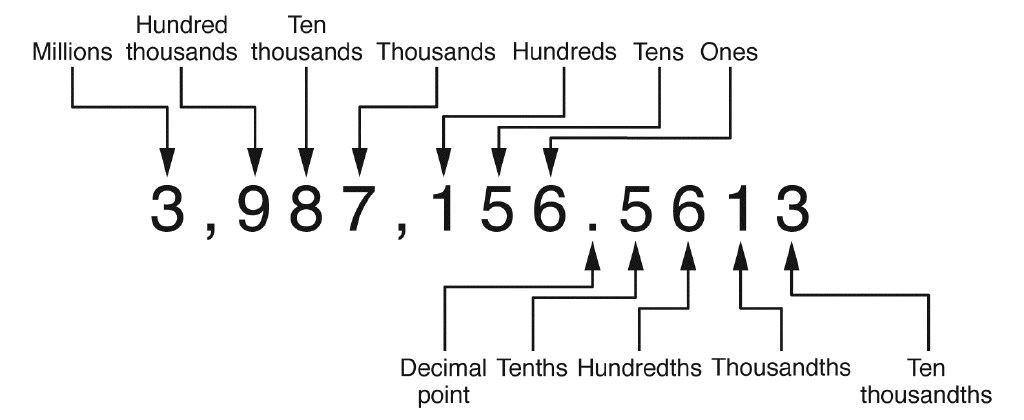
Decimal Place Value Chart
The zero serves as a placeholder. For example, if you write the number one hundred and one in digits you’ll write 101. The 1 in the hundreds place indicates 1 hundred, the 0 in the tens place indicates 0 tens, and the 1 in the ones place indicates 1 one. Without the zero you would have to write 11, but that wouldn’t carry the same value as 101. With the zero as a placeholder in the tens place, you know that you’re dealing with a number whose value is at least one hundred.
The Place Value Game
Try this simple game that will help reinforce your child’s understanding of place value in the decimal or base 10 number system.
Materials Needed:
- Blank paper
- Black marker or felt-tip pen
- Pencil and eraser
- Pair of dice
- Watch or timer
Using the black marker, create spaces by drawing short blank lines on the paper for the millions place through the ten thousandths place. Be sure to include the decimal, which will serve as a reference point. When you’re finished, you should have seven spaces to the left of the decimal point and four spaces to the right of the decimal. You can use the place value chart provided as a guide.
After you’ve created your game board, randomly choose digits to populate the spaces. (You might want to use a pencil so you can erase the numbers later and reuse the game board.) You can roll a single die repeatedly and use the resulting numbers to populate the spaces, or you can use an online random number generator, or you can simply pick numbers from thin air. When you’re finished, you should have all eleven spaces filled with a number.
To begin the game, have your child roll a single die and note the resulting number. He should look for that on the game board. Be sure to set the timer—he has ten seconds from the time he rolls the die to identify the place value of the number on the die. For example, suppose he rolls a 2 on the die. He should look for a 2 on the game board. Suppose there is a 2 in the thousands place. He has until the timer runs out to say “thousands place.” If he does so within the time limit, he wins the round. If the number on the die appears in more than one place on the game board, he may choose one place value to identify.
If your child rolls a 2 and there are no 2s on the game board, then have him roll again. He should alternate between rolling a single die and the pair so that values over 6 will be included in the game. When he rolls the pair of dice he should promptly add the dots on the dice and look for that number on the game board. If the numbers on the dice sum to 10, 11, or 12, then he may disregard the dice and just identify the place value of any number on the board he wishes. Play until your child has successfully identified the place value of each digit on the game board, then erase the numbers and try again with new numbers. You can also consider trying an extension of the game where you add a dollar sign on the left side and only carry the decimals to the hundredths place. You might find that your child has an easier time identifying place values when the numbers are dollar amounts.
STEM Words to Know
googol
One famous large number is the googol, which is 10 raised to the hundredth power, or 10100. Written out, a googol would be 1 followed by 100 zeros. The googol doesn’t have any special significance in mathematics, but it did inspire the name of an extremely well-known search engine.
Really Big Numbers
What’s the biggest possible number in the universe? The truth is there’s no limit on how large (or how small) a number can get. Most people know that a million comes after a thousand, and that a billion comes after a million. Lots of people also know that a trillion comes after a billion. But what comes after a trillion? Take a look at the following list to find out.
Really Big Numbers:
- A million has 6 zeros: 1,000,000
- A billion has 9 zeros: 1,000,000,000
- A trillion has 12 zeros: 1,000,000,000,000
- A quadrillion has 15 zeros: 1,000,000,000,000,000
- A quintillion has 18 zeros: 1,000,000,000,000,000,000
And the numbers get bigger (and the names stranger) than a sextillion. To cite a few examples, an undecillion has 36 zeros, a quattuordecillion has 45 zeros, and a novemdecillion has 60 zeros!
STEM Career Choices
Accountant
Every company, every nonprofit organization, and every government agency has a need for accounting work. Accountants prepare and analyze financial statements. Essentially they help organizations keep their financial records in order. Some accountants specialize in preparing tax returns, or in helping individuals and companies come up with strategies for reducing their taxes. Others in the field work as auditors, meaning that they’re hired to make sure a company’s financial statements comply with the law. A bachelor’s degree in accounting, or some closely related field, is required for most entry-level jobs in accounting. Many accountants also earn a special certification, such as CPA (certified public accountant) or CMA (certified management accountant).
ACTIVITY: Money’s Value over Time
One of the best-kept secrets about money is how its value changes over time. Actually it’s not really a secret, but many people seem to ignore or overlook the concept of the time value of money. The younger you are when you learn about the time value of money, the greater your opportunity to take advantage of it.
Simple Interest
When you keep your money in the bank—in a savings account or certain other types of accounts—the bank pays you for keeping it there. The money the bank pays you is known as interest. Interest is expressed in percentage terms. Just to make the math straightforward, suppose the bank is paying interest of 5% annually to hold your money. Note that the bank doesn’t just park your money; the bank actually uses your money to make loans to borrowers who are looking to buy houses, cars, businesses, and other big-ticket items.
Suppose you put $100 in your account at the beginning of the year. How much would you have in your account at the end of the year, assuming you didn’t make any other deposits or any withdrawals during the year? Your end-of-year balance would be equal to your beginning balance plus the interest you earned over the year. If the bank pays 5% interest on a yearly basis, the amount of interest earned over the year would be $100 × 5%, or $5. (Note that 5% in decimal form is 0.05, so 100 × 0.05 = 5.) Your balance at the end of the year would therefore be $100 + $5 = $105.
STEM Q&A
Q: Are there any shortcuts for figuring out the ending year balance?
A: Yes, if you have an interest rate. Simply multiply the beginning balance by 1 + the annual interest rate in decimal terms to arrive at the ending account balance. Using the example given, $100 × 1.05 = $105.
Compound Interest
The beautiful thing about interest paid on bank deposits is that it keeps on accumulating as long as there’s money in the account. Not only does the bank pay interest on the initial amount you deposited, but the bank also pays interest on the interest your account previously earned. This is known as compound interest, and it makes saving money a lot of fun.
For example, at the end of year two, you would have $110.25 in your account, assuming you didn’t make any additional deposits or any withdrawals in the second year. That amount is found by multiplying $105 by 5% (or 0.05) and adding that value—which is the interest earned in the second year—to your account balance at the end of the first year.
$105 × 5% = $5.25. And $105 + $5.25 = $110.25
Take a few moments and help your child calculate what the balance will be at the end year three, again assuming that no additional deposits and no withdrawals are made during the third year. If she understands decimal math, she should be able to figure out that the account balance at the end of year three will be approximately $115.76 (calculated by $110.25 × 1.05).
A Formula for Calculating Compound Interest
Suppose you left the $100 in the bank for ten years, and the bank paid 5% interest per year. You could calculate the ending balance by hand using the method already outlined. There is a faster way to arrive at the answer, but it requires a bit more math ability. The formula for calculating compound interest for interest compounded annually is:
PV × (1 + r)n = FV
where PV is the present value or starting account balance, r is the yearly interest rate (in decimal form), n is the number of periods, and FV is the future value, or the ending balance of the account. At the end of ten years, your account that started with $100 will have a balance of:
$100 × (1.05)10 = $162.89
It’s interesting to note that after fourteen years, the account will have a balance of approximately $198. Within fourteen years, your money will have nearly doubled, thanks to the magic of compound interest. Note that the formula becomes slightly more complex if the interest is compounded semiannually, quarterly, monthly, or daily.
A Savings Plan
Perhaps after explaining compound interest to your child, you can help her create a savings plan. There’s a formula that determines how much money you would have in an account if you were to save a set amount on a regular basis. Suppose your child managed to save $1,200 per year, depositing that amount at the end of each year, for forty years. At a 5% annual interest rate, after forty years, she would have about $144,960 in her account. Without interest payments she would only have $1,200 × 40 = $48,000. See the difference compound interest makes over time? People who begin saving while they’re young and save consistently over a number of years can accumulate a large amount of money.
Compound interest problems can get complicated, depending on the particulars of the problem. There are financial calculators, software programs, and online calculators to help solve more advanced problems. The main purpose of this section is to highlight the concept of the time value of money and to introduce some of the basic math involved in these important financial calculations.
STEM Career Choices
Financial Analyst
Companies like to be wise with their money, just as most individuals do. Financial analysts help companies invest their money wisely. Financial analysts—who are sometimes called investment analysts or securities analysts—work for banks, mutual funds, insurance companies, and other firms. As part of their job, financial analysts must stay up to date on the latest financial news. Many of them become experts in a particular industry, or in a handful of industries. To get a job as a financial analyst you need at least a bachelor’s degree in finance, accounting, business administration, statistics, or some related field. A graduate degree may be required for higher-level positions. The demand for financial analysts is expected to grow at a faster-than-average rate over the coming years.
Extra Practice
To be sure your child understands basic time value of money calculations, invite her to try the following problems.
Calculate the future value, or ending account balance, in each of the following scenarios:
- The beginning balance is $1,000, the yearly interest rate is 4%, the number of years is 4.
- The beginning balance is $1,000, the yearly interest rate is 1%, the number of years is 4.
- The beginning balance is $1,000, the yearly interest rate is 4%, the number of years is 12.
- The beginning balance is $1,000, the yearly interest rate is 8%, the number of years is 4.
- The beginning balance is $2,000, the yearly interest rate is 4%, the number of years is 4.
Answers:
- $1,000 × (1.04)4 = $1,169.86
- $1,000 × (1.01)4 = $1,040.60
- $1,000 × (1.04)12 = $1,601.03
- $1,000 × (1.08)4 = $1,360.49
- $2,000 × (1.04)4 = $2,339.72
STEM Career Choices
Software Engineer
Sometimes people use the terms computer programmer and software engineer (or software developer) interchangeably, but there is a difference. Programmers usually have great coding skills, but they may not always operate with the big picture in mind. Software engineers work with the people who will be using the application, and they strive to make sure the final product does what it’s supposed to do. A computer programmer may work on a particular part of an application; a software engineer makes sure that the different component parts fit together in the end and that the program works as intended. Computer programming is more of an individual activity while software engineering requires more teamwork. Demand for software engineers is strong and is expected to remain strong in the coming years.