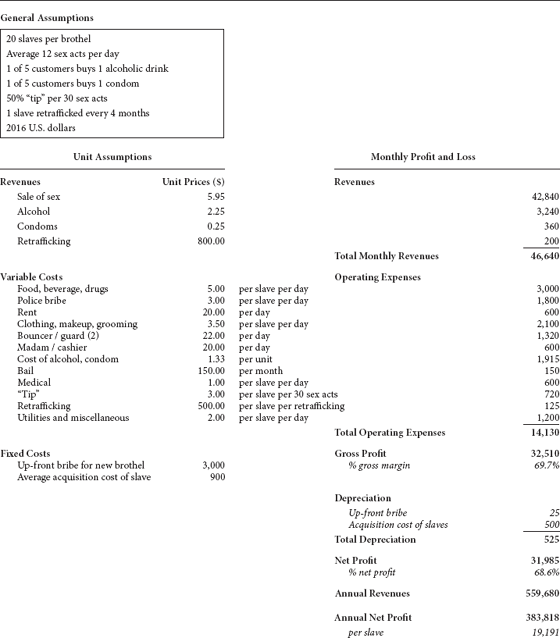
TABLE B.1 Sex Trafficking: Brothel (India)
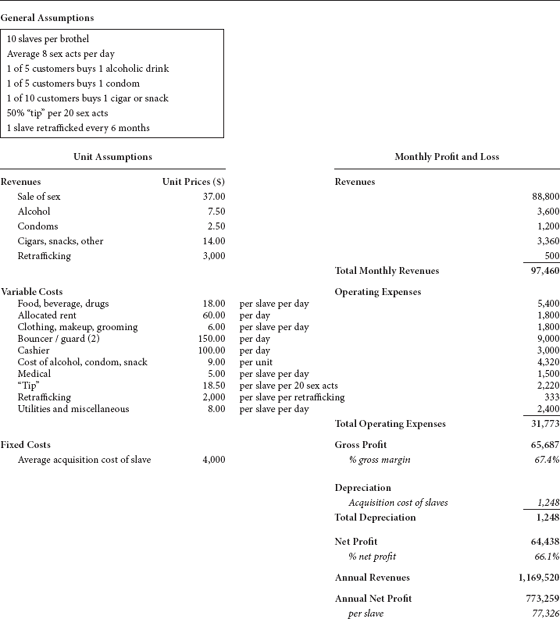
TABLE B.2 Sex Trafficking: Brothel (Thailand)
TABLE B.3 Sex Trafficking: Brothel (United States)
TABLE B.4 Sex Trafficking: Nigerian Street Prostitution (Western Europe)
TABLE B.5 Bonded Labor: Brick-Making in India
1This is a weighted average based on piece-rate wages and day wages paid to the various labor types at the kiln.
2The precise royalty depends on the state in India in which the kiln is located. Some are fixed sums for the year, others are fixed sums plus variable amounts per 1,000 bricks made. In variable scenarios, the brick kiln owners can pay bribes to reduce the royalty, and they often “cook” the books to show a lower number of bricks produced and sold. The weighted average of kilns across northern India for which I secured data is around $9,000.
3Almost all kiln owners offer bribes to local officials to avoid paying full taxes. These rates vary, but the figure tends to be around 8% of operating revenues (excludes laborer debt repayment) or less.
4Assumes remaining bricks produced but not sold during the season are sold during the off-season at a 20% price premium; only associated costs are government royalty, tax bribe, depreciation, and one foremen and accountant.
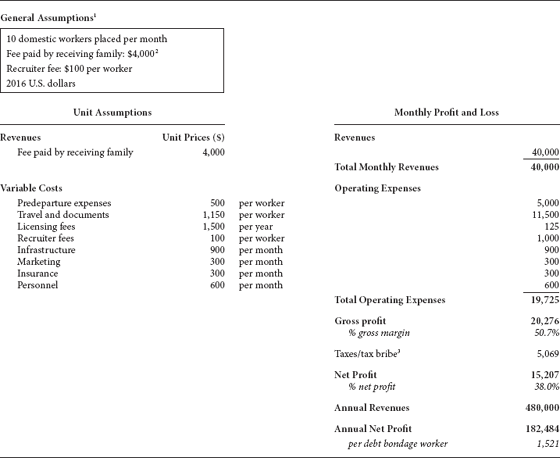
TABLE B.6 Debt Bondage: Domestic Work (South Asia to Middle East)
1This profit and loss statement is modeled from the standpoint of the domestic worker placement agency in South Asia, the primary economic beneficiary of debt bondage exploitation. The employing family also would benefit economically through the underpayment or nonpayment of wages; other intermediaries and destination country agencies can benefit from the exploitation as well.
2Some families will pay this amount in full up front, then deduct payment from worker wages; others will pay a portion of the fee up front then deduct the corresponding amount from worker wages.
3Assume 25% tax rate on the business.
TABLE B.7 Labor Trafficking: Agriculture (Mexico to California)1
1This profit and loss statement is modeled from the standpoint of a nonintegrated FLC in California; a different model would be used for a vertically integrated FLC that includes recruitment and border crossing agents in Mexico, as well as modest economic benefits for the nonintegrated recruiters and coyotes contracted by the nonintegrated FLC.
2Assume aggregate tax rate of 25% for the FLC.
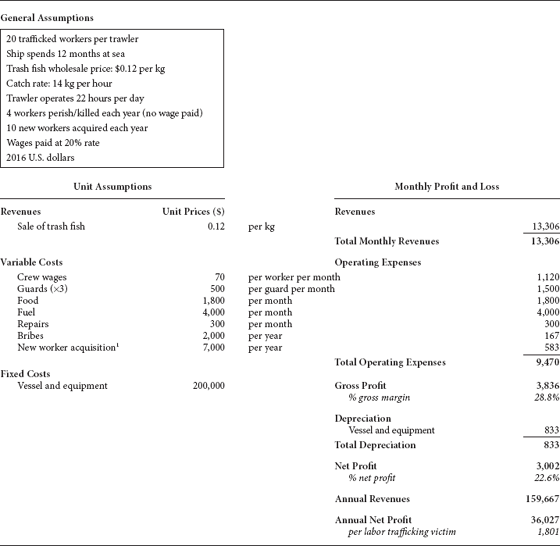
TABLE B.8 Labor Trafficking: Trash Fish (Myanmar to Thailand)
1Half of the crew is assumed to refresh annually, so acquisition cost is expensed and not depreciated.
TABLE B.9 Forced Labor: Carpet Weaving (Nepal)
1Almost all carpet loom owners offer bribes to local officials to avoid paying full taxes. These rates vary, but the figure tends to be around 5% of operating revenues.
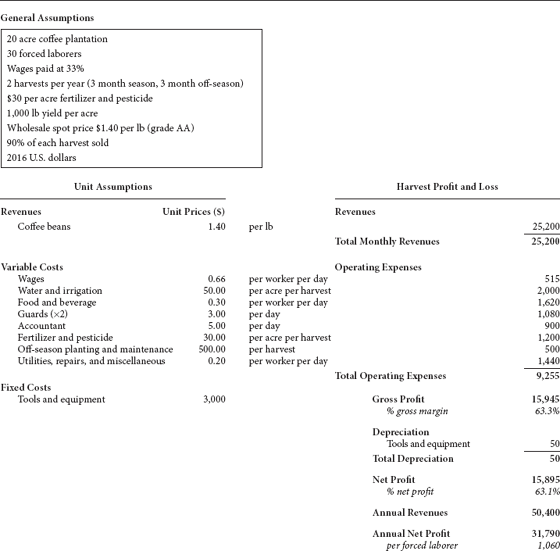
TABLE B.10 Forced Labor: Coffee (Colombia)


