| Lines | Not Lines | |
| y = 3x − 2 | m = 3, b = −2 | y = x2 |
| y = −x + 4 | m = −1, b = 4 |

|
| These are called linear equations. | These equations are not linear. | |
The relationship y = 2x + 1 formed a line in the coordinate plane, as you saw. You can actually generalize this relationship. Any relationship of the following form represents a line:
| y = mx + b | m and b represent numbers (positive, negative, or 0) |
For instance, in the equation y = 2x + 1, you can see that m = 2 and b = 1:
| Lines | Not Lines | |
| y = 3x − 2 | m = 3, b = −2 | y = x2 |
| y = −x + 4 | m = −1, b = 4 |
|
| These are called linear equations. | These equations are not linear. | |
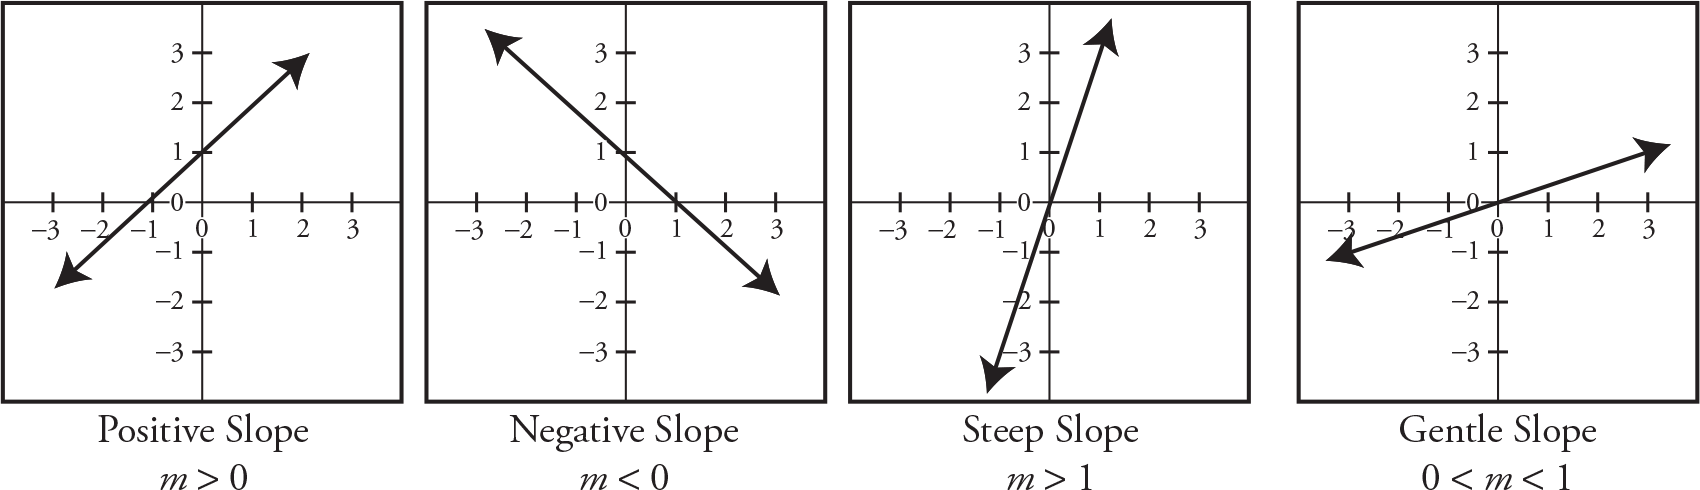
The numbers m and b have special meanings when you are dealing with linear equations. First, m = slope. This tells you how steep the line is and whether the line is rising or falling:
Next, b = y-intercept. This tells you where the line crosses the y-axis. Any line or curve crosses the y-axis when x = 0. To find the y-intercept, plug in 0 for x in the equation:
|

|
By recognizing linear equations and identifying m and b, you can plot a line more quickly than by plotting several points on the line.
Find the slope and y-intercept of the following lines.
y = 3x + 4
2y = 5x − 12
Now the question becomes, how do you use m and b to sketch a line? Plot the line
 .
.
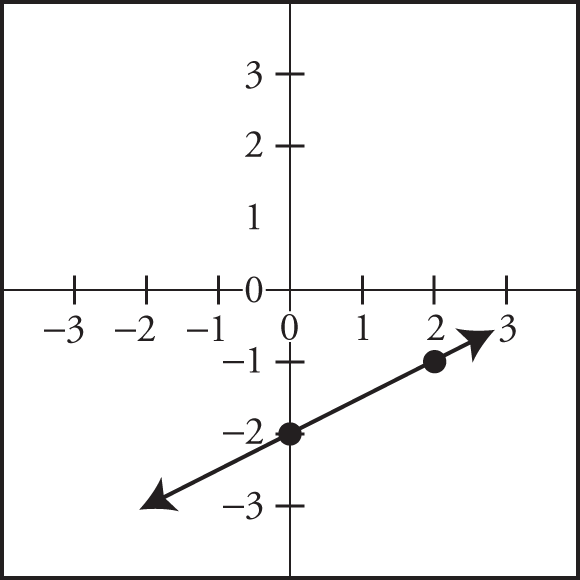
The easiest way to begin graphing a line is to begin with the y-intercept. You know that the line crosses the y-axis at y = −2, so begin by plotting that point on your coordinate plane:

Now you need to figure out how to use slope to finish drawing your line. Every slope, whether an integer or a fraction, should be thought of as a fraction. In this equation, m is
 . Look at the parts of the fraction and see what they can tell you about your slope:
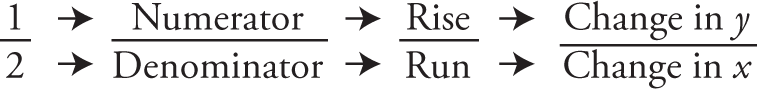
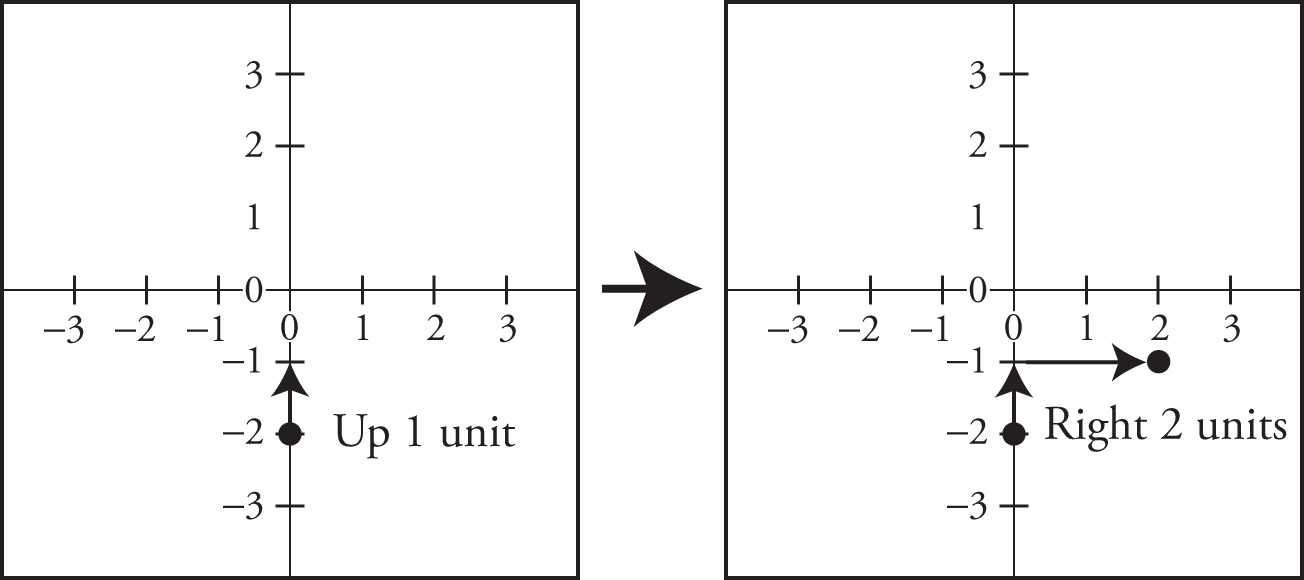
The numerator of your fraction tells you how many units you want to move in the y direction—in other words, how far up or down you want to move. The denominator tells you how many units you want to move in the x direction—in other words, how far left or right you want to move. For this particular equation, the slope is
 , which means you want to move up 1 unit and right 2 units:
After you went up 1 unit and right 2 units, you ended up at the point (2, −1). What that means is that the point (2, −1) is also a solution to the equation
 . In fact, you can plug in the x value and solve for y to check that you did this correctly:

What this means is that you can use the slope to generate points and draw your line. If you go up another 1 unit and right another 2 units, you will end up with another point that appears on the line. Although you could keep doing this indefinitely, in reality, with only two points you can figure out what your line looks like. Now all you need to do is draw the line that connects the two points you have, and you’re done:
|

|
This line is the graphical representation of
 .
.
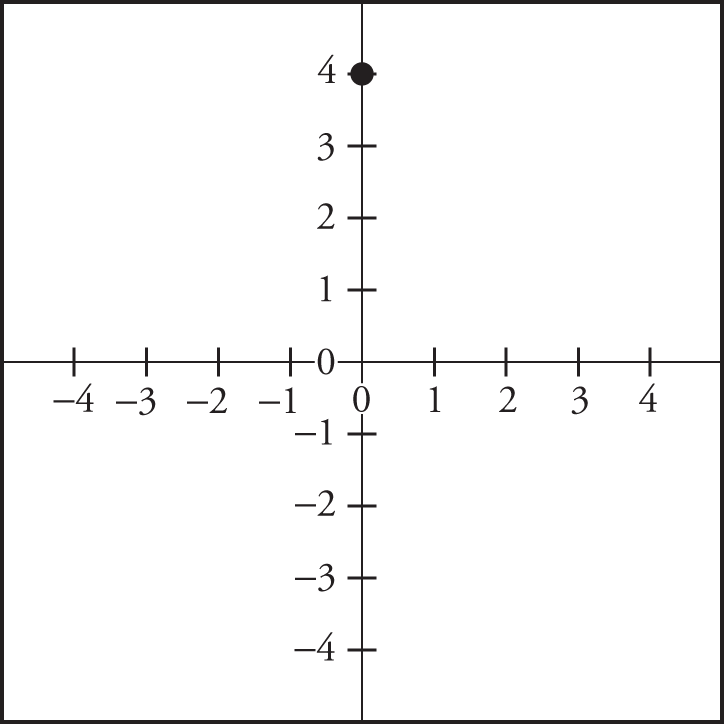
Try another one. Graph the equation

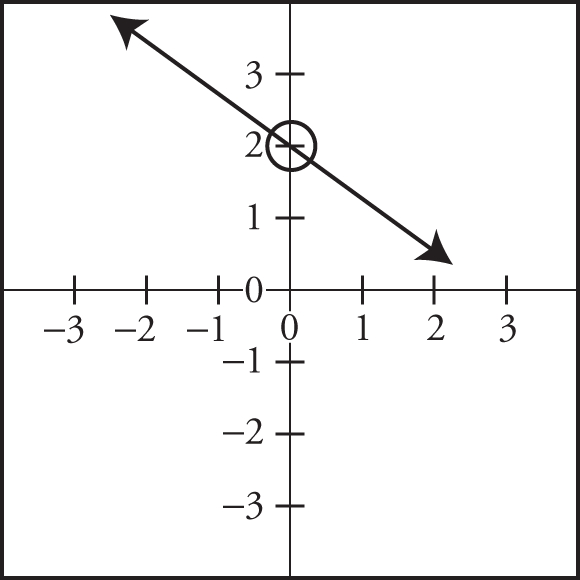
Once again, the best way to start is to plot the y-intercept. In this equation, b = 4, so you know the line crosses the y-axis at the point (0, 4):
Now you can use the slope to find a second point. This time, the slope is , which is a negative slope.
While positive slopes go up and to the right, negative slopes go down and to the right. You might think of it this way: if the “rise” is negative, that is like a “drop” or “fall.” Now, to find the next point, you need to go down 3 units and right 2 units:

That means that (2, 1) is another point on the line. Now that you have two points, you can draw your line:

|

|
Draw a cοοrdinate plane and graph the line y = 2x − 4. Identify the slοpe and the y-intercept.