Most GRE Data Interpretation questions focus on data in five standard formats. You will be much faster at extracting the data if you are already familiar with reading these types of tables and graphs. GRE DI charts always tell a data story, and the questions you will be answering are about that story. To understand these charts and how they work, you will be looking at a simple data story about a produce stand. The owner of the produce stand has some numbers for the amounts of the different types of produce sold per month over a one-year period. For one month, the owner also has some detailed data on exactly which fruits and vegetables were sold. How might the GRE present this story? There are various ways, but all involve the five basic types of charts.
As you work through the examples, you will notice that many problems also involve FDP calculations, and you will find that you will be much faster at those calculations if you already know various standard formulas, such as the percentage increase/decrease formula, and computation shortcuts, such as estimating fractions. You will also notice that the solutions to the problems point out the various computation tricks. Use the calculator when it’s easy to, but also work on developing estimation techniques. This will ultimately save you time.
Look carefully at the solutions and you will also see that they follow the previously described problem-solving process. As an exercise, you might want to cover up the solution steps with a piece of paper and see if you can predict, from the general problem-solving process, what the next step should be as you work through the solution and uncover each step. Although there are many ways to solve these problems, time is critical on the GRE, and learning to follow a standard process and use computation shortcuts will ultimately save you a great deal of time and stress.
A pie chart is used to show the relative sizes of slices as proportions of a whole. The size of the angle of the pie slice is proportional to the percentage of the whole for each item. Even if a pie chart shows amounts instead of percentages, data is shown in pies because percentages, or relative quantities, are important to the story. If you see data in a pie chart on the GRE, you know that there will be one or more questions about percentages or proportions.
Also, many pie charts include a total amount annotated on the chart. If you see this feature, you can be almost certain that the GRE will ask you to calculate an absolute quantity of some item shown in the pie and that the best way to do so will be to use that number and multiply it by the relevant percentage.
A pie chart can only show one series of data, so if you see two pies, which sometimes occurs on the GRE, they represent two series of data and you can be just about certain that one or more of the questions will ask you to compare something in the two different data series.
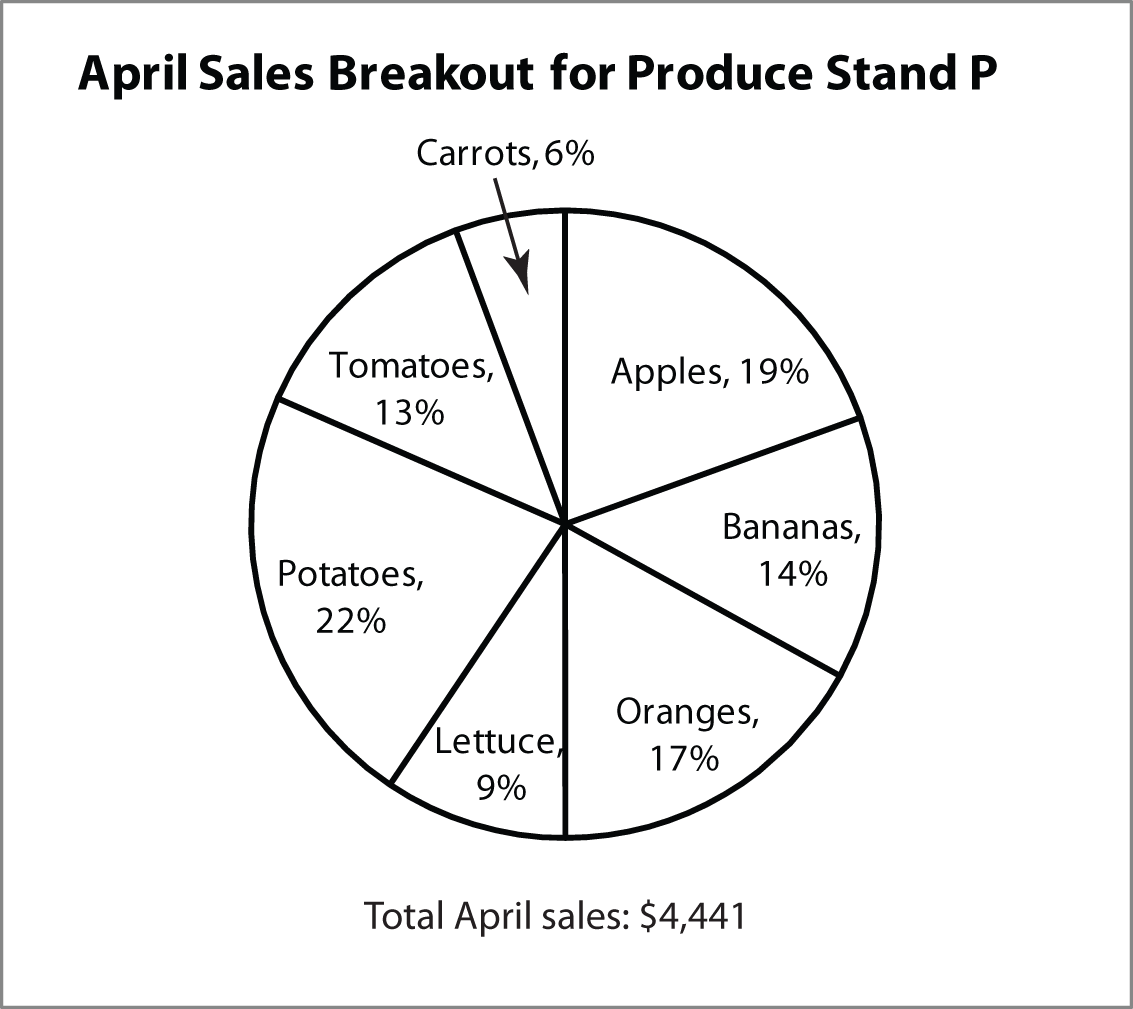
Following are some common calculations that you might be asked to perform on the example pie chart, which shows the April sales breakout for the produce stand:

Approximately what amount of total sales in April came from sales of apples, bananas, and oranges?
The question asks for the sum of the absolute dollar amount of total sales of apples, bananas, and oranges.
The only chart you have is a pie chart showing percentages, so this question is asking you to convert from percents to dollar amounts.
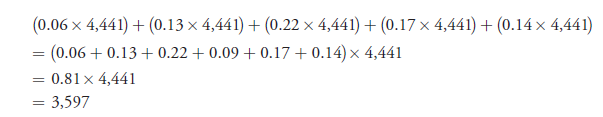
You have apples at 19 percent, bananas at 14 percent, and oranges at 17 percent, and total sales were $4,441. So you need to set up a mathematical expression for the amount of sales that come from apples, bananas, and oranges:
|
(0.19 × 4,441) + (0.14 × 4,441) + (0.17 × 4,441) = 2,220.5 |
|
You can do this more efficiently by summing the percentages before you multiply by the total sales:
| = 4,441 × (0.19 + 0.14 + 0.17) = 4,441 × (0.50) =2,220.5 |
Sum the percentage so you only multiply by one number. The question says approximate, so A must be the answer. |
If sales of potatoes were to increase by $173 next month and sales of all other items were held constant, approximately what percentage of the total sales would be potatoes?
The question asks the new ratio of potato sales to total sales, after adding $173 in potato sales.
The only chart you have is a pie chart showing percentages, but it has a total quantity and a percentage from potatoes: 22 percent of total sales are from potato sales and there is $4,441 in total sales.
Set up a mathematical expression:

|
|
Important: Note that the denominator of the fraction above takes into account that the $173 of new potato sales must be added not only to the potato sales but to the total sales as well. That is, the total sales is no longer the $4,441 from the chart because additional sales have been made.
The answer is (B).
If the areas of the sectors in the circle graph are drawn in proportion to the percentages shown, what is the approximate measure, in degrees, of the sector representing the percent of total sales due to lettuce?
The question asks for the degree measure of the lettuce wedge on the chart.
The only chart you have is a pie chart showing percentages; that’s the chart you use.
You have 9 percent of total sales from lettuce, so lettuce represents 9 percent of the 360-degree circle.
Writing this in math form, you get:
The answer is (C).
A column chart shows amounts as heights. Typically, the x-axis is time (e.g., months, years) and column charts are used to show trends over time.
Often the hardest thing about a column chart is just reading the values. The GRE never makes an exact value reading critical to answering a question unless numeric values are explicitly given (and even then you can usually just round), so just raise your index finger up near the computer monitor, draw an imaginary line across the chart, and estimate approximate quantities.
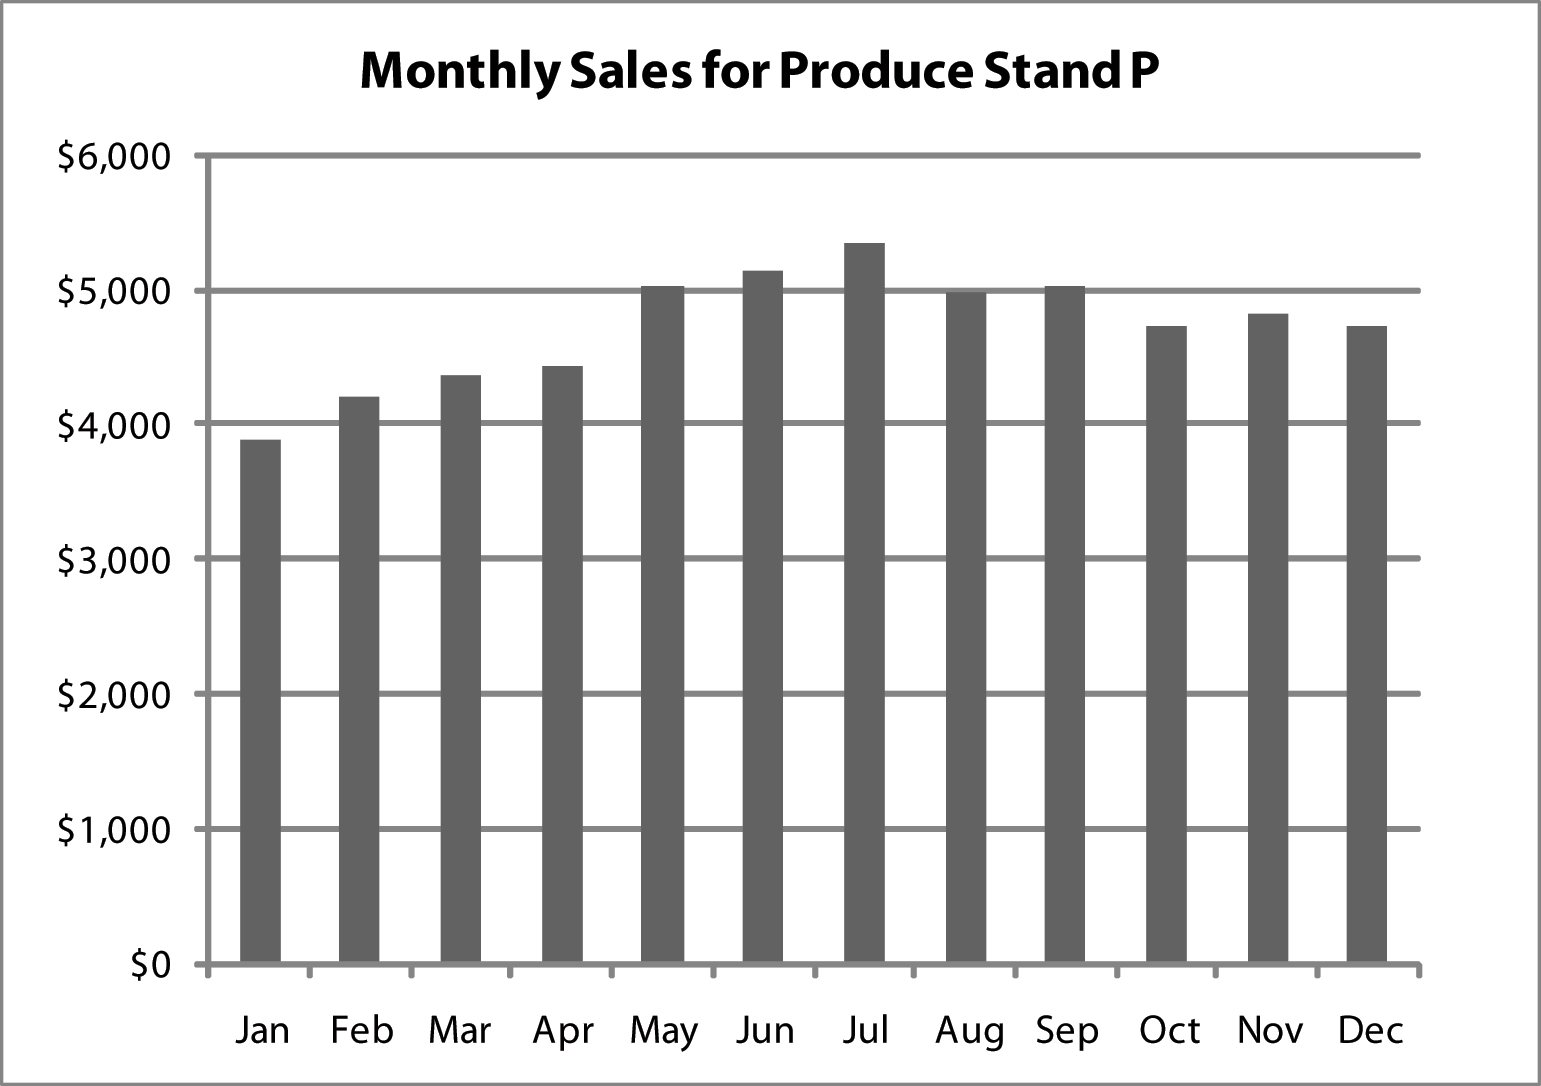
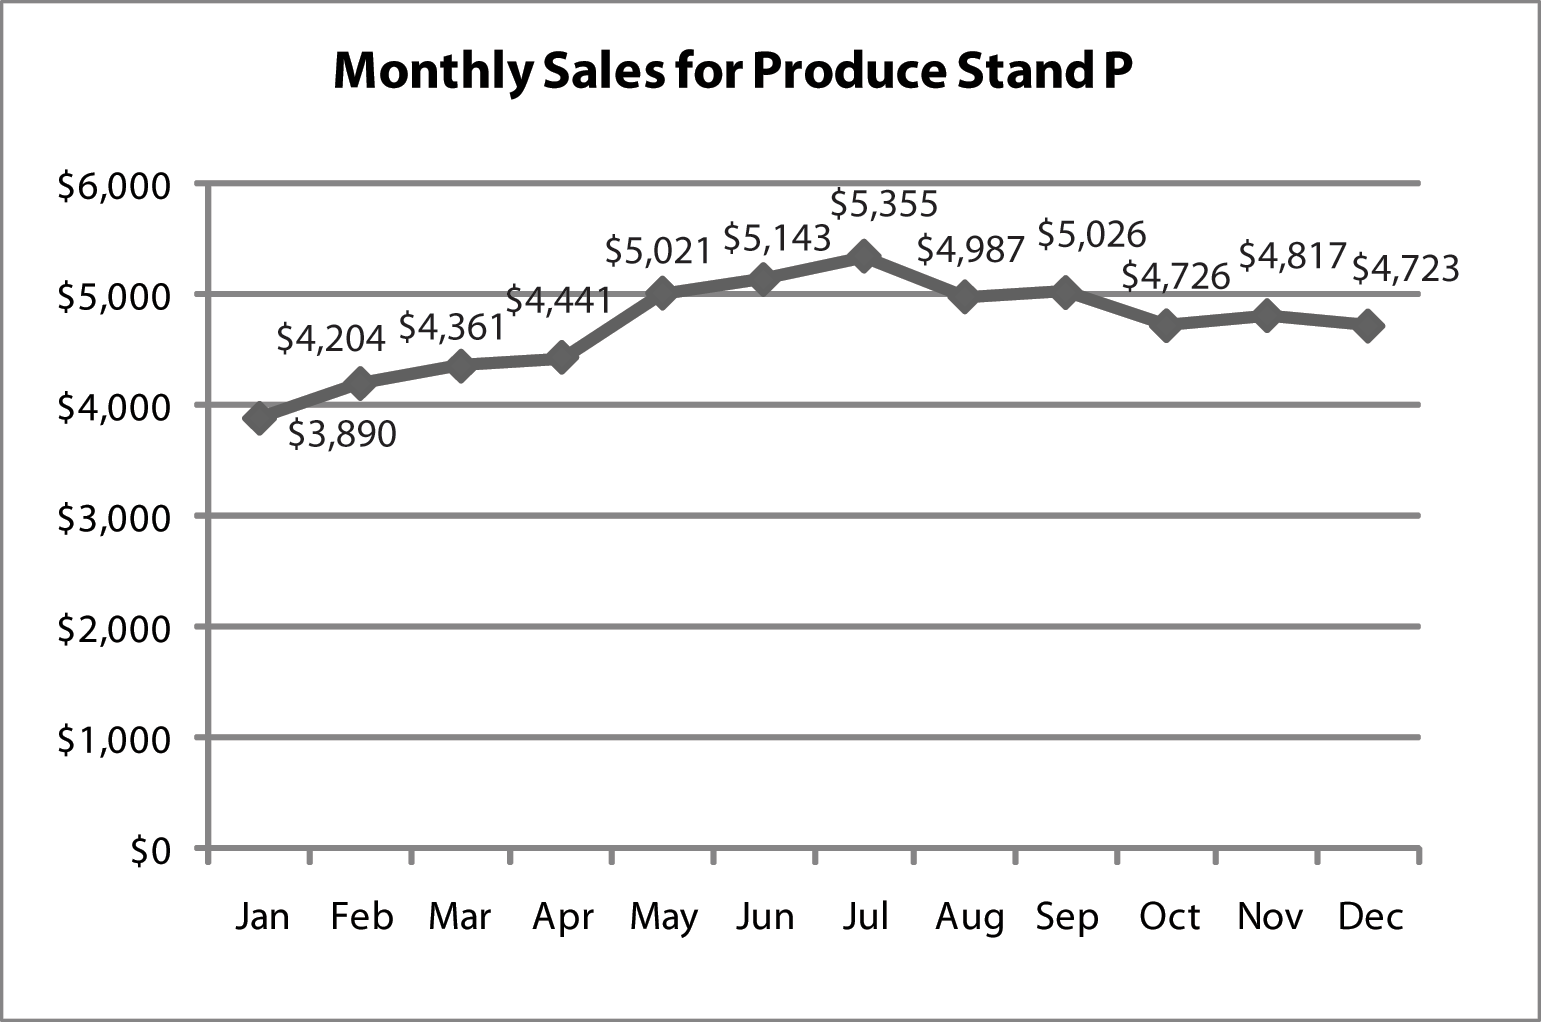
A single data series chart is so straightforward that it doesn’t usually even have a legend. Here is an example showing the produce stand’s sales:
Some common calculations that you might be asked to perform are percentage increase or decrease from one time period to the next, or even more simply, just counting the number of periods when data values were above or below a particular value:
Approximate percentage increase in sales from April to May:

|
|
Number of months when sales were less than February sales is 1.
In how many of the months shown were total produce sales greater than $4,600?
The question asks you to count the number of months shown that were greater than $4,600.
The only chart you have is this column chart, and it shows the sales for each month directly, so you can just read the chart.
Most months appear to have sales greater than $4,600, therefore, count the number of months in which sales were less than $4,600 and subtract from the total number of months shown, which is 12.
Months when sales were less than $4,600: Jan, Feb, Mar, Apr, so number of months when sales were greater than $4,600 equals 12 − 4, or 8, and the answer is (B).
The GRE is especially fond of stacked column charts because they can be used to show two or more data series at a time, as differently shaded parts of one column. For instance, “vegetable sales” and “fruit sales” sum to “total sales.” This makes it as easy to answer questions that ask about the total as it is with just a single data series in the chart.
However, it is a little harder to read off vegetable sales by itself—you have to calculate total sales minus fruit sales, so you can be almost certain that you will have a question that asks you to do something like this.
Notice also in the following example, which breaks out the monthly sales of the produce stand into fruit and vegetable sales, that charts that show multiple data series have legends so you can tell which part of the bar represents which category:
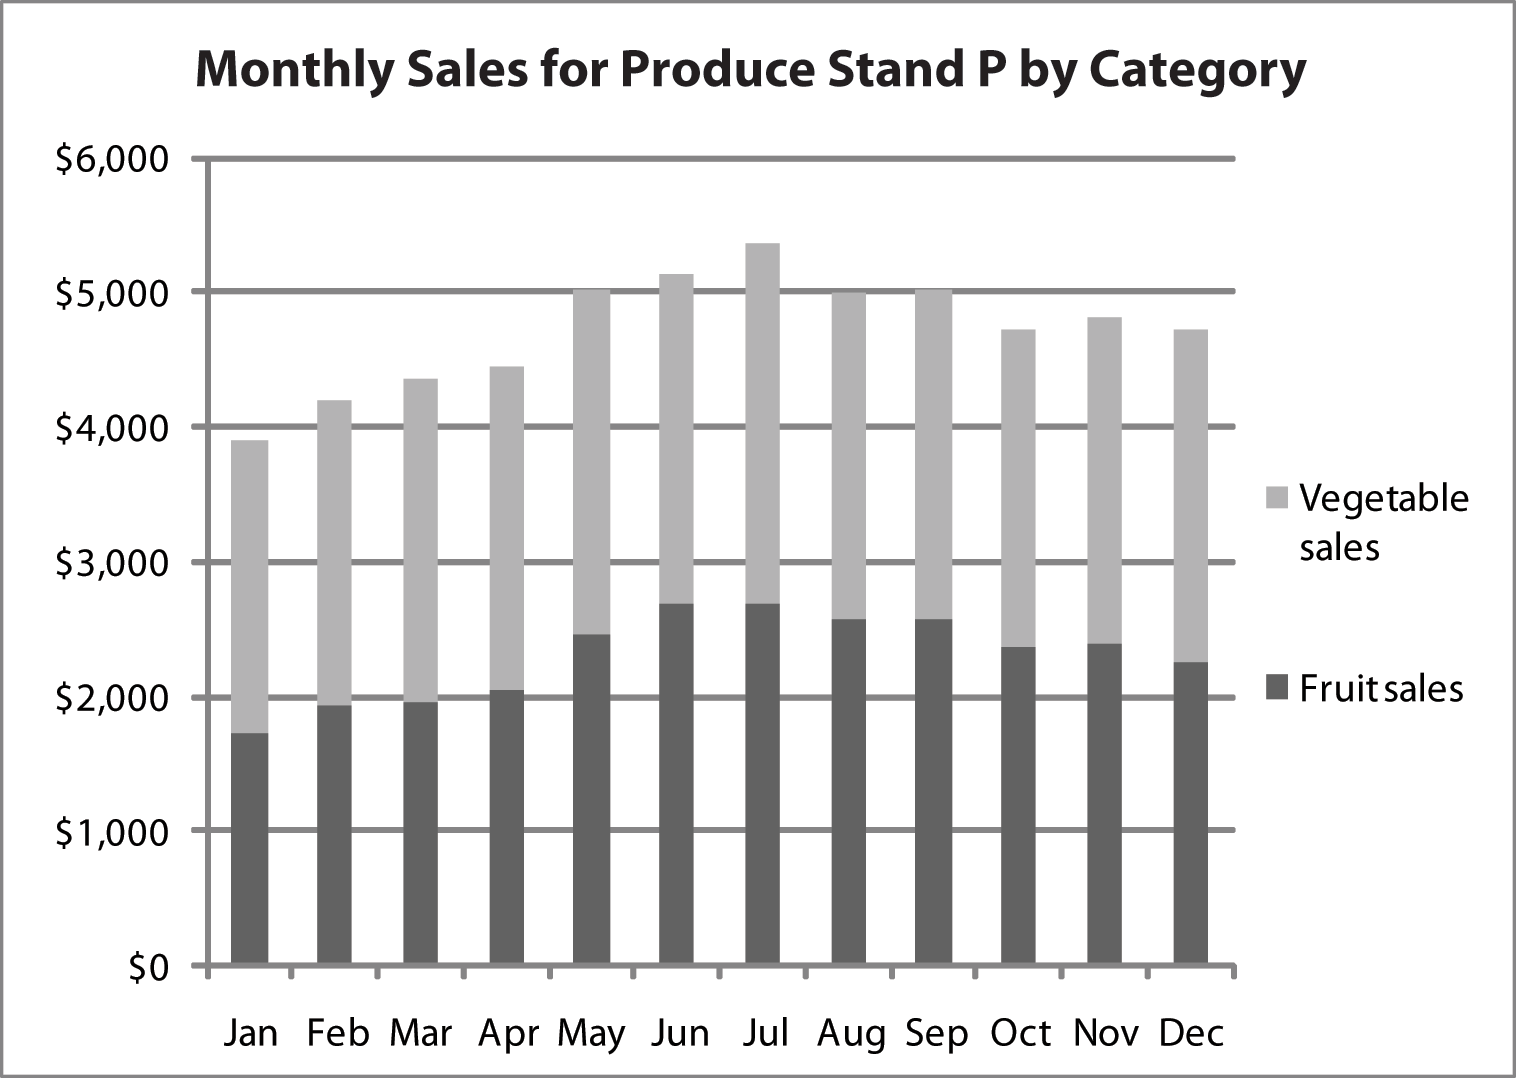
Approximately what were total vegetable sales in September?
The question asks you to figure out vegetable sales in September.
The only chart you have is this column chart, and it shows the vegetable sales for each month directly, so you can just read the chart.
To get vegetable sales, you need total sales minus fruit sales. For September, that is equal to about $5,000 − $2,500, or $2,500 and the answer is (D).
Another variation on column charts has clustered columns instead of stacked columns. Clustered column charts make it easier to compare the parts of the total, but more difficult to determine the actual total because you have to sum the columns.
The types of questions that would be asked about a clustered column chart are the same as those that would be asked about a stacked column chart. The only difference between the two types is that it is easier to read a total quantity off of a stacked column chart, but easier to read the height of an individual series item, such as total vegetable sales in June, off of a clustered column chart. The following example shows exactly the same data as the previous stacked column chart showed, except in the clustered column format:
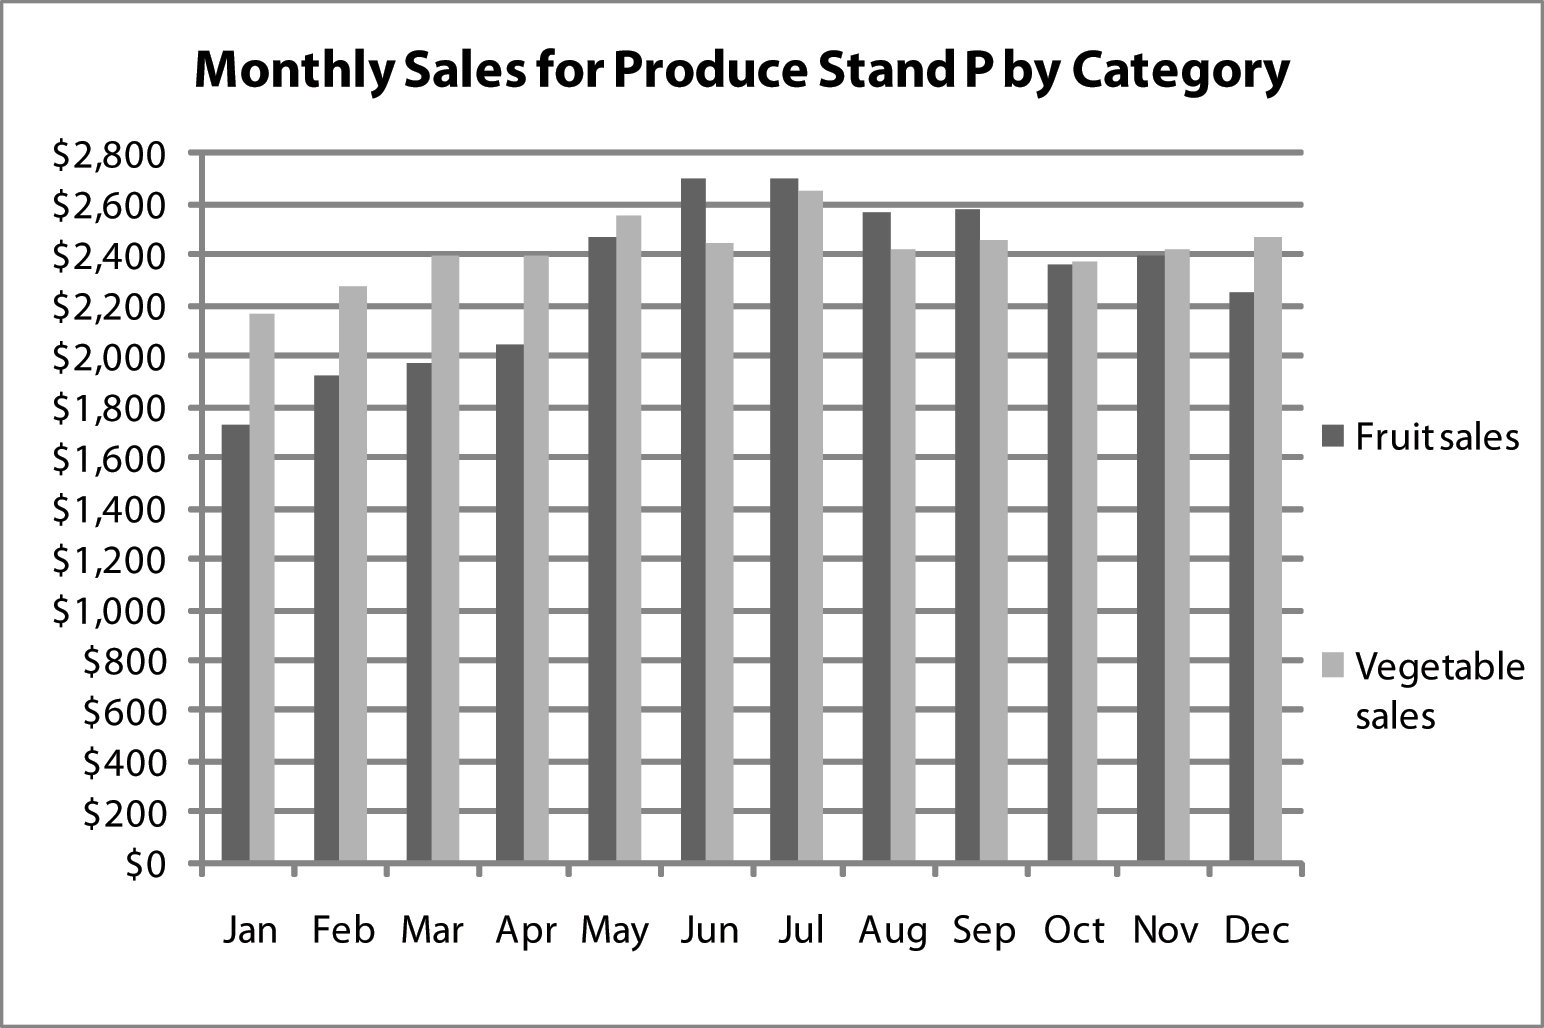
Which month had the largest percentage of vegetable sales relative to total sales?
The question asks you to compare the ratio of vegetable sales to total sales for several months.
The only chart you have is this column chart, and it shows the sales for each month directly, so you can just read the numbers and calculate the ratios.
The formula for the ratio of vegetable sales to total sales is:

The key to solving this problem is realizing that you don’t have to do calculations for all of the months. In January and March, vegetable sales were substantially larger than fruit sales, so they were more than half of total sales, whereas in June, October, and November, they were about the same or actually less than fruit sales, so the only months you really have to look at are January and March.
Because the difference in fruit and vegetable sales is about the same in both months, but total sales are much greater in March, the same absolute difference in fruit sales is a greater percentage of the total sales in January than it is in March, so the answer is (A).
You can verify this with a calculator:
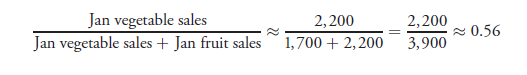
|
|
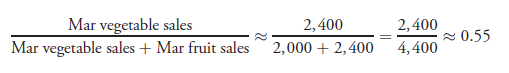
|
Occasionally the GRE uses column charts to show percentages directly, rather than absolute quantities. If you see this type of chart, and you need quantity information, you will need another chart to provide actual values.
Otherwise, the types of questions that would be asked about a percentage column chart are the same as those that would be asked about a stacked column chart. The following example shows a typical percentage column chart:

If the total produce sales in July at Produce Stand P were $4,500, what were the approximate total fruit sales in December at Produce Stand P?
The question asks you to determine the amount of fruit sales in December.
The only chart you have is this column chart, and it shows the percentage of sales due to fruit and the percentage of sales due to vegetables for each month.
The formula for the amount of fruit sales in December is:
Total fruit sales in December = % fruit sales × Total sales in December
However, you have no information on total sales in December. You cannot assume that total sales in December are the same as in July, so you cannot answer this question. The answer is (E).
Line charts are very similar to column charts, but each amount is shown as a floating dot instead of as a column, and the dots are connected by lines. As is true with column charts, often, the x-axis is time (e.g., months, years), and line charts are used to show trends over time. Because of the continuous nature of lines, data series that are shown in line charts are almost always continuous values for something, and not separate categories, as they sometimes are in column charts.
Here is an example showing the produce stand’s sales in a line chart:
Some common calculations that you might be asked to perform are percentage increase or decrease from one time period to the next, the change in the overall average value of the data points if one of them changes, or even more simply, a count of the number of periods when data values were above or below a particular level:
Approximate percentage increase in sales from April to May:
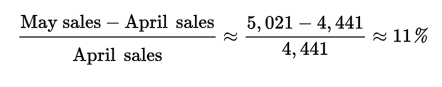
|
Number of months when sales were less than July sales is 11.
If the average sales per month at Produce Stand P were calculated at $4,725, and then it was discovered that the sales in January were actually $4,072 instead of the amount shown, what would the approximate correct average sales per month be?
The average sales per month is just the total of all the monthly sales divided by the number of months.
The only chart you have is this line chart, and it shows the monthly sales. The old amount for January was $3,890.
The average formula is:

|
The total sum of the monthly sales has increased by 182, therefore, the average of the 12 monthly sales has increased by about 182 ÷ 12 or about 15, so the answer is (A).
You can verify that this is correct by examining the algebra:

|
|
The correct answer is (A).
Problem Recap: The GRE likes these changing average problems. Remember the average change estimation shortcut!
What was the approximate percent increase in total sales at Produce Stand P from January to June?
To calculate the percent increase from January to June, you need the total sales in January and the total sales in June.
The only chart you have is this line chart, and it shows the monthly sales. The amount for January is $3,890 and the amount for June is $5,143.
The percent increase formula is:

|
|
|
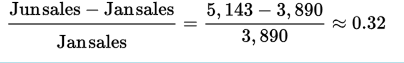
|
The answer is (D).
The GRE is especially fond of multi-line charts because they can be used to show two or more data series at a time. Note that multi-line charts, like stacked and clustered column charts, have legends.
In the following example, you have vegetable sales and fruit sales. With line charts, you have to sum data points to calculate a total, because a total line is seldom shown (column charts are used when the goal is to emphasize the total).

In addition to questions that require you to pick out data points from one of the data lines, expect that on at least a few questions you will be asked to either combine or compare the data that make up one line to the data that make up the other:
Approximate percentage increase in fruit sales from Jan to May:

|
|
Number of months when vegetable sales were more than $100 greater than fruit sales is 5 (i.e., Jan, Feb, Mar, Apr, and Dec).
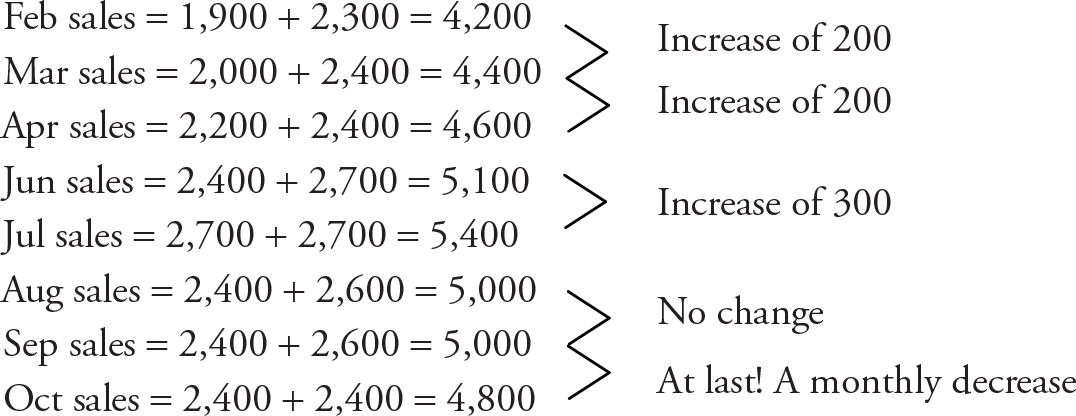
Over which of the following sequences of months did total sales decline the most?
Total sales are the sum of fruit and vegetable sales, and a decline means that at least one of the two would have to go down, and that drop would have to be bigger than any increase in the other category.
The only chart you have is this line chart, and it shows the monthly sales, although it doesn’t add them up for you.
You hardly need a formula, because total sales are just the sum of fruit sales plus vegetable sales.
By scanning through the graph, you see that from Feb–Mar and Mar–Apr, both fruit and vegetable sales increased, so there was no decline. From Jun–Jul, vegetable sales increased, but fruit sales stayed flat, so still no decline. Aug–Sep also looks like a slight increase for both fruit and vegetable sales. However, from Sep–Oct, both fruit and vegetable sales seem to have declined, so the correct answer must be (E).
The long way to do this problem is to read both fruit and vegetable sales and calculate approximate total sales for each month:
This would take entirely too long!
If the average price that the Produce Stand P sold fruit for in May was 80 cents per pound and the average wholesale cost to the Produce Stand in May for a pound of fruit was 25 cents per pound, approximately how much was produce stand P’s gross profit on the sale of fruit in May?
To solve this, you need to remember that Gross profit equals Sales revenue minus Costs. If you can plug in for fruit sales revenue and fruit cost, you can answer this question.
The only chart you have is this line chart, and it shows the monthly fruit sales revenue in May, so you may be able to figure this out.
The answer choices are too close together to estimate, so you’ll have to calculate.
You know that May fruit sales revenue is about $2,500. You know that the average wholesale cost per pound of fruit was $0.25 and that the average retail price per pound of fruit was $0.80. Thus:
Average gross profit per pound of fruit sold in May = 0.80 − 0.25 = 0.55
|
|
|
|
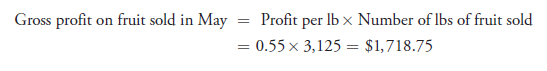
|
A bar chart is essentially a column chart on its side. Although almost all bar charts on the GRE show absolute quantities, it is possible for them to show percentages. Because these more exotic charts are so rare on the GRE and are essentially types of column charts on their sides, this section focuses on standard bar charts.
The GRE generally represents a single data series in each bar chart, and, like pie charts, some bar charts include a total amount annotated on the chart.
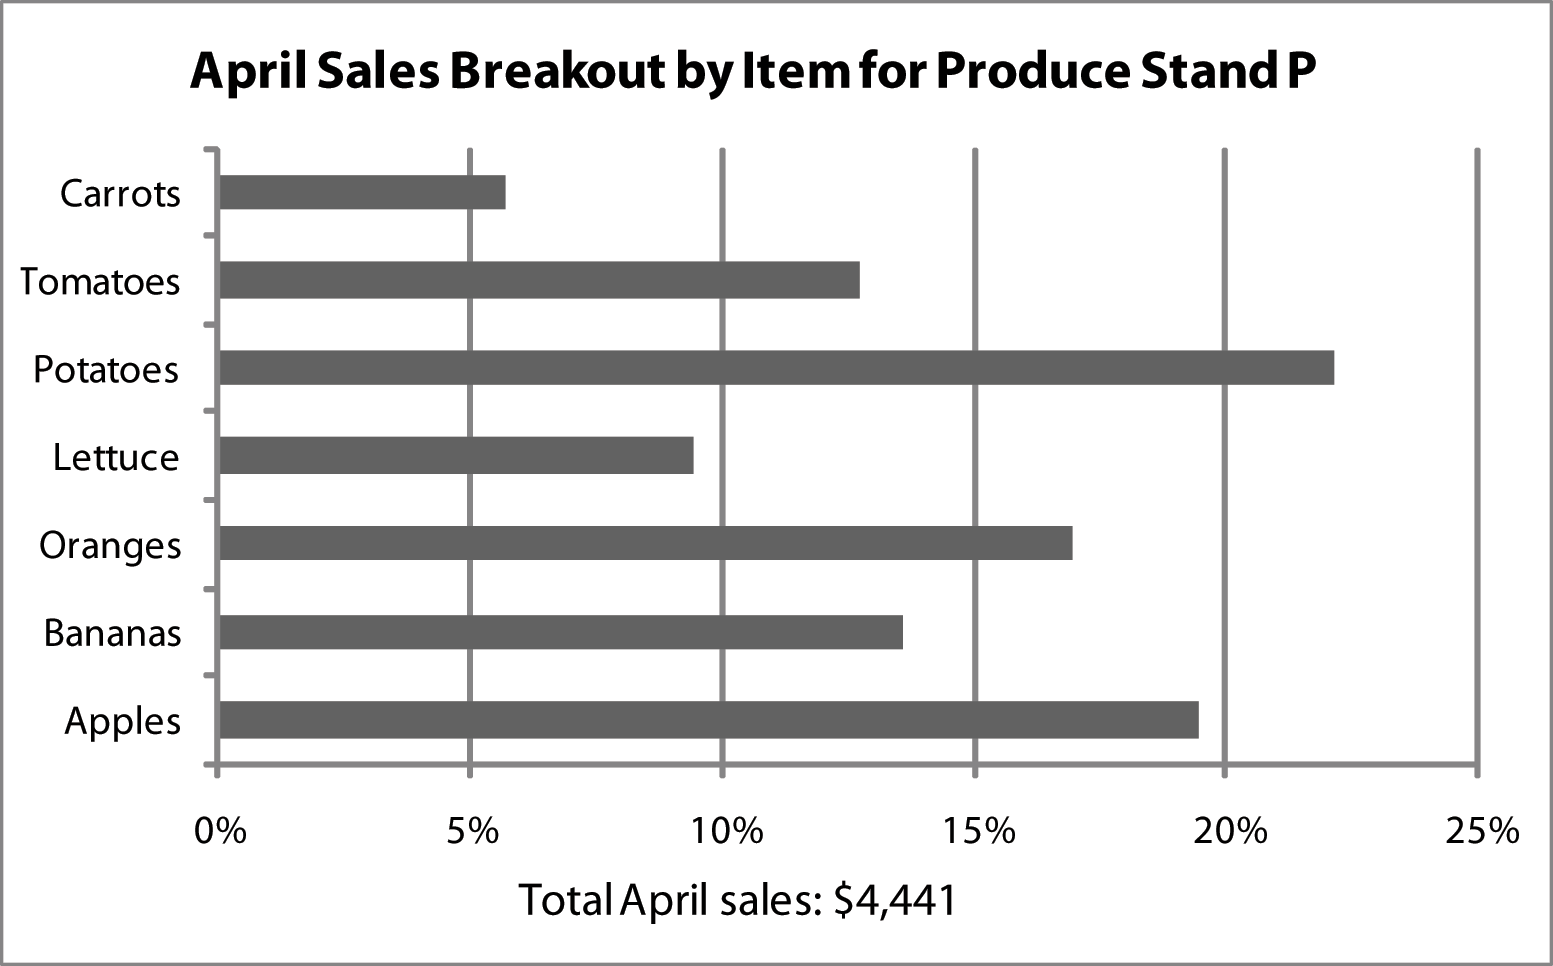
Here is an example showing the April sales breakout by item for Produce Stand P. The length of each bar represents either an absolute number or a percentage. In this case, it’s an absolute number:

What fruit or vegetable generated the third highest sales in April for Produce Stand P?
The question asks you to figure out the fruit or vegetable that generated the third highest sales in the month of April.
The only chart you have is this bar chart, and it shows the sales for each fruit and vegetable in April.
Scanning the chart, you see that potatoes had the highest sales, then apples, and third were oranges. So the answer must be (C).
Which of the following ratios is closest to the ratio of carrot sales to potato sales at Produce Stand P in the month of April?
To calculate the ratio of carrot sales to potato sales in April, you need to know those amounts, and the chart gives them to you.
The chart shows carrot sales were about $250 and potato sales were about $980:

|
|
The answer is (A).
A table is a very straightforward way to present data when calculations using that data are required because there is no need to estimate numbers. The thing that a table doesn’t do, though, is allow you to easily see trends or estimate using visual techniques.
Often, one table will contain a mix of absolute quantities and percentage data. Be careful not to confuse the two. The GRE does not always label individual percents with a percentage sign. Rather, the entire row or column is generally labeled as such in the row or column header.
If you have to do calculations, and you probably will if you are given a table, it will be easy to look up the numbers. Here is an example of a table that combines absolute quantity information with percentage information for the produce stand:
Monthly Sales Breakout for Produce Stand P
| Month | Total (in Dollars) | % Fruit | % Vegetable |
| Jan | 4,121 | 44.29 | 55.71 |
| Feb | 4,204 | 45.74 | 54.26 |
| Mar | 4,361 | 45.10 | 54.90 |
| Apr | 4,568 | 49.99 | 54.06 |
| May | 4,791 | 49.17 | 50.83 |
| Jun | 4,756 | 52.40 | 47.60 |
| Jul | 4,822 | 50.38 | 49.62 |
| Aug | 4,791 | 51.41 | 48.59 |
| Sep | 4,801 | 51.21 | 48.79 |
| Oct | 4,726 | 49.89 | 50.11 |
| Nov | 4,817 | 49.78 | 50.22 |
| Dec | 4,881 | 47.77 | 52.23 |
Approximately how many dollars’ worth of vegetables were sold in September, October, and November combined by Produce Stand P?
The question asks you to calculate the dollars’ worth of vegetable sales in September, October, and November.
You can do this because the chart shows the total sales for each month and the percentage of those sales that were due to vegetables. In September, vegetable sales were 48.79% of $4,801; in October, 50.11% of $4,726; and in November, 50.22% of $4,817. Next, calculate as follows:

|
|
The answer is (D).
Occasionally, other common types of diagrams, such as floor plans or outline maps, appear on the GRE. The good news is that although these diagrams are a little less familiar than the basic five, the questions that go with them tend to be a little bit easier. There are questions that ask you to calculate surface area (of walls) and volume of rooms, but far fewer of the more challenging percent change and “how many points satisfy this complicated set of criteria” variety.
So far, you’ve looked at the usual types of charts seen in GRE Data Interpretation and typical questions based on those charts. However, the GRE often complicates things by asking questions that require that you look up and integrate information from multiple charts. This type of multi-chart question is not mathematically harder than a single-graph question, but since it requires using data from two different graphs, it can be a bit more confusing. Efficient solving techniques and good scrap paper organization become even more valuable with multiple charts, because more charts mean more opportunities to become confused and waste time. The next example combines two types of charts that you’ve seen before, and asks questions that require using information from both of them:
Vitamin Content of Produce Items Sold at Produce Stand P in April
| Vitamin C Content | Vitamin A Content | |
| Apples | low | low |
| Bananas | medium | low |
| Oranges | high | medium |
| Lettuce | high | low |
| Potatoes | medium | low |
| Tomatoes | high | high |
| Carrots | low | high |
Approximately what were the total April sales of produce items at Produce Stand P that were high in both vitamin A and vitamin C content?
You need to figure out which produce items were high in both vitamin A and vitamin C and calculate the total sales of those items.
The table shows you that only tomatoes are high in both vitamins A and C, so you need total tomato sales.
The bar graph shows you that tomatoes account for about 13% of April sales and that total April sales were $4,441. So you need 13% of $4,441:

|
|
The answer is (C).
Approximately what dollar amount of the produce sold by Produce Stand P in April had medium or high amounts of either vitamin A or vitamin C?
You need to figure out which produce items were high or medium in either vitamin A or vitamin C and calculate the total sales of those items.
The table shows you that bananas, oranges, lettuce, potatoes, tomatoes, and carrots are high in either vitamin A or vitamin C, so you need their total sales.
Most of the produce items are high or medium in either vitamin A or vitamin C, therefore, it will be faster to just calculate the dollar amount of the items sold that are low in both vitamin A and vitamin C and subtract that from the total dollar amount of sales. The table shows that the only produce item that meets these criteria is apples, and the bar graph shows that they accounted for about 19 percent of total sales:

|
|
The answer is (B).
The long way to do this problem is to sum up the percentages of each type of produce that has a medium or high level of vitamin A or vitamin C.
To do this, you need to read a number of values off of the bar graph. Carrots are ≈ 6 percent of sales, tomatoes are ≈ 13 percent, potatoes are ≈ 22 percent, lettuce is ≈ 9 percent, oranges are ≈ 17 percent, and bananas are ≈ 14 percent. Thus:
|
|
That was too much work!