Answers and Explanations
-
7.5

-
$72

-
8
Notice that each term in the set is 3 more than the last. Because this set is evenly spaced, the median and the average will be the same. The median is 8, and so the average is also 8.
-
13
Notice that each term in the set is 4 more than the last. Because this set is evenly spaced, the median and the average will be the same. The number of terms in the set is even, so the median of the set is the average of the two middle terms:
 .
.
-
Stock A
Because the overall gain is closer to 10% than to 20%, the portfolio must be weighted more heavily towards Stock A, (i.e., contain more shares of Stock A).
-
140
Two-thirds of the total population is Zorgs, and so the weight is 2/3. Similarly, the weight of the Weebs is 1/3. Now plug everything into the weighted average formula:

-
2
First order the set from least to greatest:
{6, 2, -1, 4, 0} → {-1, 0, 2, 4, 6}
The median is the middle number, which is 2.
-
 or
or

Because the number of terms is even, the median is the average of the two middle terms. Because 2 < x <8, the lower of the two middle terms will be 2 and the higher of the two middle terms will be x. Therefore, the median is
 , or simplified
 .
.
-
Dataset B
Each dataset has a mean of 5, so the dataset whose numbers are further away from the mean will have the higher standard deviation. When comparing standard deviations, focus on the differences between each dataset. The numbers that each dataset has in common are boldfaced:
Dataset A: {3, 4, 5, 6, 7} Dataset B: {3, 3, 5, 7, 7} Compare the numbers that are not the same. The numbers 4 and 6 in Dataset A are closer to the mean (5) than are the 3 and 7 in Dataset B. Therefore, the numbers in Dataset B are further away from the mean and Dataset B has a greater standard deviation.
-
12 or −8
If x is the smallest number, then 5 is the largest number in the list and 5 − x = 13, so x is −8. If x is the largest number, then −1 is the smallest number in the list and x − (−1) = 13, so x is 12.
-
6
The first thing to do is to list these number elements in order, then determine the cutoff points for Q1, Q2, and Q3:
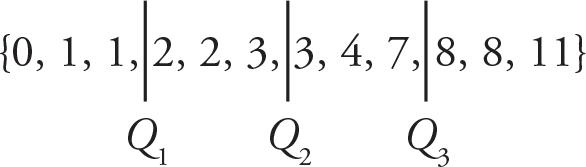

Therefore, Q3 − Q1 = 6.
-
17%
You’re asked approximately what percent of measurements fall below 4. If the mean is 6 and the standard deviation is 2, then a measurement of 4 (= 6 − 2) represents exactly 1 standard deviation below the mean. First of all, approximately 50% of all measurements fall below the mean of a nearly normal distribution. Moreover, about
 of all measurements for such a distribution fall within 1 standard deviation of the mean. That
 represents measurements above and below the mean, so half of that fraction would be the portion between the mean and 1 standard deviation below. Finally, take the 50% that falls below the mean of 6, and subtract off half of the
 that falls between 6 and 4 (1 standard deviation below), as shown:
 are smaller than 4.
 -
Approximately 0.1%
Roughly, 1 in 1,000 observations in a normal distribution will be at or more than 3 standard deviations above the mean.
-
2nd Percentile
Approximately
 , or the 2nd percentile.
 -
No, not necessarily