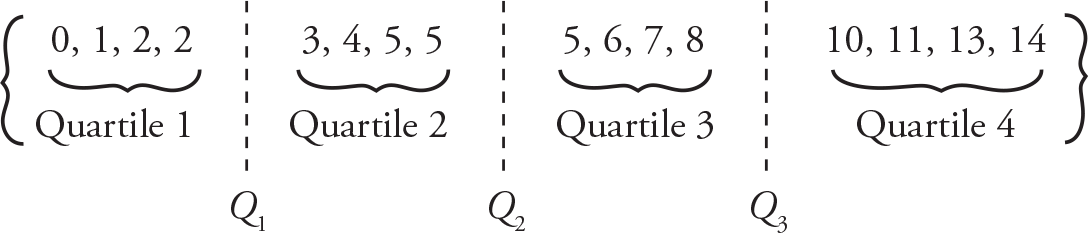
Lists of numbers can be described by Quartiles, and for larger datasets (remember that a dataset is just another word for a list), by Percentiles. For example, consider the following dataset of 16 numbers:
The list is divided into four quartiles, each divided with “Quartile Markers.” Q1 is the average of the highest item in Quartile 1 and the lowest item in Quartile 2, and so on. Thus,
 ,
,
 , and
, and
 . Thus, Q2 is the same as the median of the list.
For a larger dataset (of, say, 1,000 numbers), Percentiles can be used. Thus, in a dataset of 1,000 numbers, the 10 smallest items will be in Percentile 1, and P1 will be the average of the 10th and 11th smallest items. Note that P25 = Q1, P50 = Q2 = median, and P75 = Q3.
In the list {2, 3, 0, 8, 11, 1, 4, 7, 8, 2, 1, 3}, what is Q3 − Q1?